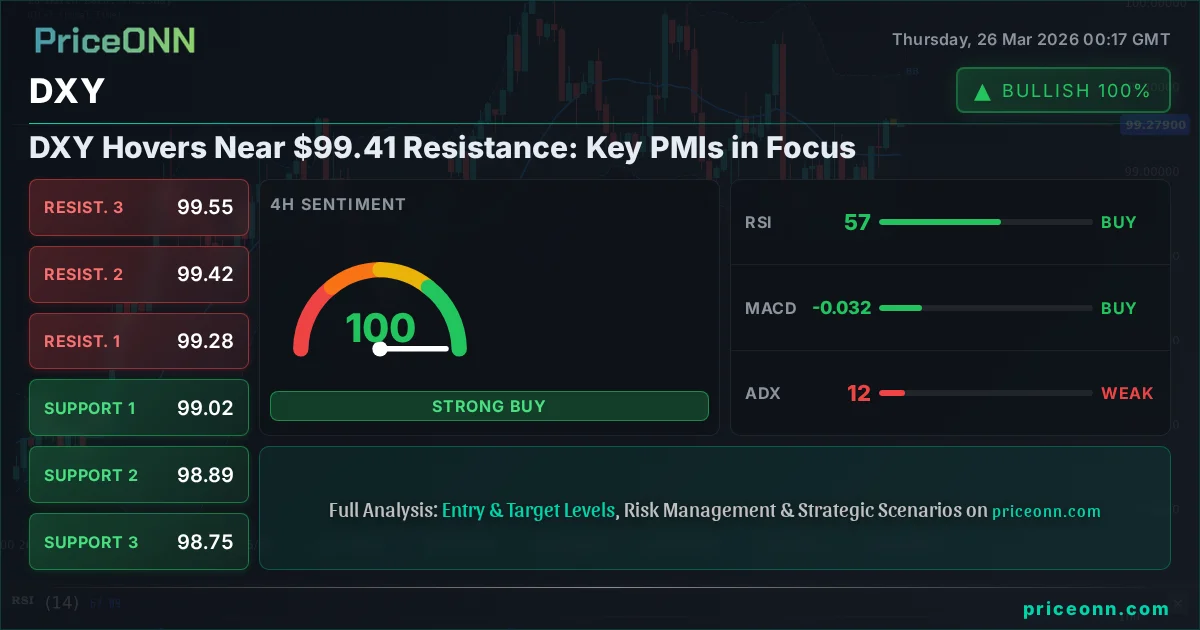
DXY Hovers Near $99.41 Resistance: Key PMIs in Focus
The Dollar Index (DXY) is testing resistance around $99.41. Traders are watching upcoming PMI data for direction amidst mixed technical signals and moderate trend strength.
The Dollar Index, or DXY, is currently perched precariously near a significant resistance level at $99.41. This isn't just another trading day for the DXY; it's a critical juncture where market sentiment, technical indicators, and upcoming economic data are set to collide. Having watched the dollar index navigate various market conditions, I see this moment as particularly telling. The current price action suggests a battle is brewing between the bulls pushing for further gains and the bears looking to capitalize on potential overextension. The question on every trader's mind is: can the dollar break through this key barrier, or will it retreat, signaling a shift in risk appetite? The answer likely lies in the confluence of technical signals and the crucial Purchasing Managers' Index (PMI) data releases on the horizon.
- DXY is trading near resistance at $99.41, with a 1H ADX of 15.7 indicating a weak trend and potential for range-bound trading.
- The 1D RSI stands at 57.7, suggesting upward momentum but not yet in overbought territory, while the 4H Stochastic shows a bullish signal (%K > %D).
- Upcoming PMI data for the US is expected to be crucial, with the latest figures showing a slight improvement to 52.4 (forecast 51.5).
- Geopolitical tensions and central bank policy remain background drivers, with the Fed's stance on inflation being a key focus for the dollar's trajectory.
Looking at the DXY's technical landscape across multiple timeframes reveals a complex picture. On the 1-hour chart, the trend is strongly bullish with 98% power, yet the ADX reading of 15.7 signals a weak trend – a classic sign of choppy, potentially range-bound action. This dichotomy suggests that while momentum might be pushing higher, the conviction behind the move is not yet solid enough for a sustained breakout. The RSI at 66.01 on the 1H chart is climbing but remains in neutral territory, not yet flashing an overbought warning. However, the Stochastic oscillator is deep in overbought territory (K=93.38, D=82.78), indicating that the short-term upward move might be due for a pause or correction. This conflicting signal between RSI and Stochastic on the 1H chart highlights the current indecision in the market.
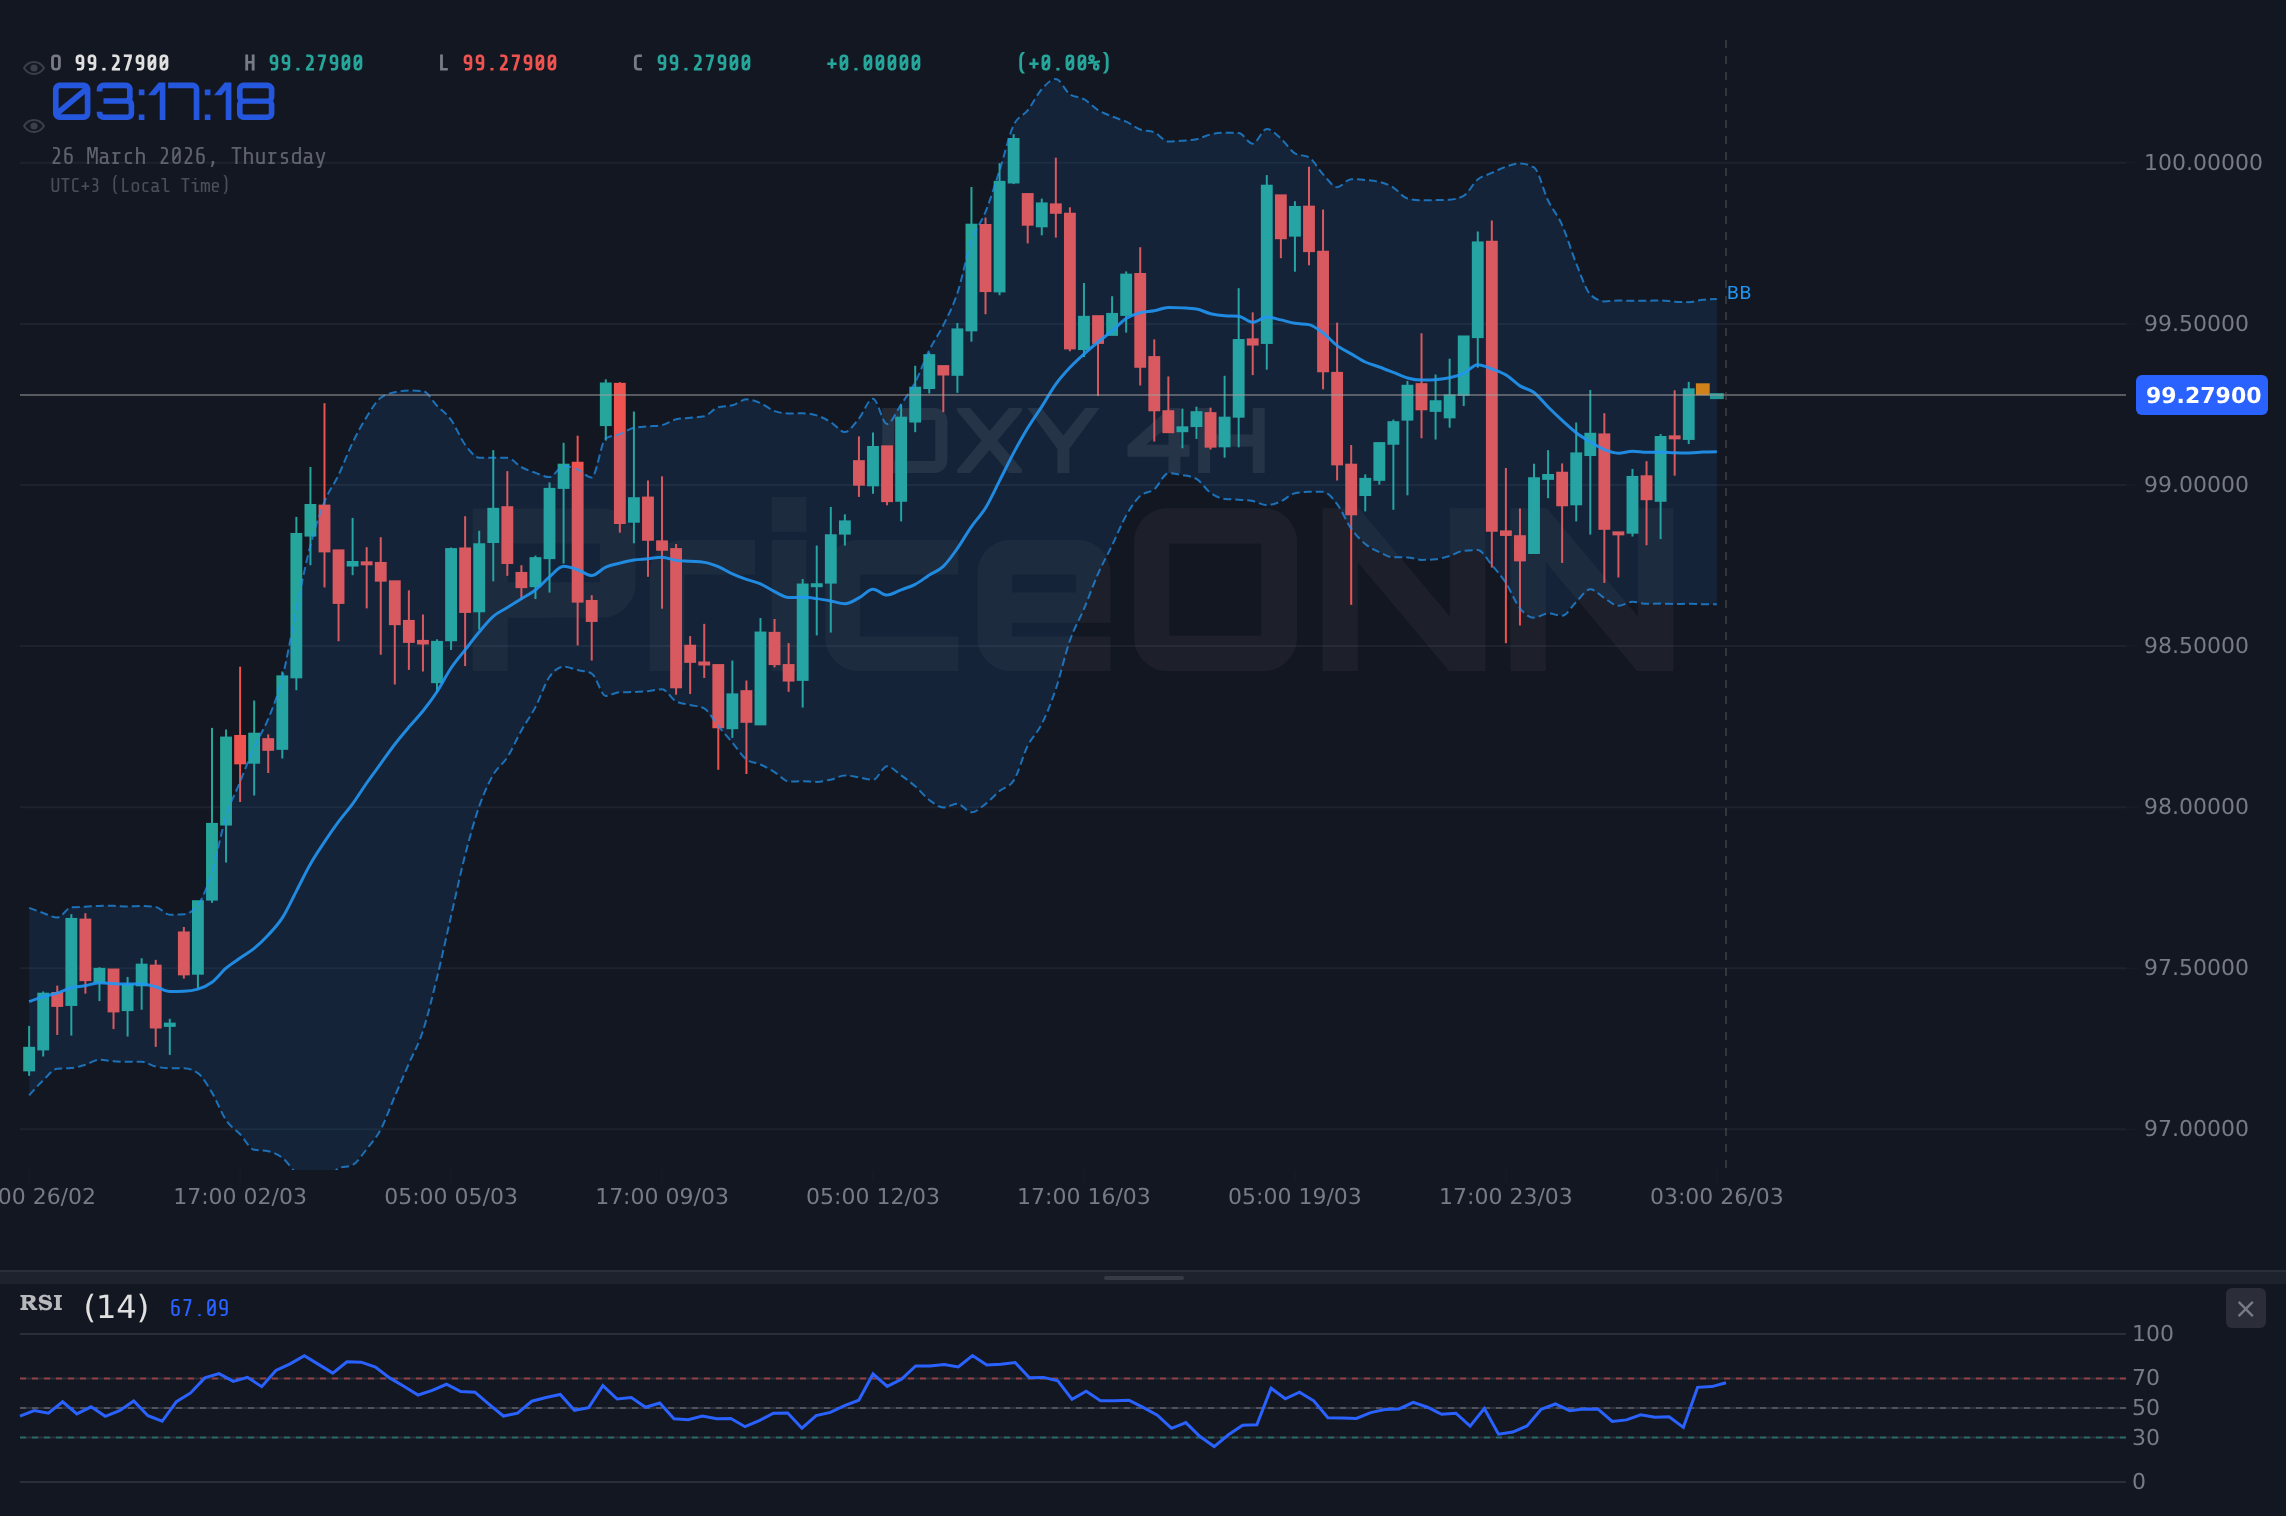
The 4-hour timeframe offers a slightly different perspective. Here, the trend is neutral with 50% power, and the ADX at 12.22 reinforces the idea of a lack of strong directional conviction. The RSI at 56.6 is also in neutral territory, trending upwards, which aligns with the short-term bullish bias. However, the Stochastic on this timeframe shows a bullish crossover (%K=83.53, %D=57.22) within the overbought zone, suggesting further upside might be limited or that a pullback could be imminent. The MACD on both the 1H and 4H charts shows positive momentum, but the overall picture is one of caution. The market appears to be digesting recent gains, with buyers hesitant to push aggressively above the current resistance.
The Daily Picture: Underlying Strength or Exhaustion?
When we zoom out to the daily chart, the DXY's trend is classified as bullish with 91% power, which provides a more constructive backdrop for the dollar. The daily RSI at 57.7 is comfortably in neutral territory, pointing upwards and suggesting there's still room for appreciation before hitting overbought conditions. This contrasts with the short-term Stochastic, which is showing a bearish signal (%K=34.97, %D=51.49) as the %K line crosses below the %D line. The ADX on the daily chart at 32.08 indicates a strong trend, but the conflicting Stochastic signal warrants attention. The MACD on the daily chart is currently showing negative momentum, with the MACD line below the signal line, which could be a precursor to a trend reversal or simply a consolidation phase. This mixed bag of signals across different timeframes underscores the importance of upcoming economic data to provide a clearer directional cue.
The current price of $99.41 for the DXY is significant not just because it's a round number, but because it sits within a cluster of resistance levels identified on the 1H, 4H, and 1D charts. Specifically, the 1H resistance is at $99.35, the 4H resistance is at $99.42, and the 1D resistance is at $99.55. This confluence around the $99.40-$99.55 area presents a formidable barrier. For the dollar to continue its ascent, a decisive break and hold above $99.55 would be necessary. Conversely, failure to push higher from current levels could see the DXY retreat towards its immediate support levels, which on the 1H chart are found at $99.23, $99.21, and $99.18. The 4H chart shows support at $99.02, $98.89, and $98.75, while the daily chart points to support at $98.61, $98.35, and $98.01. The proximity of the current price to these resistance zones amplifies the significance of the upcoming economic data.
Bullish Scenario: Dollar Strength Continues
45% ProbabilityNeutral Scenario: Consolidation Near Resistance
50% ProbabilityBearish Scenario: Dollar Retreats from Resistance
5% ProbabilityThe economic calendar is packed with events that could sway the DXY's trajectory, with the Purchasing Managers' Index (PMI) data for the US taking center stage. The latest figures show a slight uptick in the ISM Manufacturing PMI to 52.4, exceeding the forecast of 51.5. This reading, while positive, needs to be viewed in the context of broader economic trends. A PMI above 50 generally indicates expansion in the manufacturing sector, which is dollar-positive. However, the previous reading was 51.6, so this increase, while welcome, might not be a dramatic acceleration. The ISM Services PMI is also on the radar, with a previous figure of 51.7 and a forecast of 52. This data will be crucial for gauging the health of the larger services sector, which is a more significant driver of the US economy. Any significant deviation from expectations, either positive or negative, could provide the catalyst needed for the DXY to break out of its current range or confirm a move lower.
Beyond the PMIs, other factors are subtly influencing the dollar's environment. Geopolitical tensions, while perhaps less acute at this very moment, remain a background hum that can quickly amplify risk-off sentiment, benefiting the dollar as a safe-haven asset. However, the current market pricing doesn't seem to be heavily factoring in extreme geopolitical risk premiums, suggesting that the focus remains squarely on economic fundamentals and central bank policy. The Federal Reserve's stance on inflation and interest rates continues to be a dominant narrative. While recent data has shown some stickiness in inflation, the market is still pricing in potential rate cuts later in the year. Any hawkish signals from Fed officials or stronger-than-expected inflation data could bolster the dollar, while dovish commentary or signs of cooling inflation might weigh on it. The interplay between these macro forces and the immediate technical picture at $99.41 is what makes this current DXY setup so compelling.
The correlation with other markets is also worth noting. A strengthening DXY typically puts pressure on commodities like gold (XAUUSD) and silver (XAGUSD), as well as riskier currencies. Indeed, we see gold currently trading at $4,528.97, showing a daily increase of 1.23%, which might seem counterintuitive to a rising dollar. However, gold's own drivers, such as inflation hedging and safe-haven demand during geopolitical uncertainty, can sometimes override the dollar's influence. Meanwhile, major currency pairs like EURUSD are trading at 1.15632, showing a daily decline of 0.39%, and GBPUSD at 1.33643, down 0.35%, both reflecting the dollar's strength. Even AUDUSD at 0.69439 and NZDUSD at 0.58061 are showing losses, consistent with a stronger dollar environment. This broad-based weakness in other currencies against the DXY reinforces the dollar's current upward momentum, even if it's facing resistance.
For traders looking to navigate this complex environment, patience and discipline are paramount. The weak ADX on the hourly and 4-hour charts suggests that chasing strong directional moves right now could be perilous. The market is exhibiting characteristics of a 'choppy' or range-bound environment, where quick reversals can occur. This means that while the overall daily trend is bullish, short-term traders might find more opportunities in playing the ranges, or waiting for a clear breakout confirmation. Scalpers might look for short-term opportunities within the $99.02-$99.55 range, while swing traders will likely wait for a decisive move above $99.55 or a clear break below $99.02 to establish larger positions. The conflicting signals from indicators like RSI and Stochastic across different timeframes further emphasize the need for confirmation before committing significant capital.
The recent news flow also adds context. Reports of silver surging past $73 as industrial demand rises and the dollar weakens offer a glimpse into how different asset classes are reacting to the broader economic picture. While the dollar is showing strength against major currencies, its relationship with commodities can be more nuanced, influenced by specific supply-demand dynamics and inflation expectations. The mention of easing US-Iran tensions, which could potentially impact oil prices and risk sentiment, also plays into the complex web of factors affecting the DXY. Although this specific news might not directly move the DXY in the short term, such geopolitical developments contribute to the overall risk appetite that underpins currency valuations.
Considering the DXY's position near resistance at $99.41, the upcoming PMI data will be absolutely critical. If the data comes in significantly stronger than expected, it could provide the impetus for a breakout above $99.55, potentially targeting $99.81 and the psychological $100 level. On the other hand, weaker-than-expected PMIs, or a confluence of dovish signals from Fed officials, could lead to a retreat. In such a scenario, the $99.02-$99.23 area would become a key zone to watch for potential support. The current ADX readings across timeframes suggest that until a clearer trend emerges, volatility might increase within a defined range, making precise entry and exit points crucial for managing risk.
Frequently Asked Questions: DXY Analysis
What happens if DXY breaks above the $99.55 resistance level?
A sustained break above $99.55, confirmed by a daily close, would invalidate the current consolidation pattern and likely trigger a move towards the next resistance at $99.81. This scenario would suggest strong bullish momentum, potentially supported by robust economic data or hawkish Fed commentary, and could open the door for a test of the $100 psychological level.
Should I trade DXY at current levels of $99.41 given the mixed technical signals?
Trading at current levels of $99.41 presents a high-risk, low-reward scenario due to the proximity to resistance and conflicting indicators like the 1H Stochastic in overbought territory versus the daily RSI at 57.7. It's advisable to wait for clearer confirmation: either a breakout above $99.55 or a confirmed rejection and move back towards $99.02 support, which offers a better risk-reward profile.
Is the daily RSI at 57.7 a bullish signal for DXY right now?
The daily RSI at 57.7 is indeed pointing upwards, indicating positive momentum and suggesting room for further appreciation before reaching overbought territory. However, it's not a standalone buy signal. It needs to be considered alongside other indicators; for instance, the 1H Stochastic is already overbought, and the weak ADX suggests a lack of strong conviction, meaning the bullish implication of the RSI should be treated with caution.
How will the upcoming US PMI data affect DXY this week?
The upcoming US PMI data, particularly the ISM Manufacturing and Services figures, will be critical catalysts. Stronger-than-expected results (e.g., Manufacturing PMI above 52.4) could fuel a DXY breakout above $99.55, while weaker readings might lead to a pullback towards $99.02. Traders will be looking for signs of economic acceleration or deceleration to gauge the Federal Reserve's likely policy path.
Ultimately, the DXY's path forward hinges on its ability to overcome the immediate resistance around $99.41-$99.55. The technical indicators present a mixed picture, with daily strength tempered by short-term overbought conditions and weak trend strength readings. The upcoming PMI data will be the key determinant, offering a fresh perspective on economic health that could either propel the dollar higher or signal a much-needed correction. For now, patience is the best strategy. Waiting for confirmation of a clear directional move, either a decisive breakout or a confirmed rejection, will be crucial for navigating these choppy waters and identifying the most opportune trades. The market always provides second chances; the key is to wait for your setup and manage risk effectively.
Technical Outlook Summary
| Indicator | Value | Signal | Interpretation |
|---|---|---|---|
| RSI (14) | 57.7 | Neutral | Upward momentum, not overbought. |
| MACD Histogram | -0.23 | Bearish | Negative momentum, potential trend weakening. |
| Stochastic | 34.97 / 51.49 | Bearish | Bearish crossover in oversold territory. |
| ADX | 32.08 | Bullish Trend | Strong trend indicated. |
| Bollinger Bands | Middle Band | Watch | Price above middle band, indicating potential upside. |
Track markets in real-time
AI-powered analysis, technical indicators and real-time price data.
Join Our Telegram Channel
Breaking market news, AI analysis and trading signals instantly.
Join Channel