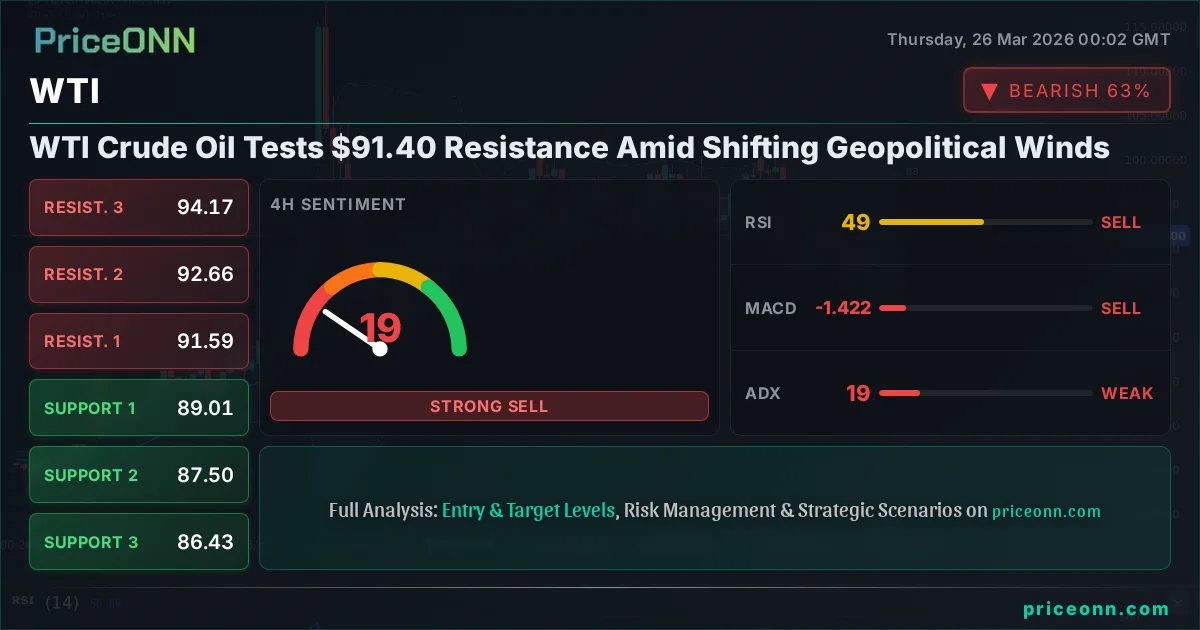
WTI Crude Oil Tests $91.40 Resistance Amid Shifting Geopolitical Winds
WTI Crude Oil is trading at $91.40, approaching key resistance levels as geopolitical tensions and market sentiment evolve. Analysis focuses on technical indicators and macro drivers.
The global energy landscape is in constant flux, and WTI Crude Oil is once again at a critical juncture, currently hovering around the $91.40 mark. This price point is not just a number; it represents a significant area of resistance that, if breached, could signal further upward momentum. However, the path to higher prices is fraught with technical indicators flashing caution and a complex geopolitical backdrop that demands careful navigation. As traders and analysts dissect the charts and global events, the question on everyone's mind is whether WTI has the fundamental and technical backing to overcome this hurdle or if the current rally is merely a precursor to a more significant pullback.
- WTI Crude Oil is currently testing resistance near $91.40, with the 1H ADX at 23.23 suggesting a medium-strength uptrend is attempting to solidify.
- Key resistance levels to watch are $91.43, $91.68, and $91.85, while immediate support is found at $91.01.
- The RSI on the 1-hour chart is at 58.91, indicating bullish momentum is building, but the Stochastic is entering overbought territory, signaling potential for a pullback.
- Geopolitical developments, particularly concerning US-Iran tensions and their impact on oil supply routes, remain a significant driver for WTI price action.
Navigating the Technical Landscape: WTI's Current Stance
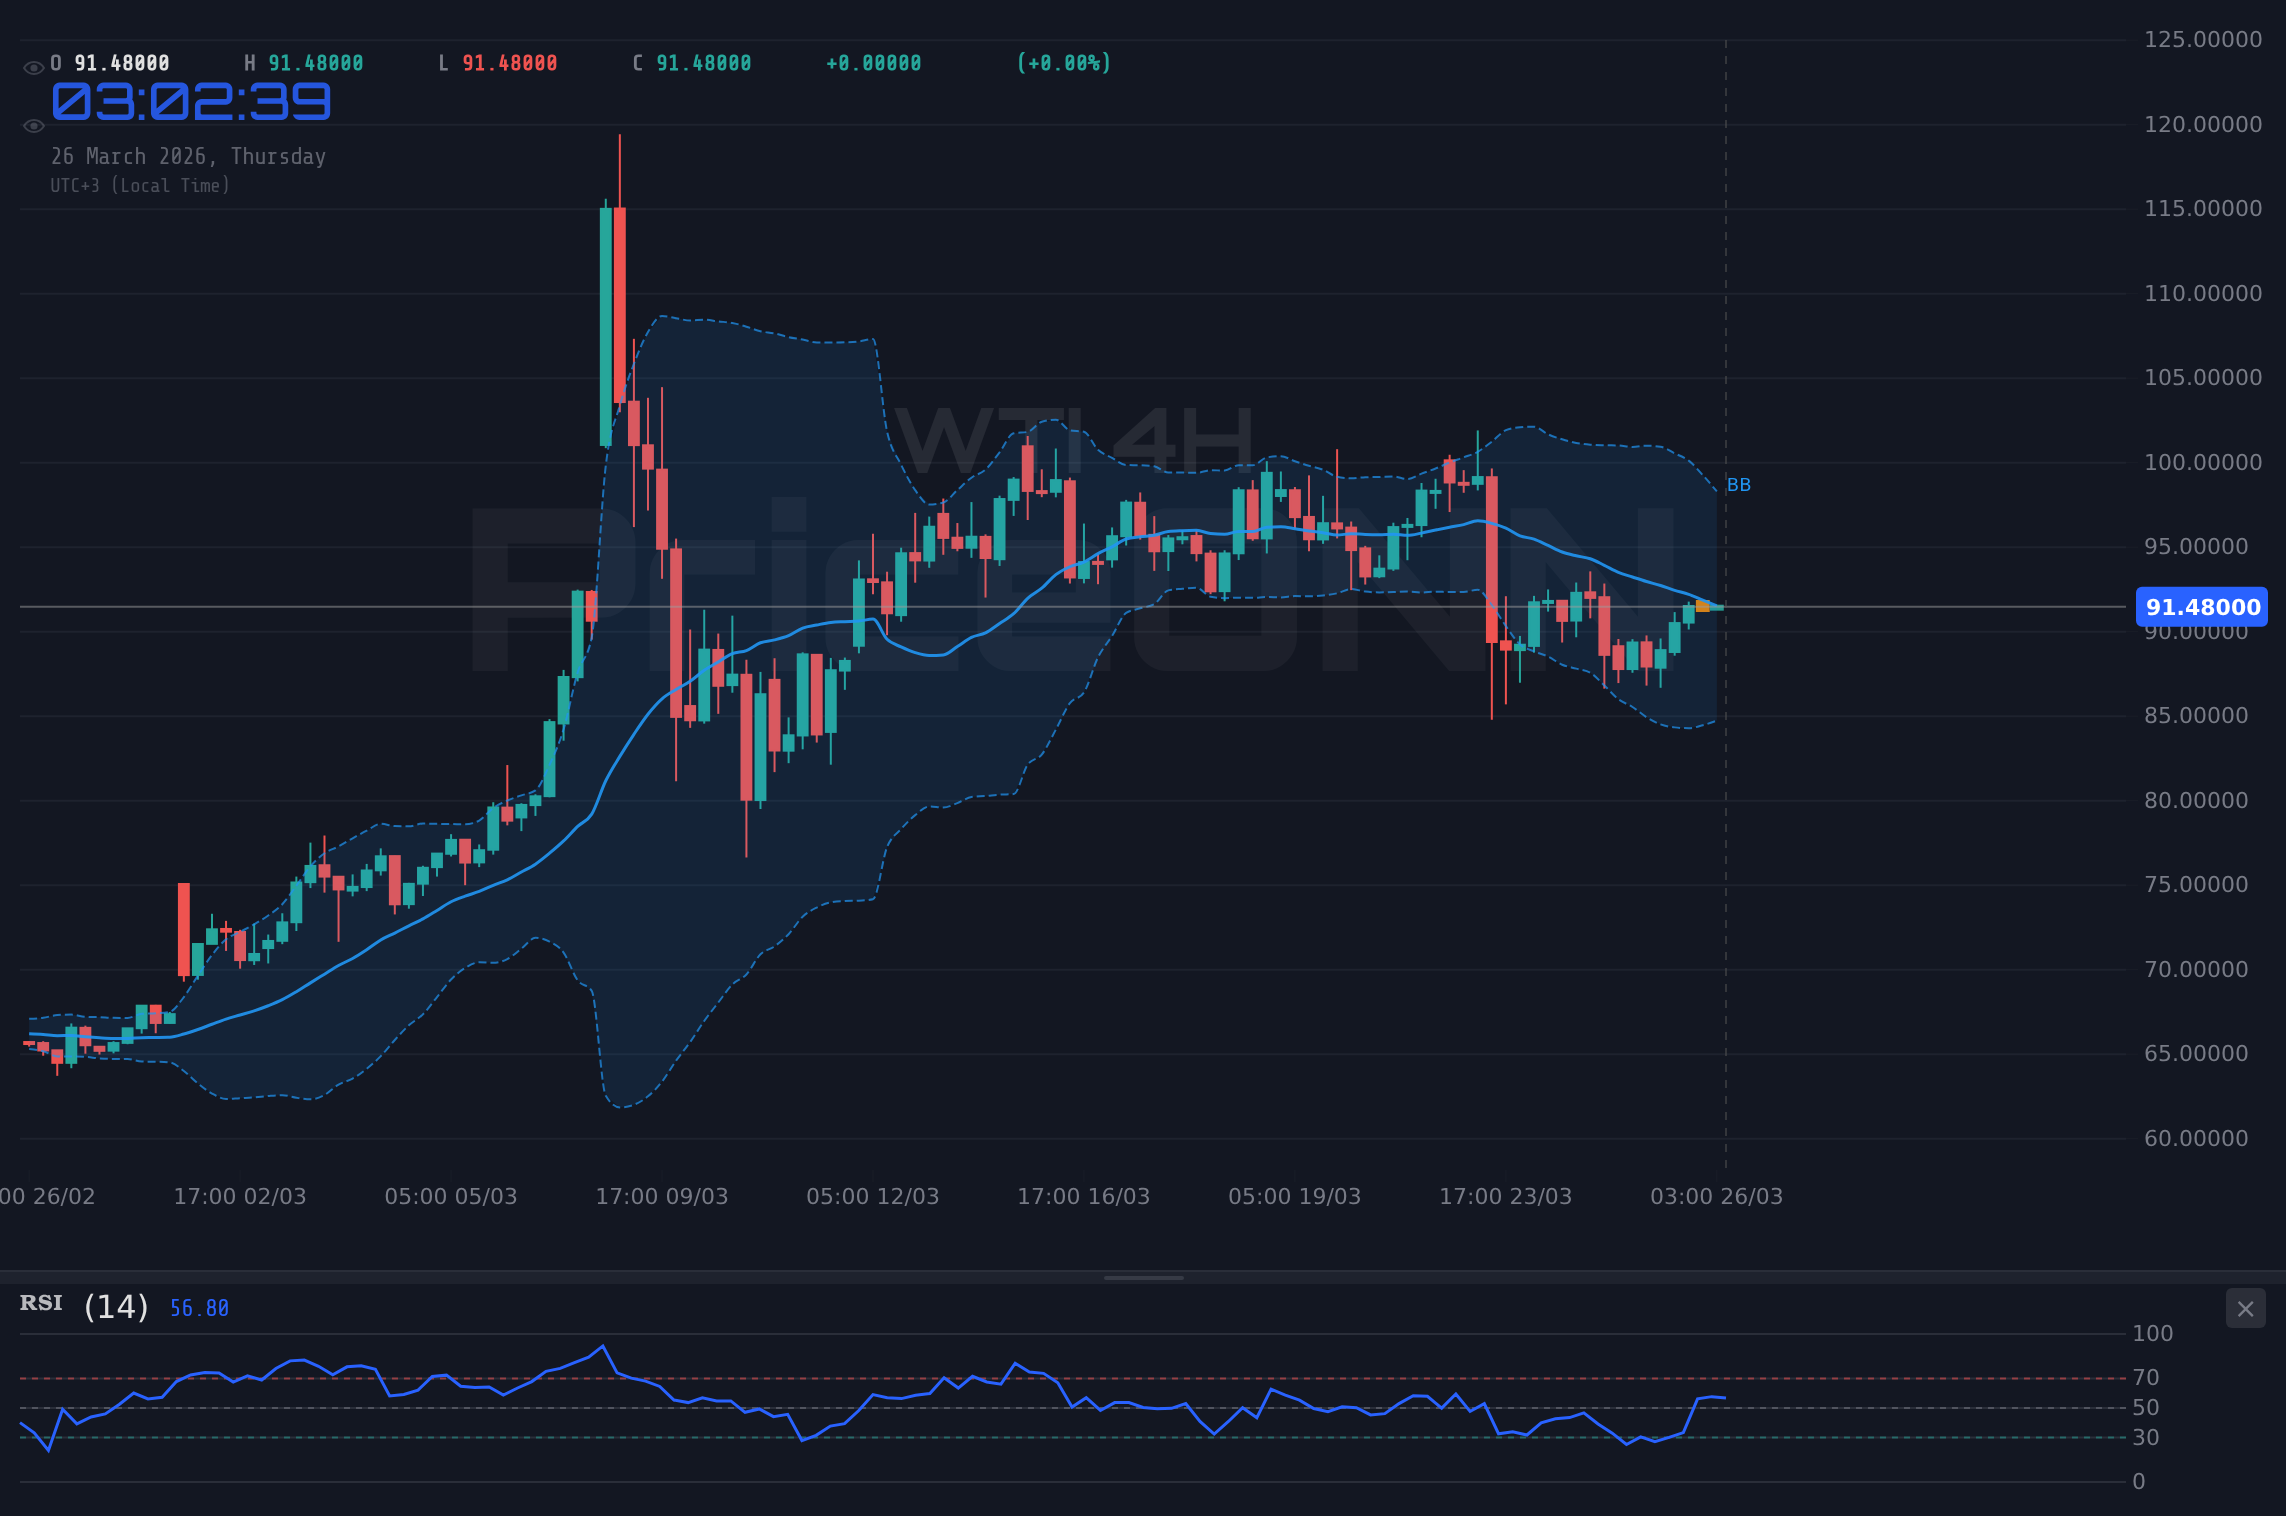
The 1-hour chart for WTI Crude Oil presents a mixed but cautiously optimistic technical picture as it approaches the $91.40 resistance level. The ADX reading of 23.23 on this timeframe indicates a moderately trending market, suggesting that the recent upward move has some underlying strength, but it's not yet a runaway trend. This means that while momentum is present, the market could still be susceptible to pullbacks or consolidation. The RSI, currently sitting at 58.91, supports the bullish sentiment, indicating that buyers are becoming more active and pushing prices higher. However, this is where the nuance of technical analysis comes into play; the Stochastic Oscillator is already flashing warnings, with the %K line at 89.28 and the %D line at 90.59, firmly in overbought territory. This divergence between the RSI's upward momentum and the Stochastic's overbought condition suggests that the immediate upside might be limited, and a period of consolidation or a minor correction could be on the cards before any potential breakout above $91.40.
On the 4-hour timeframe, the technical indicators offer a slightly different perspective, leaning towards caution. The ADX here is lower, at 19.19, reinforcing the idea that the trend is not yet strongly established across multiple timeframes. The RSI at 48.27 falls within the neutral zone, showing no strong bullish or bearish conviction. More notably, the MACD on this timeframe is currently below its signal line with negative momentum, which typically signals bearish pressure. The Bollinger Bands are also showing the price trading below the middle band, which often acts as a dynamic support or resistance. This suggests that while the 1-hour chart might be showing some short-term bullishness, the medium-term picture on the 4-hour chart is less convincing, and the market may be consolidating its recent gains rather than preparing for a significant upward surge. The Stochastic on this timeframe, however, shows %K at 52.5 and %D at 34.84, indicating a potential bullish crossover, adding another layer of complexity to the interpretation.
The daily chart provides the broader context, and here, the picture is decidedly bullish, with a strong trend indicated by an ADX of 57.34. This high ADX reading suggests that the market is in a strong trend, and the current upward move is part of a larger established trend. The RSI at 59.19, while not yet in overbought territory, is trending higher and indicates room for further upside potential. The MACD on the daily chart, however, is still showing negative momentum with the MACD line below the signal line. This is a key point of conflict: a strong trend on the daily chart (ADX) and rising RSI, but a lagging MACD. This could imply that the trend is mature, and while it might continue, the underlying momentum is not as strong as the ADX might suggest. The Bollinger Bands on the daily chart show price above the middle band, aligning with the bullish trend. The Stochastic on the daily is K=32.78, D=48.94, showing a potential bearish crossover, which contradicts the strong ADX and rising RSI. This confluence of conflicting signals across different timeframes highlights the current indecision and the importance of the $91.40 resistance level.
The $91.40 Threshold: A Battleground for Bulls and Bears
The $91.40 level is more than just a number; it's a psychological and technical battleground. On the 1-hour chart, the immediate resistance is at $91.43, followed by $91.68 and $91.85. A decisive break and hold above $91.43 would be the first signal that the bulls are gaining control, potentially triggering a move towards $91.68. However, the overbought Stochastic on this timeframe suggests that such a breakout might be difficult without a period of consolidation or a minor pullback first. Support on the 1-hour chart is seen at $91.01, $90.84, and $90.59. A failure to hold above $91.01 could quickly negate any bullish short-term sentiment and send prices lower, testing the $90.84 level.
Looking at the 4-hour chart, the resistance levels are slightly higher, with the first significant hurdle at $91.59, followed by $92.66 and $94.17. The conflicting signals from the MACD and Stochastic on this timeframe mean that a clear move above $91.59 would be needed to confirm sustained upside. The support levels on the 4-hour chart are more pronounced, starting at $89.01, then $87.50, and $86.43. A break below $89.01 would likely invalidate any immediate bullish bias and could signal a move back towards the lower end of the recent trading range.
The daily chart resistance levels are where the true battle lies: $92.59, $96.55, and $99.53. These are the levels that would indicate a significant shift in the longer-term trend. However, the conflicting daily indicators, particularly the lagging MACD and the Stochastic crossover, suggest that the market might be hesitant to commit to a strong directional move above these higher resistance points without further fundamental catalysts. Support on the daily chart at $85.65, $82.67, and $78.71 are crucial for maintaining the overall bullish trend identified by the ADX. A decisive close below $85.65 on the daily chart would be a significant warning sign for the bulls and could indicate the beginning of a trend reversal.
The Geopolitical Undercurrent: Supply Risks and Market Sentiment
The price action in WTI Crude Oil cannot be viewed in isolation; it is intrinsically linked to the complex web of global geopolitical events. The ongoing tensions in the Middle East, particularly concerning US-Iran relations, continue to be a significant factor supporting oil prices. Any escalation or de-escalation in this region can trigger sharp price movements. For instance, reports of increased naval activity or diplomatic tensions can immediately put upward pressure on oil as traders price in potential supply disruptions. Conversely, signs of easing tensions or successful diplomatic breakthroughs could lead to profit-taking and a downward correction. This volatility underscores the importance of closely monitoring news feeds for any developments that could impact crude oil supply routes, especially through the Strait of Hormuz, a critical chokepoint for global oil trade.
Beyond the immediate Middle East flashpoints, broader geopolitical risks also play a role. The ongoing conflict in Eastern Europe continues to cast a shadow over global energy markets, influencing supply dynamics and regional energy security concerns. While direct impacts on WTI might be less pronounced compared to European natural gas, the overarching uncertainty contributes to a general risk premium in oil prices. Furthermore, the relationship between major oil producers, particularly OPEC+ members, remains a critical factor. Decisions regarding production quotas, voluntary cuts, or increased output from key players like Saudi Arabia and Russia can significantly influence supply-demand balances and, consequently, WTI prices. The market is constantly trying to anticipate these policy shifts, leading to periods of speculation and price volatility.
Correlations with other major markets also provide valuable context. The US Dollar Index (DXY), currently trading around 99.42 and showing a strong upward trend on the daily chart, often has an inverse relationship with oil prices. A strengthening dollar typically makes oil more expensive for holders of other currencies, potentially dampening demand and putting downward pressure on prices. However, this relationship can sometimes break down, especially when oil prices are being driven by strong supply-side factors or geopolitical risk premiums, as is often the case. Currently, with the DXY showing strength, it presents a headwind for WTI bulls aiming for sustained rallies above $91.40. Similarly, the performance of equity indices like the S&P 500, currently showing a slight downtrend on the daily chart, can reflect broader market sentiment. A significant risk-off sentiment, marked by falling stock markets, can lead to decreased demand expectations for oil, while a bullish equity market often correlates with higher oil prices due to increased economic activity and risk appetite.
The Impact of Economic Data and Central Bank Policies
Economic data releases and central bank policies are the fundamental underpinnings that influence oil demand and, by extension, WTI prices. Recent economic indicators provide a mixed outlook. The US ISM Manufacturing PMI came in at 52.4, above the forecast of 51.5, suggesting some resilience in the manufacturing sector. However, the ISM Services PMI at 51.1 was below the forecast of 52, indicating a potential slowdown in the services sector, which is a larger component of the US economy. These figures paint a picture of an economy that is growing, but perhaps at a decelerating pace, which could temper oil demand growth expectations. A significant slowdown or a clear recessionary signal would likely put considerable downward pressure on WTI prices, regardless of geopolitical supply concerns.
Central bank policies, particularly those of the US Federal Reserve, play a crucial role in shaping the macroeconomic environment. While the provided data does not include specific Fed meeting minutes or interest rate announcements for the immediate future, the market's anticipation of future monetary policy is always a key driver. If the Fed maintains a hawkish stance, signaling continued vigilance against inflation and a potential for higher-for-longer interest rates, this could strengthen the dollar and potentially slow down economic growth, both of which are bearish for oil. Conversely, any hint of a pivot towards a more accommodative stance, perhaps driven by concerns over economic slowdown, could weaken the dollar and support oil prices. Traders closely watch employment data, such as Non-Farm Payrolls (NFP), and inflation figures like CPI, as these are key inputs for central bank decisions. For instance, a surprisingly strong NFP report of 211,000 (vs. 205,000 previous) could reinforce the Fed's hawkish stance, while softer inflation data might do the opposite.
The correlation between oil prices and inflation expectations is also paramount. Higher oil prices are often a contributing factor to inflation, and conversely, expectations of rising inflation can lead investors to seek commodities like oil as an inflation hedge. This creates a feedback loop where rising oil prices can contribute to inflation, which in turn can influence central bank policy, affecting economic growth and, ultimately, oil demand. The current environment, with inflation still a concern for policymakers, means that any significant upward move in WTI prices could attract increased scrutiny from central banks, potentially leading to policy responses that could curb oil demand in the medium to long term. The interplay between supply-side pressures, demand-side resilience, and monetary policy responses creates a dynamic environment for WTI traders to navigate.
The current price of WTI at $91.40 may be significantly influenced by a geopolitical risk premium. Any de-escalation in Middle East tensions or a resolution to the conflict in Eastern Europe could rapidly remove this premium, leading to a sharp price correction even if technical indicators suggest otherwise.
Scenario Analysis: Mapping Potential WTI Price Paths
Bearish Scenario: Consolidation Below Resistance
65% ProbabilityNeutral Scenario: Range-Bound Trading
25% ProbabilityBullish Scenario: Breakout Above Resistance
10% ProbabilityFAQ: Decoding WTI's Path Forward
Frequently Asked Questions: WTI Analysis
What happens if WTI fails to break above the $91.43 resistance level?
If WTI fails to decisively break above $91.43, especially with the Stochastic oscillator showing overbought conditions on the 1-hour chart, we could see a move back towards support. The immediate downside target would be $91.01, with a further test of $90.84 if selling pressure intensifies.
Should I consider buying WTI at current levels around $91.40 given the bullish 1H RSI?
Buying directly at resistance levels is generally risky. While the 1-hour RSI at 58.91 is bullish, the overbought Stochastic and the weaker signals on the 4-hour chart suggest caution. A more prudent approach might be to wait for a confirmed breakout above $91.85 or a pullback to a stronger support level like $90.59, offering a better risk-reward ratio.
Is the ADX at 57.34 on the daily chart a sign of a strong bullish trend for WTI?
An ADX reading of 57.34 on the daily chart indeed signifies a very strong trend. However, it's crucial to note that the MACD is still showing negative momentum and the Stochastic is showing a potential bearish crossover. This suggests the strong trend might be maturing, and while it could continue, the underlying momentum is not as robust as the ADX alone implies, warranting close attention to shorter-term conflicting signals.
How might evolving US-Iran tensions affect WTI prices this week?
Any escalation in US-Iran tensions could quickly add a geopolitical risk premium to WTI prices, potentially pushing them above $91.40 and towards higher resistance levels like $92.59. Conversely, signs of de-escalation could trigger profit-taking, leading to a test of immediate support around $91.01.
Technical Outlook Summary
| Indicator | Value | Signal | Interpretation |
|---|---|---|---|
| RSI (14) | 58.91 | Neutral | Trending higher, but room to overbought |
| MACD Histogram | -0.12 | Bearish | Negative momentum on 1H, mixed on 4H/1D |
| Stochastic | K:89.28, D:90.59 | Bearish | Overbought on 1H, potential pullback signal |
| ADX | 23.23 | Neutral | Medium trend strength on 1H, weaker on 4H |
| Bollinger Bands | Price above Middle Band | Bullish | Suggests upward momentum on 1H, mixed on 4H/1D |
The current technical setup for WTI Crude Oil at $91.40 presents a classic case of conflicting signals across different timeframes. While the 1-hour chart shows building bullish momentum with a rising RSI and price above the middle Bollinger Band, the overbought Stochastic and negative MACD momentum on shorter timeframes suggest that immediate upside may be capped. The daily chart confirms a strong underlying trend with a high ADX, but the lagging MACD and Stochastic crossovers introduce a note of caution. Geopolitical risks continue to provide a fundamental floor, but the strengthening US Dollar and mixed economic data present headwinds. Traders must remain vigilant, watching the $91.43 resistance for a potential breakout confirmation or the $91.01 support for signs of further downside. Patience will be rewarded as the market digests these competing forces.
Track markets in real-time
AI-powered analysis, technical indicators and real-time price data.
Join Our Telegram Channel
Breaking market news, AI analysis and trading signals instantly.
Join Channel