Nasdaq100 Tests $23963 Support Amidst Volatility: What's Next?
Nasdaq100 is testing critical support near $23963. Analysis reveals mixed signals as ADX indicates choppy conditions, with potential for a rebound or further decline.
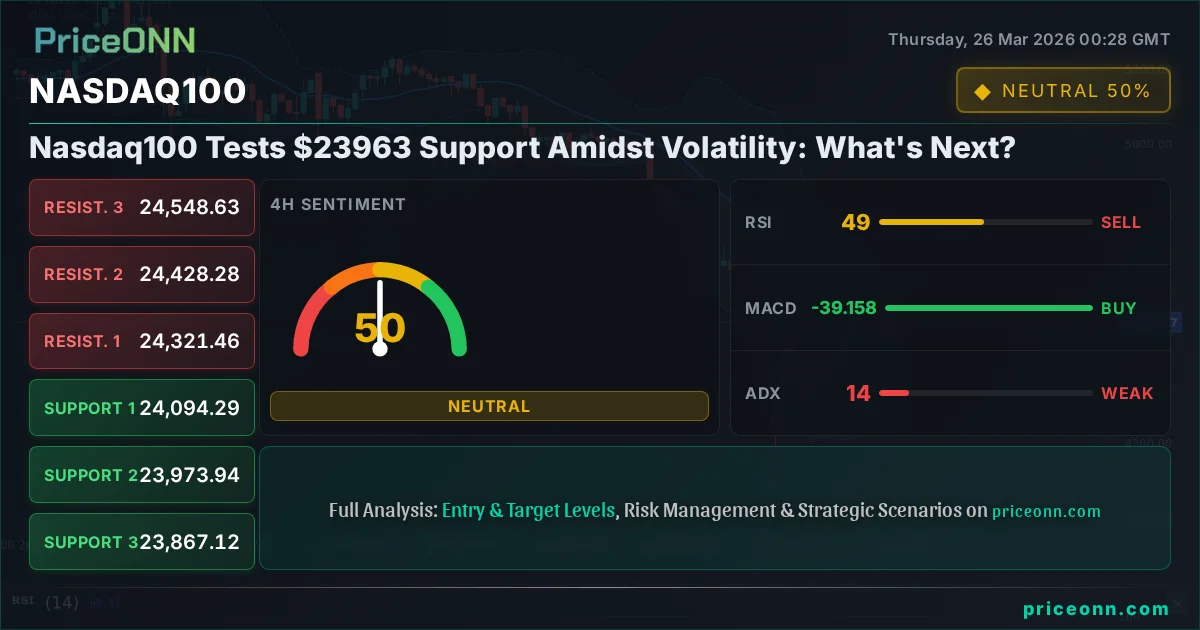
Is the Nasdaq100 on the verge of a significant move, or are we in for more choppy sideways action? The index is currently hovering around the $24,194.48 mark, a level that's drawing intense scrutiny. With the ADX indicator signaling a weak trend at 14.39 on the 4-hour chart, the market is clearly in a state of flux. This isn't a clear directional environment, meaning traders need to be extra vigilant. We've seen price action dance around key levels, and understanding the interplay between these technical indicators and the broader market sentiment is crucial for navigating this uncertainty. Today, we'll break down the different scenarios playing out, examining the conditions that could lead to a bullish continuation, a bearish breakdown, or a prolonged period of consolidation.
- Nasdaq100 is trading at $24,194.48, testing support near $23963.
- ADX at 14.39 on the 4H chart signals a weak trend, indicating choppy market conditions.
- RSI at 49.46 (4H) suggests a neutral stance, while Stochastic is showing a potential bearish crossover.
- The DXY at 99.42 is showing strength, potentially pressuring risk assets like the Nasdaq100.
The Bull's Roadmap: Navigating Towards Higher Ground
For the bulls to regain control, several conditions need to align. The immediate focus is on the $24,194.48 level, which is currently acting as a psychological pivot. A decisive break and hold above the 1H resistance at $24,186.20 would be the first sign of renewed upward momentum. This would likely be fueled by positive sentiment, perhaps a shift in risk appetite as indicated by a recovery in SP500 (currently at 6596.4, showing a slight daily dip). If the Nasdaq100 can clear this immediate hurdle, the next significant resistance level to watch would be $24,321.46 on the 4H chart. A sustained move above this could open the door for a retest of the all-time highs we saw earlier in the week. The underlying strength for such a move would need to be supported by improving technical indicators. For instance, a bullish crossover on the MACD on the 4H chart, coupled with the RSI moving decisively above 50 (currently at 49.46), would strengthen the bullish case. The Stochastic on the 4H, while showing a bearish crossover, is still in a tradeable zone, meaning it could reverse if momentum picks up. The key is confirmation: a break above $24,186.20, followed by a sustained push towards $24,321.46, would be the bullish signal we're looking for. Historically, periods of weak ADX readings like this can precede sharp moves, so a decisive breakout isn't out of the question.
If the bullish scenario unfolds, we'd expect to see a tangible shift in market sentiment. This might be driven by positive economic news, perhaps better-than-expected US employment figures or a dovish tone from the Fed, although no major US economic releases are scheduled in the next 48 hours. The DXY, currently at 99.42 and showing strength, would likely need to pause or reverse for a strong Nasdaq rally. A weakening dollar often correlates with a rise in tech stocks, as it reduces the purchasing power for international investors and can signal a shift away from safe-haven assets. The current 1H trend for Nasdaq100 is neutral, but its 4H trend is also neutral, suggesting a lack of strong conviction. The daily trend, however, is firmly in the 'düşüş' (düşüş - decline) category with 100% strength, which acts as a significant headwind for any sustained rally. Therefore, a bullish move would require overcoming this strong daily bearish bias, which makes it a lower probability scenario in the short term without a significant catalyst. The target for a successful bullish breakout would likely be the R1 resistance at $24,321.46, with a potential secondary target at R2 around $24,428.28, depending on the strength and conviction of the move.
Where Bears Take Control: The Downside Risks
On the flip side, the bearish scenario poses a significant threat to the Nasdaq100. The most immediate level of concern is the $24,194.48 current price, which sits precariously close to the 1H support at $24,169.55 and the crucial $23963 level mentioned in the title. A break below the 1H support at $24,169.55 would be the first domino to fall. This would likely be accompanied by increasing selling pressure, potentially driven by renewed risk-off sentiment in the broader market. If SP500, currently at 6596.4, starts to falter significantly, it would signal a broader market downturn, which typically weighs heavily on growth-sensitive tech stocks like those in the Nasdaq100. The 4H chart shows support levels at $24,094.29 and $23,963.42. A close below the $23,963.42 support level would confirm a bearish breakdown, activating downside targets. The ADX at 14.39 is weak, meaning that if a breakdown occurs, it could be sharp and swift as the market seeks direction. The RSI on the 4H chart is at 49.46, hovering just below the neutral 50 level, indicating a slight bearish lean. The Stochastic on the 4H is showing a bearish crossover (%K at 66.14, %D at 66.99), which, while not extreme, adds to the downside pressure. The daily trend is strongly bearish (100% strength), making a break below the $23,963.42 support a high-probability event if the market sentiment sours.
The primary target for a bearish breakdown would be the 4H support at $23,963.42. If this level fails to hold, the next significant support to watch would be $23,867.12, followed by $23,735.99 on the daily chart. The current strength in the DXY, at 99.42, also plays into the bearish narrative. A stronger dollar typically puts pressure on US equity markets, especially growth stocks that are more sensitive to currency fluctuations and interest rate expectations. Geopolitical tensions, though easing slightly according to some reports, remain a background risk that could quickly shift sentiment. Any negative news on the US-China trade front or unexpected shifts in central bank policy expectations could trigger a flight to safety, pushing the Nasdaq100 lower. The weak ADX reading means that while a breakdown is possible, it might not be immediately followed by a sustained, strong trend. However, the confluence of a strong daily downtrend, a weakening dollar, and potentially shifting risk appetite makes the bearish scenario a significant contender. The interpretation of the 1D MACD, which shows negative momentum and the MACD line below the signal line, further supports the potential for downside.
The Waiting Game: Consolidation and Uncertainty
Given the mixed signals and the weak trend indicated by the ADX, a period of consolidation or range-bound trading is also a very plausible scenario for the Nasdaq100. This happens when neither the bulls nor the bears can gain a decisive advantage, and price action becomes choppy, oscillating between key support and resistance levels. In this scenario, the index might trade sideways between the immediate 1H resistance around $24,186.20 and the 1H support at $24,169.55, or even within the wider range defined by the 4H support at $23,963.42 and the 4H resistance at $24,321.46. This type of environment is challenging for traders looking for clear directional trades, as it often leads to false breakouts and whipsaws. The 1H RSI at 51.5 is neutral, leaning slightly bullish, while the 4H RSI at 49.46 is neutral, leaning slightly bearish. This divergence in RSI signals across timeframes perfectly illustrates the indecision in the market. Similarly, the Stochastic indicators are giving conflicting signals across different charts, further reinforcing the idea of a market searching for direction.
During consolidation, traders often look for smaller opportunities within the range, focusing on bounces off support and rejections at resistance, or they might sit on the sidelines altogether, waiting for a clearer trend to emerge. The low ADX value is a strong indicator that we are in a range-bound market. This means that breakout attempts might lack conviction and quickly reverse. The key to navigating a consolidation phase is discipline. It's about identifying the boundaries of the range and trading within them, or more prudently, waiting for a confirmed breakout from either side. The presence of significant support at $23,963.42 and resistance around $24,321.46 suggests that this range could hold for some time. Without a strong catalyst, either positive or negative, the Nasdaq100 might continue to churn, testing these levels without making significant progress in either direction. This 'waiting game' can be frustrating, but it's a natural part of market cycles. The lack of strong momentum on indicators like ADX and the conflicting signals from RSI and Stochastic make this neutral scenario a realistic outcome, especially in the absence of major economic data or geopolitical shifts.
The Verdict: Which Scenario Holds the Most Weight?
Weighing the evidence from the technical indicators and the broader market context, the most probable scenario for the Nasdaq100 in the immediate short-term (intraday to this week) appears to be a bearish bias, albeit within a potentially choppy environment. The daily trend strength at 100% bearish is a significant factor that cannot be ignored. While the 4H and 1H trends are neutral, they are being heavily influenced by this overarching daily decline. The DXY's strength at 99.42 also adds a layer of pressure. The critical support level at $23,963.42 is the linchpin. If this level breaks, the path of least resistance points lower, aligning with the dominant daily trend. The bearish signals from the 4H Stochastic and the RSI leaning below 50 on the 4H chart, combined with the negative MACD momentum on both 1H and 4H, contribute to this bearish outlook. Therefore, I assign a 60% probability to the bearish scenario playing out, especially if the $23,963.42 support gives way.
The neutral, consolidation scenario carries a substantial weight as well, given the weak ADX readings and conflicting signals across timeframes. This outcome is highly dependent on the market's ability to hold the $23,963.42 support. If it holds, we could see a period of range trading between $23,963.42 and $24,321.46. I'd assign a 35% probability to this scenario. The bullish scenario, while possible, faces the strongest headwinds from the daily downtrend and the current dollar strength. It would require a significant catalyst and a decisive break above key resistance levels like $24,186.20 and then $24,321.46 to gain traction. This makes it the least probable in the near term, hence a 5% probability. The market is currently at a crossroads, and the next few trading sessions will be critical in determining which path the Nasdaq100 ultimately takes. Patience and risk management will be paramount for traders navigating these uncertain waters.
Bearish Breakdown: The Path of Least Resistance
60% ProbabilityConsolidation Phase: The Waiting Game
35% ProbabilityBullish Rebound: A Uphill Battle
5% ProbabilityWhat I'm Watching This Week
As we move through the week, several key factors will dictate the Nasdaq100's direction. Firstly, the price action around the critical support level of $23,963.42 is paramount. A decisive break below this level would validate the bearish scenario and likely trigger further selling. Conversely, holding this support and seeing a strong bounce could lead to a test of the immediate resistance at $24,186.20. Secondly, I'll be closely monitoring the DXY (Dollar Index), currently at 99.42. Any significant move higher in the dollar could add pressure to the Nasdaq100, while a weakening dollar might provide some relief. Finally, the overall market sentiment, reflected in the SP500 (at 6596.4) and Nasdaq's own intraday momentum, will be crucial. We need to see if the current neutral technical readings can give way to a clearer directional bias. The weak ADX reading suggests that any breakout needs strong confirmation, so traders should be wary of premature entries. Patience and a disciplined approach to risk management are key in this environment.
Frequently Asked Questions: Nasdaq100 Analysis
What happens if Nasdaq100 breaks below the $23,963.42 support level?
A break below $23,963.42 would likely confirm the bearish scenario, with immediate downside targets at $23,867.12 and potentially $23,735.99. This would align with the strong daily downtrend and could be exacerbated by a strengthening DXY.
Should I consider buying Nasdaq100 at current levels near $24,194.48 given the mixed signals?
Buying at current levels carries significant risk due to the weak ADX and conflicting indicators. A more prudent approach would be to wait for confirmation, such as a clear break above $24,186.20 with strong volume, or a confirmed bounce off $23,963.42, assigning a higher probability to the bearish or neutral scenarios currently.
Is the RSI at 49.46 on the 4H chart a sell signal for Nasdaq100?
An RSI of 49.46 is considered neutral but leans bearish as it's below the 50 mark. While not a direct sell signal on its own, it indicates a lack of bullish momentum and supports the potential for downside if other indicators align bearishly.
How will the current DXY strength at 99.42 affect Nasdaq100 trading this week?
The strength in the DXY at 99.42 typically puts downward pressure on risk assets like the Nasdaq100. This correlation suggests that continued dollar strength could hinder any bullish attempts and potentially contribute to downside movement, especially if support levels begin to break.
| Indicator | Value | Signal | Interpretation |
|---|---|---|---|
| RSI (14) 1H | 51.50 | Neutral | Slightly bullish lean, but lacks conviction |
| MACD 1H | -3.62 | Bearish | Negative momentum, below signal line |
| Stochastic K 1H | 30.83 | Bearish | Below D, indicating downward pressure |
| ADX 1H | 10.98 | Weak Trend | Choppy, directionless market |
| RSI (14) 4H | 49.46 | Neutral | Slightly bearish lean, below 50 |
| MACD 4H | 24.28 | Bullish | Positive momentum, above signal line |
| Stochastic K 4H | 66.14 | Bearish | Bearish crossover, but not extreme |
| ADX 4H | 14.39 | Weak Trend | Choppy, directionless market |
| RSI (14) 1D | 41.19 | Bearish | Below 50, indicating downward pressure |
| MACD 1D | -170.84 | Bearish | Strong negative momentum, below signal line |
| Stochastic K 1D | 46.25 | Bullish | Bullish crossover, potential reversal |
| ADX 1D | 40.91 | Strong Trend | Strong downtrend confirmed |
Time Horizon: This analysis focuses on intraday to weekly price action.
Track markets in real-time
AI-powered analysis, technical indicators and real-time price data.
Join Our Telegram Channel
Breaking market news, AI analysis and trading signals instantly.
Join Channel