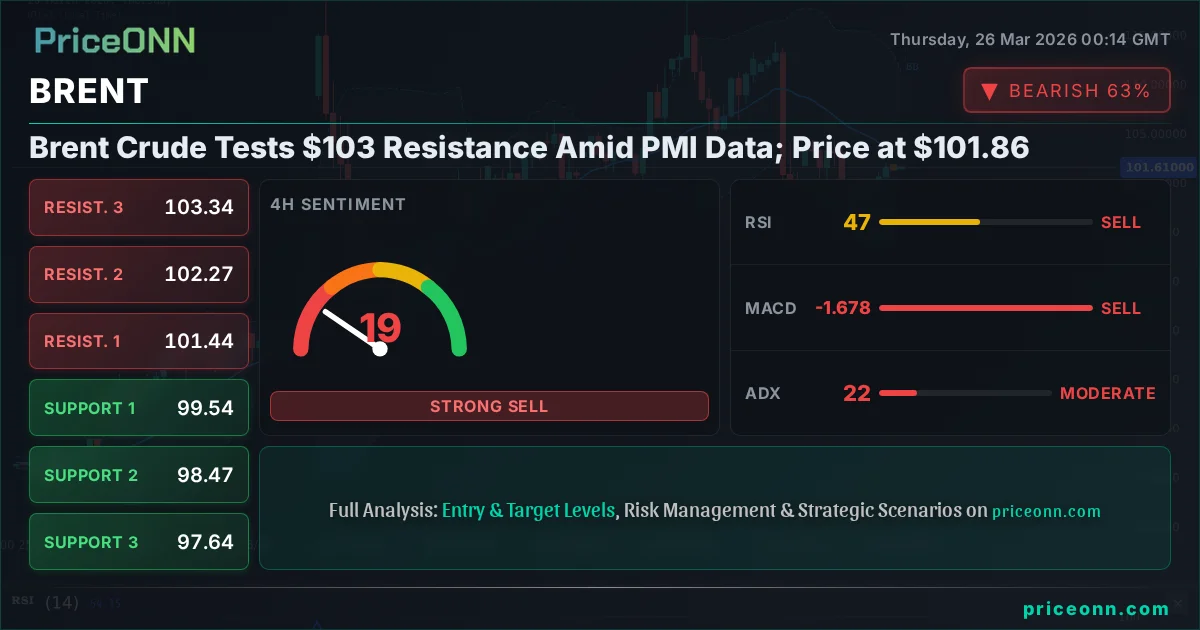
Brent Crude Tests $103 Resistance Amid PMI Data; Price at $101.86
Brent Crude is trading at $101.86, nearing the $103 resistance level. PMI data and geopolitical tensions are key drivers.
The global oil market is at a critical juncture as Brent Crude hovers just below the $103 mark, currently priced at $101.86. This pivotal moment comes amidst a complex interplay of geopolitical tensions, shifting economic indicators, and crucial technical levels. Traders are closely watching to see if the current upward momentum can overcome the significant resistance, or if profit-taking will lead to a pullback. The recent surge in Brent prices, up 2.41% to $101.86 today, reflects a market grappling with supply concerns and a potential uptick in global demand, all while navigating the delicate balance of risk appetite indicated by broader market indices.
- Brent Crude is trading at $101.86, approaching a key resistance at $103.
- The ADX at 22.22 suggests a moderate trend, while RSI at 55.98 indicates upward momentum is building but not yet overextended.
- Geopolitical events in the Middle East and supply chain disruptions are key drivers influencing Brent's price action.
- The correlation with DXY (currently at 99.41) remains a factor, with a strong dollar typically exerting downward pressure on oil prices.
The recent price action in Brent Crude, currently standing at $101.86, paints a picture of cautious optimism coupled with significant underlying risk. The 2.41% daily gain, bringing the price to $101.86, highlights a renewed bullish sentiment, likely fueled by a combination of factors including ongoing geopolitical instability in key oil-producing regions and a perceived increase in global industrial activity. However, the proximity to the $103 resistance level presents a formidable hurdle. This level is not just a psychological barrier; it represents a significant technical point where selling pressure has historically emerged, potentially halting or reversing upward trends. The market's ability to decisively break and hold above this level will be crucial in determining the next phase of price discovery for the benchmark crude oil contract.
Navigating the Geopolitical Crosscurrents
Middle East Tensions and Supply Chain Fragility
The persistent geopolitical tensions in the Middle East continue to be a primary catalyst for upward pressure on oil prices. Disruptions, or even the threat of disruptions, to crude oil supply from this vital region immediately translate into higher prices due to the market's inherent sensitivity to supply shocks. This is not a new phenomenon; history is replete with examples where regional conflicts have sent oil prices soaring, impacting global inflation and economic growth. The current situation, characterized by heightened rhetoric and localized skirmishes, creates a volatile environment where any escalation can trigger significant price spikes. Furthermore, the fragility of global supply chains, exacerbated by recent logistical challenges and trade disputes, means that any disruption, however localized, can have far-reaching consequences, impacting not just crude availability but also the refined products like naphtha, as suggested by recent reports concerning Japanese petrochemical plants potentially cutting gas demand due to naphtha scarcity.
This underlying supply-side risk premium is a constant factor for oil traders. It creates a floor beneath prices, making significant, sustained drops less likely unless there is a dramatic de-escalation of tensions or a clear signal of a global economic slowdown that would crush demand. The fact that Brent is trading at $101.86, having gained substantially on the day, underscores the market's current pricing-in of these geopolitical risks. The question remains whether this risk premium is fully baked into the current price or if there is further room for it to expand, especially if diplomatic efforts falter or new flashpoints emerge. The market’s reaction to news headlines from the region will be a key indicator in the coming days and weeks.
Economic Signals and Shifting Demand Outlook
PMI Data and Industrial Activity
On the demand side, recent Purchasing Managers' Index (PMI) data provides a mixed but cautiously optimistic signal. While some figures have shown resilience, others indicate a cooling in certain sectors. For instance, recent USD PMI data showed figures at 52.4 (actual) versus 51.5 (forecast), suggesting some expansion in the US manufacturing sector, which is a positive sign for oil demand. However, other USD PMI figures were softer, at 51.1 (actual) versus 52 (forecast), hinting at potential headwinds. This divergence in economic indicators creates uncertainty about the pace of global demand recovery. A robust recovery would undoubtedly support higher oil prices, potentially pushing Brent past the $103 resistance. Conversely, signs of a significant slowdown could curb demand expectations, leading to price corrections.
The interplay between geopolitical supply risks and demand-side signals creates a challenging trading environment. Traders must constantly assess which factor holds more weight at any given moment. Today, the upward price movement suggests that supply concerns are currently dominating. However, if upcoming economic data, such as employment figures or inflation reports, signal a significant global economic slowdown, the demand outlook could quickly overshadow supply fears. The market is particularly sensitive to shifts in Chinese economic activity, a major consumer of energy, and any data indicating a slowdown there would likely put immediate downward pressure on Brent, even with existing geopolitical risks. The current price of $101.86 reflects this delicate balance, with the market leaning towards supply-driven inflation.
Correlation with the US Dollar and Equities
The movement of Brent Crude is intrinsically linked to broader market sentiment, particularly the performance of the US Dollar Index (DXY) and major equity indices like the S&P 500. The DXY is currently at 99.41, showing a notable increase of 0.55% on the day. Typically, a stronger dollar makes dollar-denominated commodities like oil more expensive for holders of other currencies, which can dampen demand and put downward pressure on prices. This inverse correlation is a fundamental aspect of commodity trading. If the dollar continues to strengthen, it could act as a headwind for Brent, even if supply concerns persist.
Conversely, the performance of equity markets, such as the S&P 500 (currently at 6583.9, down 0.2%), offers insights into risk appetite. A decline in major stock indices often signals a 'risk-off' sentiment, where investors move away from riskier assets like commodities towards safer havens. If equities continue to slide, it could indicate a broader economic slowdown, thereby reducing expected oil demand and pressuring Brent prices lower. The current mixed signals - a rising DXY and a slightly declining S&P 500 - add to the complexity, suggesting that while geopolitical factors are currently pushing oil higher, broader economic and currency trends could soon play a more dominant role. This dynamic is crucial for understanding why Brent, despite current bullish drivers, faces resistance at $103.
Technical Analysis: Chart Patterns and Indicator Signals
The 1-Hour and 4-Hour Perspectives
Examining the shorter timeframes provides immediate tactical insights. On the 1-hour chart, Brent Crude shows a neutral trend with a power of 50%. The RSI is at 48.82, indicating a lack of strong directional conviction but with a slight downward lean. The MACD is exhibiting negative momentum, and prices are trading below the middle Bollinger Band, suggesting short-term selling pressure. Stochastic oscillators are in the oversold territory, hinting at a potential bounce, but the ADX at 17.36 confirms a weak trend overall. This 1H picture suggests that while there might be minor intraday fluctuations, the immediate direction is not strongly defined, and a break above key resistance is not yet assured.
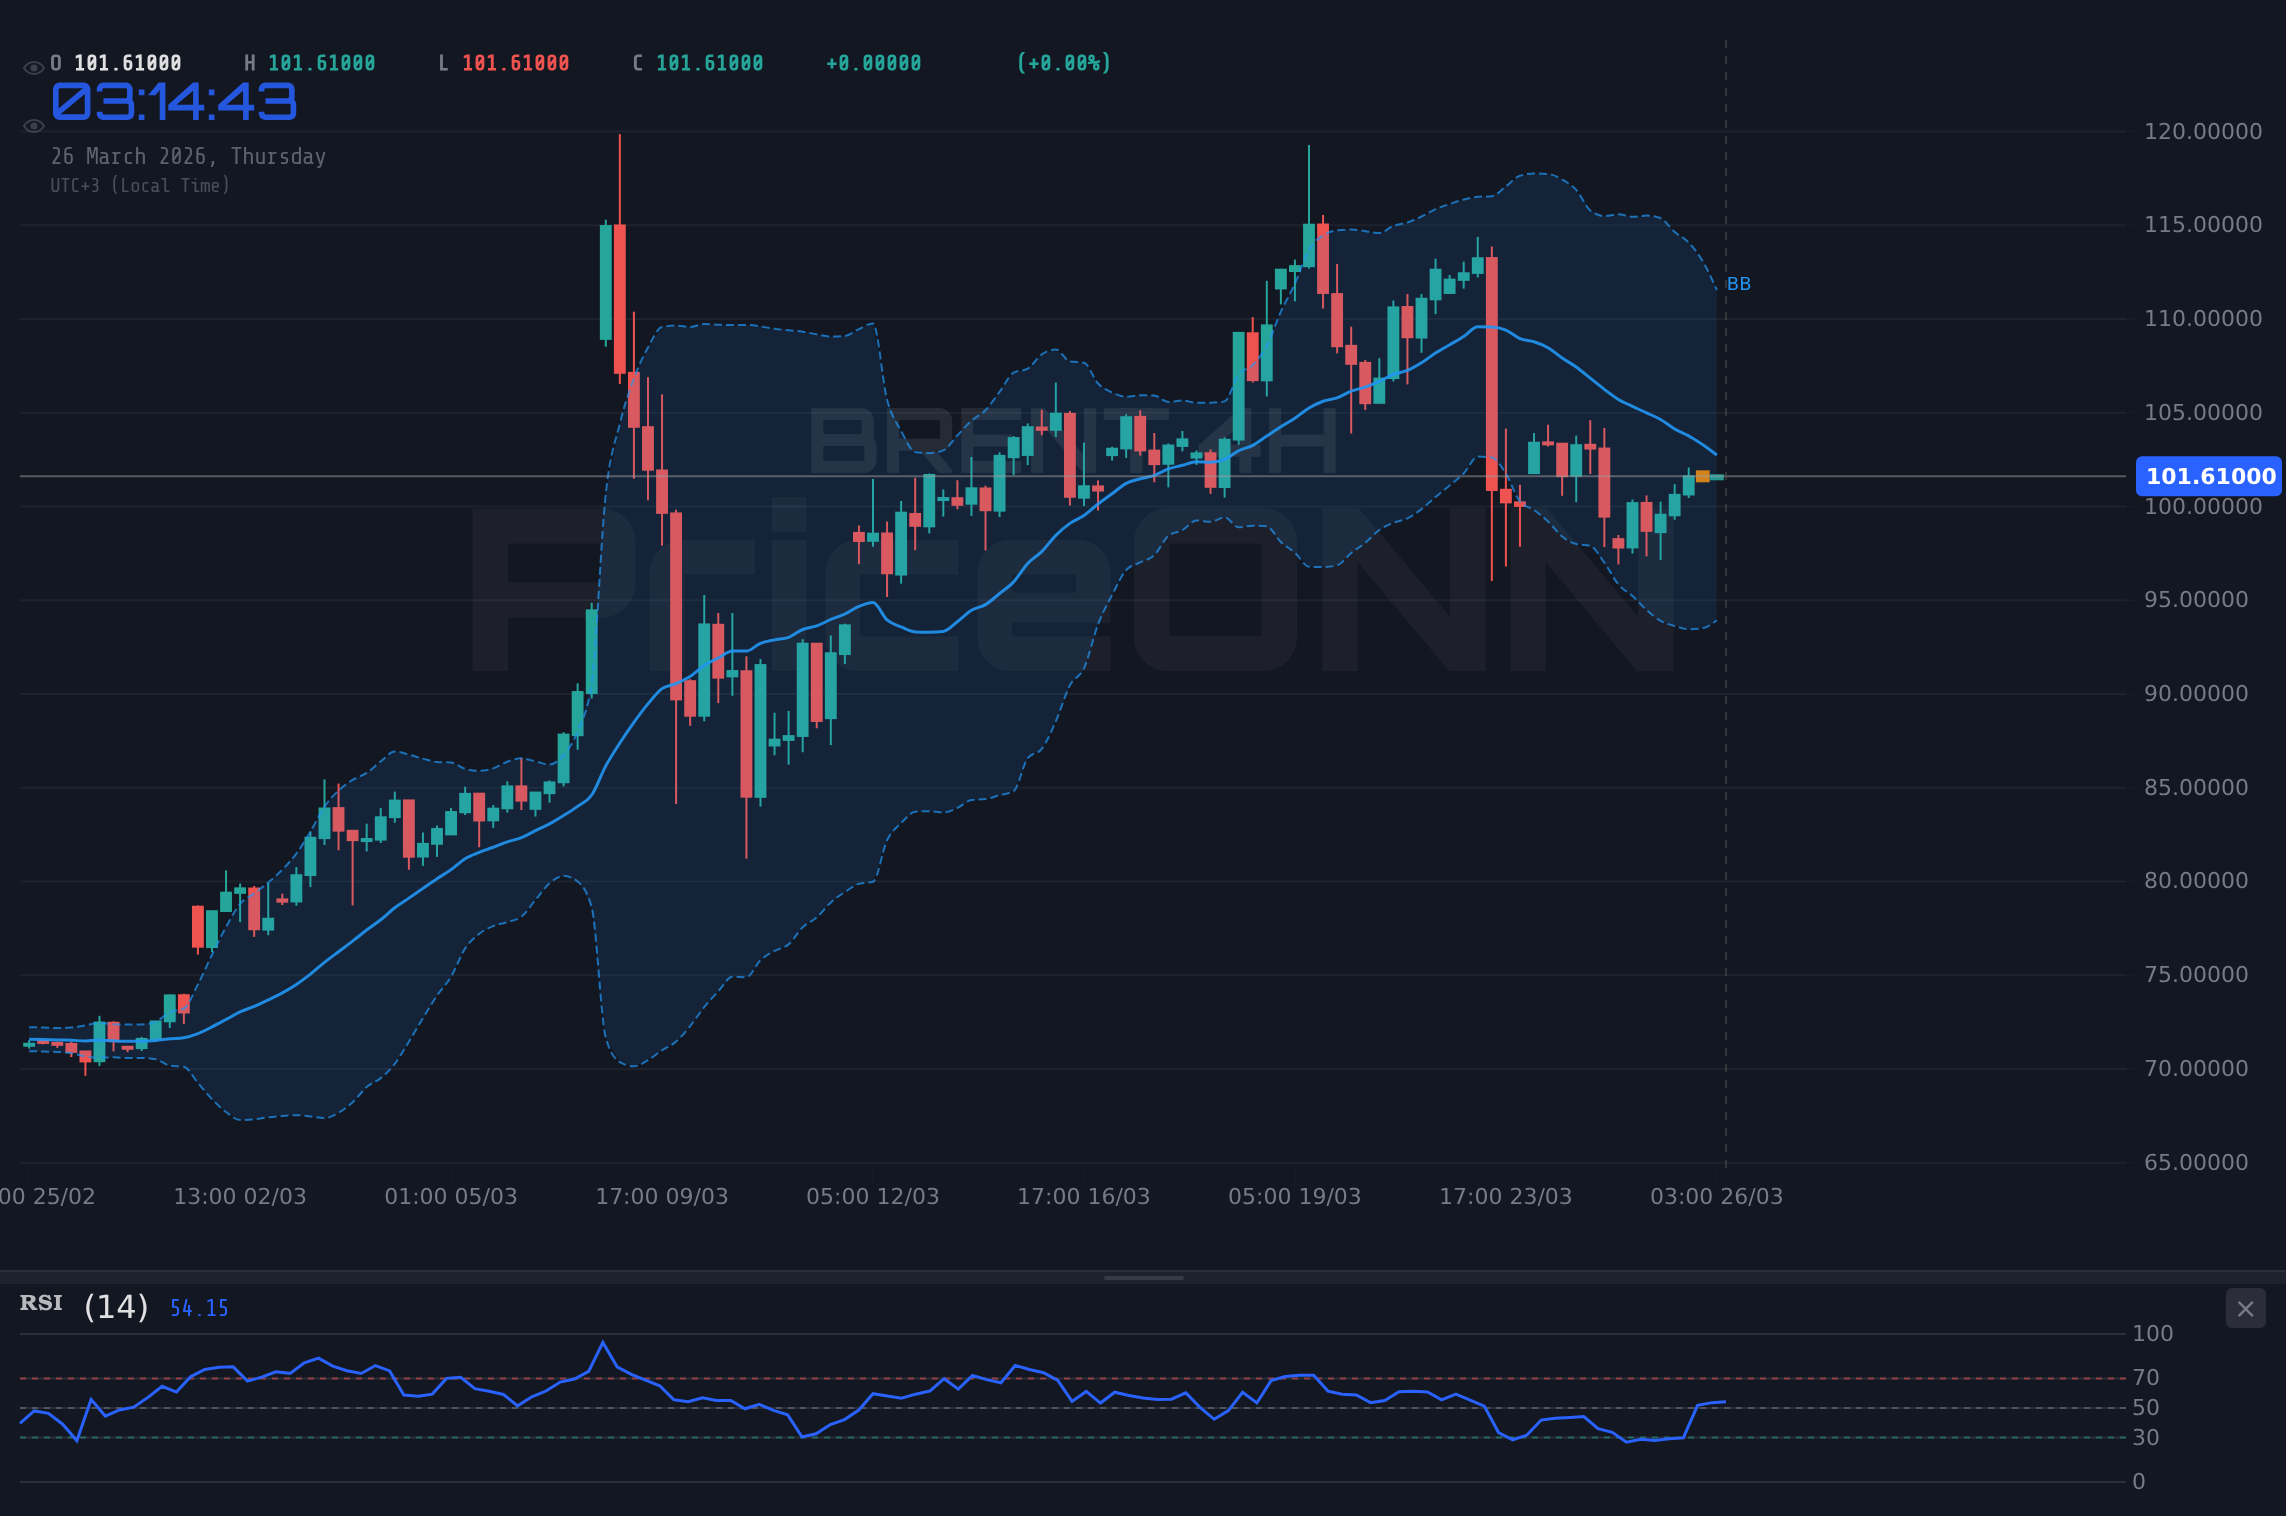
The 4-hour timeframe offers a slightly different narrative. The trend is still neutral (50% power), but the RSI at 46.95 continues to lean downwards. However, the MACD shows positive momentum, and prices are above the middle Bollinger Band, indicating a potential for upward movement. The Stochastic oscillator is in the overbought zone, and the ADX at 37.72 points to a strong downtrend, which seems contradictory to the Bollinger Band and MACD signals. This conflict between indicators on the 4H chart highlights the uncertainty. The 'General Signal' of 'SELL' on both 1H and 4H charts, derived from a composite of indicators, suggests caution for immediate buying opportunities despite the intraday price gains. The immediate resistance at $103, and the data points suggesting caution, make a decisive breakout less probable without further confirmation.
Daily Chart: The Longer-Term Trend
The daily chart provides the overarching context for Brent's price action. Here, the trend is clearly identified as 'Düşüş' (Downward) with a power of 94%. The RSI is hovering at 33.9, deep in the oversold territory, suggesting that while the downtrend has been strong, there may be room for a technical bounce. The MACD is below its signal line, reinforcing the bearish momentum, and prices are below the middle Bollinger Band, consistent with a downtrend. However, the Stochastic oscillator is showing a potential 'Yükseliş sinyali' (Buy signal) as %K crosses above %D, which often precedes a reversal or significant correction in a downtrend. The ADX at 27.45 confirms a strong downtrend, but its value suggests the trend might be maturing.
The 'General Signal' on the daily chart is 'SAT' (SELL), reflecting the dominant trend. Despite the oversold RSI and the Stochastic buy signal, the overall technical picture on the daily timeframe remains bearish. This suggests that any upward movement towards the $103 resistance might be a temporary correction within a larger downtrend, rather than the start of a sustained rally. The key support levels at $4503.86, $4490.41, and $4577.89 on the 1H and 4H charts, and $4358.65 on the daily, are significant downside targets if the bearish trend reasserts itself. For Brent to overcome the $103 resistance and signal a potential trend change, it would require sustained buying pressure, confirmation from multiple indicators, and a decisive break above key daily resistance levels.
Indicator Confluence and Divergences
The technical indicators present a complex and often conflicting picture, which is typical for markets at a potential turning point. On the 1-hour chart, the Stochastic oscillator is oversold, hinting at a potential bounce, but this is counteracted by the RSI's downward lean and the MACD's negative momentum. The ADX at 17.36 signifies a weak trend, meaning any short-term moves might lack follow-through. The 4-hour chart shows a similar lack of consensus, with Bollinger Bands suggesting an upward bias while the ADX indicates a strong downtrend. The daily chart, while showing a dominant downtrend, has conflicting signals: an oversold RSI and a Stochastic buy signal against a bearish MACD and overall trend direction.
This divergence is precisely where traders look for confirmation. A sustained break above the $103 resistance would be the first major signal of a potential trend shift. Confirmation would then be sought from indicators. For instance, a move of the RSI above 50, a bullish crossover on the MACD, and a sustained rise in the ADX (above 25) would collectively strengthen the bullish case. Until such confluence occurs, the current price of $101.86 remains a critical area where the prevailing bearish trend on the daily chart might reassert itself, especially if demand falters or geopolitical risks subside. The market's current positioning, with 'SELL' signals dominating across multiple timeframes, suggests that the $103 resistance is a significant barrier to overcome.
Trade Scenarios and Probability Assessment
Bearish Scenario: Resistance Holds, Trend Resumes
65% ProbabilityNeutral Scenario: Consolidation Around $101.86
25% ProbabilityBullish Scenario: Breakout Confirmation
10% ProbabilityEconomic Calendar and Market Impact
The economic calendar presents a mixed bag of data that could influence Brent Crude's trajectory. Recent US Manufacturing PMI figures showed a slight expansion, with the actual coming in at 52.4 against a forecast of 51.5. This positive surprise could be interpreted as a signal of robust industrial demand, lending support to oil prices. However, other USD data points, such as the ISM Services PMI at 51.1 versus a forecast of 52, suggest potential weakness in the services sector, which could temper demand expectations. The GBP data, with a consistent 3% interest rate, offers stability but limited immediate impact on oil unless broader economic sentiment shifts dramatically.
Looking ahead, the market will be closely monitoring upcoming economic releases for clearer signals on global economic health. The lack of specific dates for some high-impact USD events means traders must remain vigilant. Any indication of a significant global economic slowdown, perhaps signaled by weaker-than-expected employment or inflation data, could quickly shift the narrative from supply-driven price increases to demand destruction. Conversely, strong coordinated global growth data could provide the necessary impetus for Brent to decisively break its key resistance levels. The current price of $101.86 reflects the market's ongoing assessment of these competing factors, with geopolitical risks providing a current bullish bias.
Expert Opinion and Market Sentiment
Market sentiment, as reflected by technical indicators and recent news flow, suggests a cautious approach is warranted. While the short-term charts show some bullish signals, the dominant daily trend remains bearish. The ADX values across different timeframes range from weak (17.36 on 1H) to strong (63.2 on 1D for Brent), indicating a lack of consistent trend strength across all periods, but a clear downtrend on the longer timeframe. This suggests that the current upward move might be a corrective bounce within a larger bearish structure.
Furthermore, recent news regarding naphtha scarcity and potential cuts in petrochemical demand due to Middle East tensions highlights the sensitivity of the energy market to geopolitical events. This underscores the risk premium currently embedded in oil prices. However, if diplomatic channels manage to de-escalate tensions, or if global demand falters significantly due to economic headwinds, this risk premium could rapidly dissipate. The current price of $101.86 for Brent Crude is a delicate balance point, influenced heavily by these immediate supply-side fears. Traders are advised to watch for confirmation signals, particularly a decisive break above $103, before committing to a bullish stance.
Frequently Asked Questions: BRENT Analysis
What happens if BRENT breaks above the $103 resistance level today?
If Brent Crude decisively breaks and holds above the $103 resistance level, it would signal a potential shift in the short-term trend. This could trigger a move towards the next daily resistance at $103.43, with further upside potential towards $107.40 if momentum sustains.
Is the RSI at 55.98 a buy signal for BRENT at $101.86?
An RSI of 55.98 on the 1-hour chart suggests upward momentum is present but not yet in overbought territory. While it supports the current bullish move, it's not a standalone buy signal. Confirmation from other indicators like MACD and a break above key resistance at $103 would be needed for a stronger conviction.
How will the PMI data impact BRENT's price action this week?
Positive PMI data, like the recent US Manufacturing PMI exceeding forecasts at 52.4, supports oil demand and could push Brent towards resistance levels. Conversely, weaker-than-expected data could dampen demand outlooks, potentially causing a pullback from current levels around $101.86.
Should traders consider buying BRENT at $101.86 given the bearish daily trend?
Buying at $101.86 against a dominant daily bearish trend requires caution. While short-term signals might offer a trading opportunity, the risk of the downtrend resuming is significant. A confirmed break above $103 with supporting technicals would be a more prudent entry point for bullish positions.
Track markets in real-time
AI-powered analysis, technical indicators and real-time price data.
Join Our Telegram Channel
Breaking market news, AI analysis and trading signals instantly.
Join Channel