BTCUSD Hovers Near $69,835: Inflation Fears Signal Caution
Bitcoin struggles near $69,835 as escalating geopolitical tensions fuel inflation concerns, creating a complex trading environment. Key levels to watch.
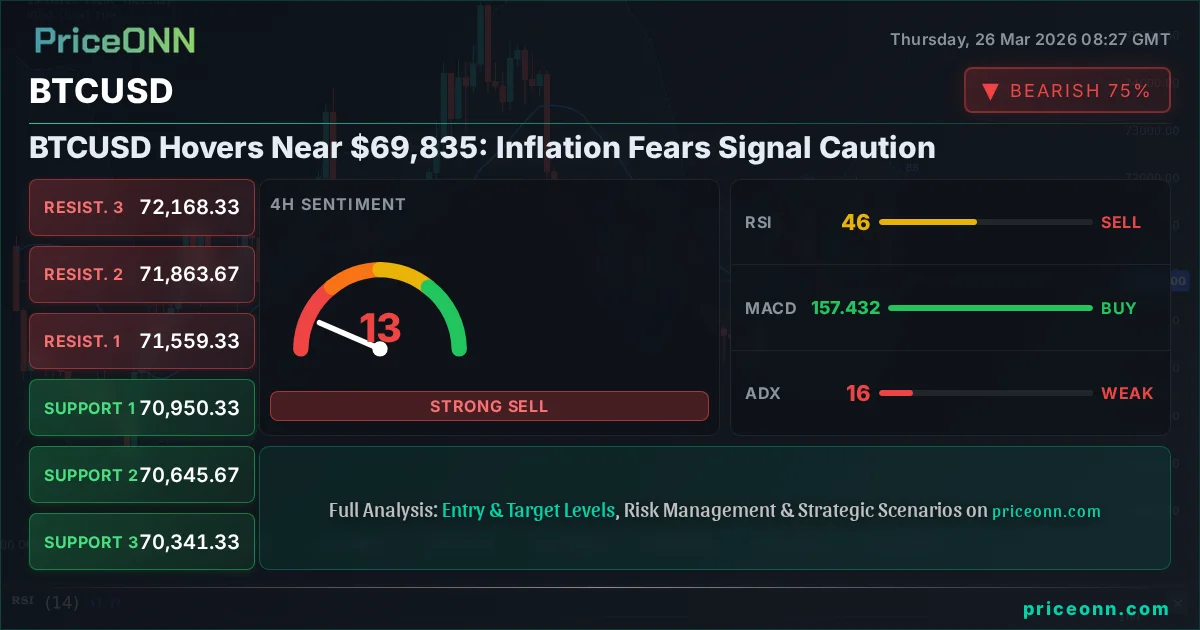
Bitcoin (BTCUSD) is currently trading precariously close to the significant $69,835 mark, a level that has become a focal point for traders and investors alike. This consolidation comes amid a backdrop of rising geopolitical tensions, particularly in the Middle East, which are stoking fresh inflation fears across global markets. The interplay between these macro factors and Bitcoin's technical setup is creating a complex and cautious sentiment, making it crucial to dissect the potential scenarios ahead.
- Bitcoin's price hovers near $69,835, with the 1H chart showing a weak trend (ADX 16.46) and negative momentum.
- Critical support for BTCUSD sits at $69,628.33, tested multiple times this week, while resistance looms at $70,510.33.
- The DXY index at 99.48 shows strength, potentially pressuring risk assets like Bitcoin as geopolitical tensions rise.
- With RSI at 33.06 on the 1H, bears are showing increased conviction, though the 1D Stochastic signals a potential bounce.
The current market environment for Bitcoin is a delicate balancing act. On one hand, the cryptocurrency has shown remarkable resilience, managing to hold ground above key psychological levels despite broader market jitters. On the other hand, the escalating conflict in the Middle East, coupled with persistent inflation concerns, is casting a shadow over risk appetite. This duality is reflected in the mixed signals from various technical indicators across different timeframes, demanding a nuanced approach to understanding BTCUSD's immediate future.
The Dollar Index (DXY) currently stands at 99.48, reflecting a strengthening US dollar. Historically, a robust dollar often correlates inversely with risk assets like Bitcoin, as it can signal a shift towards safer investments or indicate tighter global liquidity conditions. This strengthening DXY narrative, fueled by geopolitical uncertainty, adds another layer of pressure to Bitcoin's already sensitive price action. Traders are closely monitoring whether this correlation holds, as a sustained dollar rally could present a significant headwind for BTCUSD.
The Bull's Roadmap: Navigating the Upside
For the bulls to regain firm control, Bitcoin needs to decisively break through immediate resistance and establish a bullish trend across multiple timeframes. The 1H chart shows resistance at $70,510.33, followed by $71,360.33 and $72,168.33 on the 4H. A sustained move above $70,510.33, ideally with increasing volume and a positive shift in momentum indicators, would be the first sign of renewed buying interest. The RSI(14) on the 1H chart is currently at 33.06, indicating oversold conditions that could precede a bounce, but it needs to climb decisively above 50 to signal a shift in sentiment.
Confirmation of a bullish reversal would require the MACD to cross above its signal line on the 1H and 4H charts, coupled with the ADX indicator showing a sustained trend strength above 20, ideally in a rising direction. The Stochastic Oscillator, currently showing K=6.49 and D=24.85 on the 1H, is deep in oversold territory. A bullish crossover here, with the %K line moving above the %D line, could signal a short-term bounce. However, for a more robust uptrend, this bullish momentum needs to be confirmed on the daily timeframe, where the ADX is at a more significant 16.6, suggesting a weak trend that could easily reverse.
The primary trigger for a bullish scenario would be a clean break and hold above the $70,510.33 resistance level. If Bitcoin can manage this, the immediate target would be $71,360.33, and a more ambitious target could be the $72,168.33 level on the 4H chart. This path requires overcoming the current negative momentum and a clear shift in market sentiment, possibly driven by positive news or a decrease in geopolitical tensions. The 1D chart shows resistance at $71,996.67, which would be a crucial hurdle to clear for a sustained rally.
Where Bears Take Control: The Downside Risk
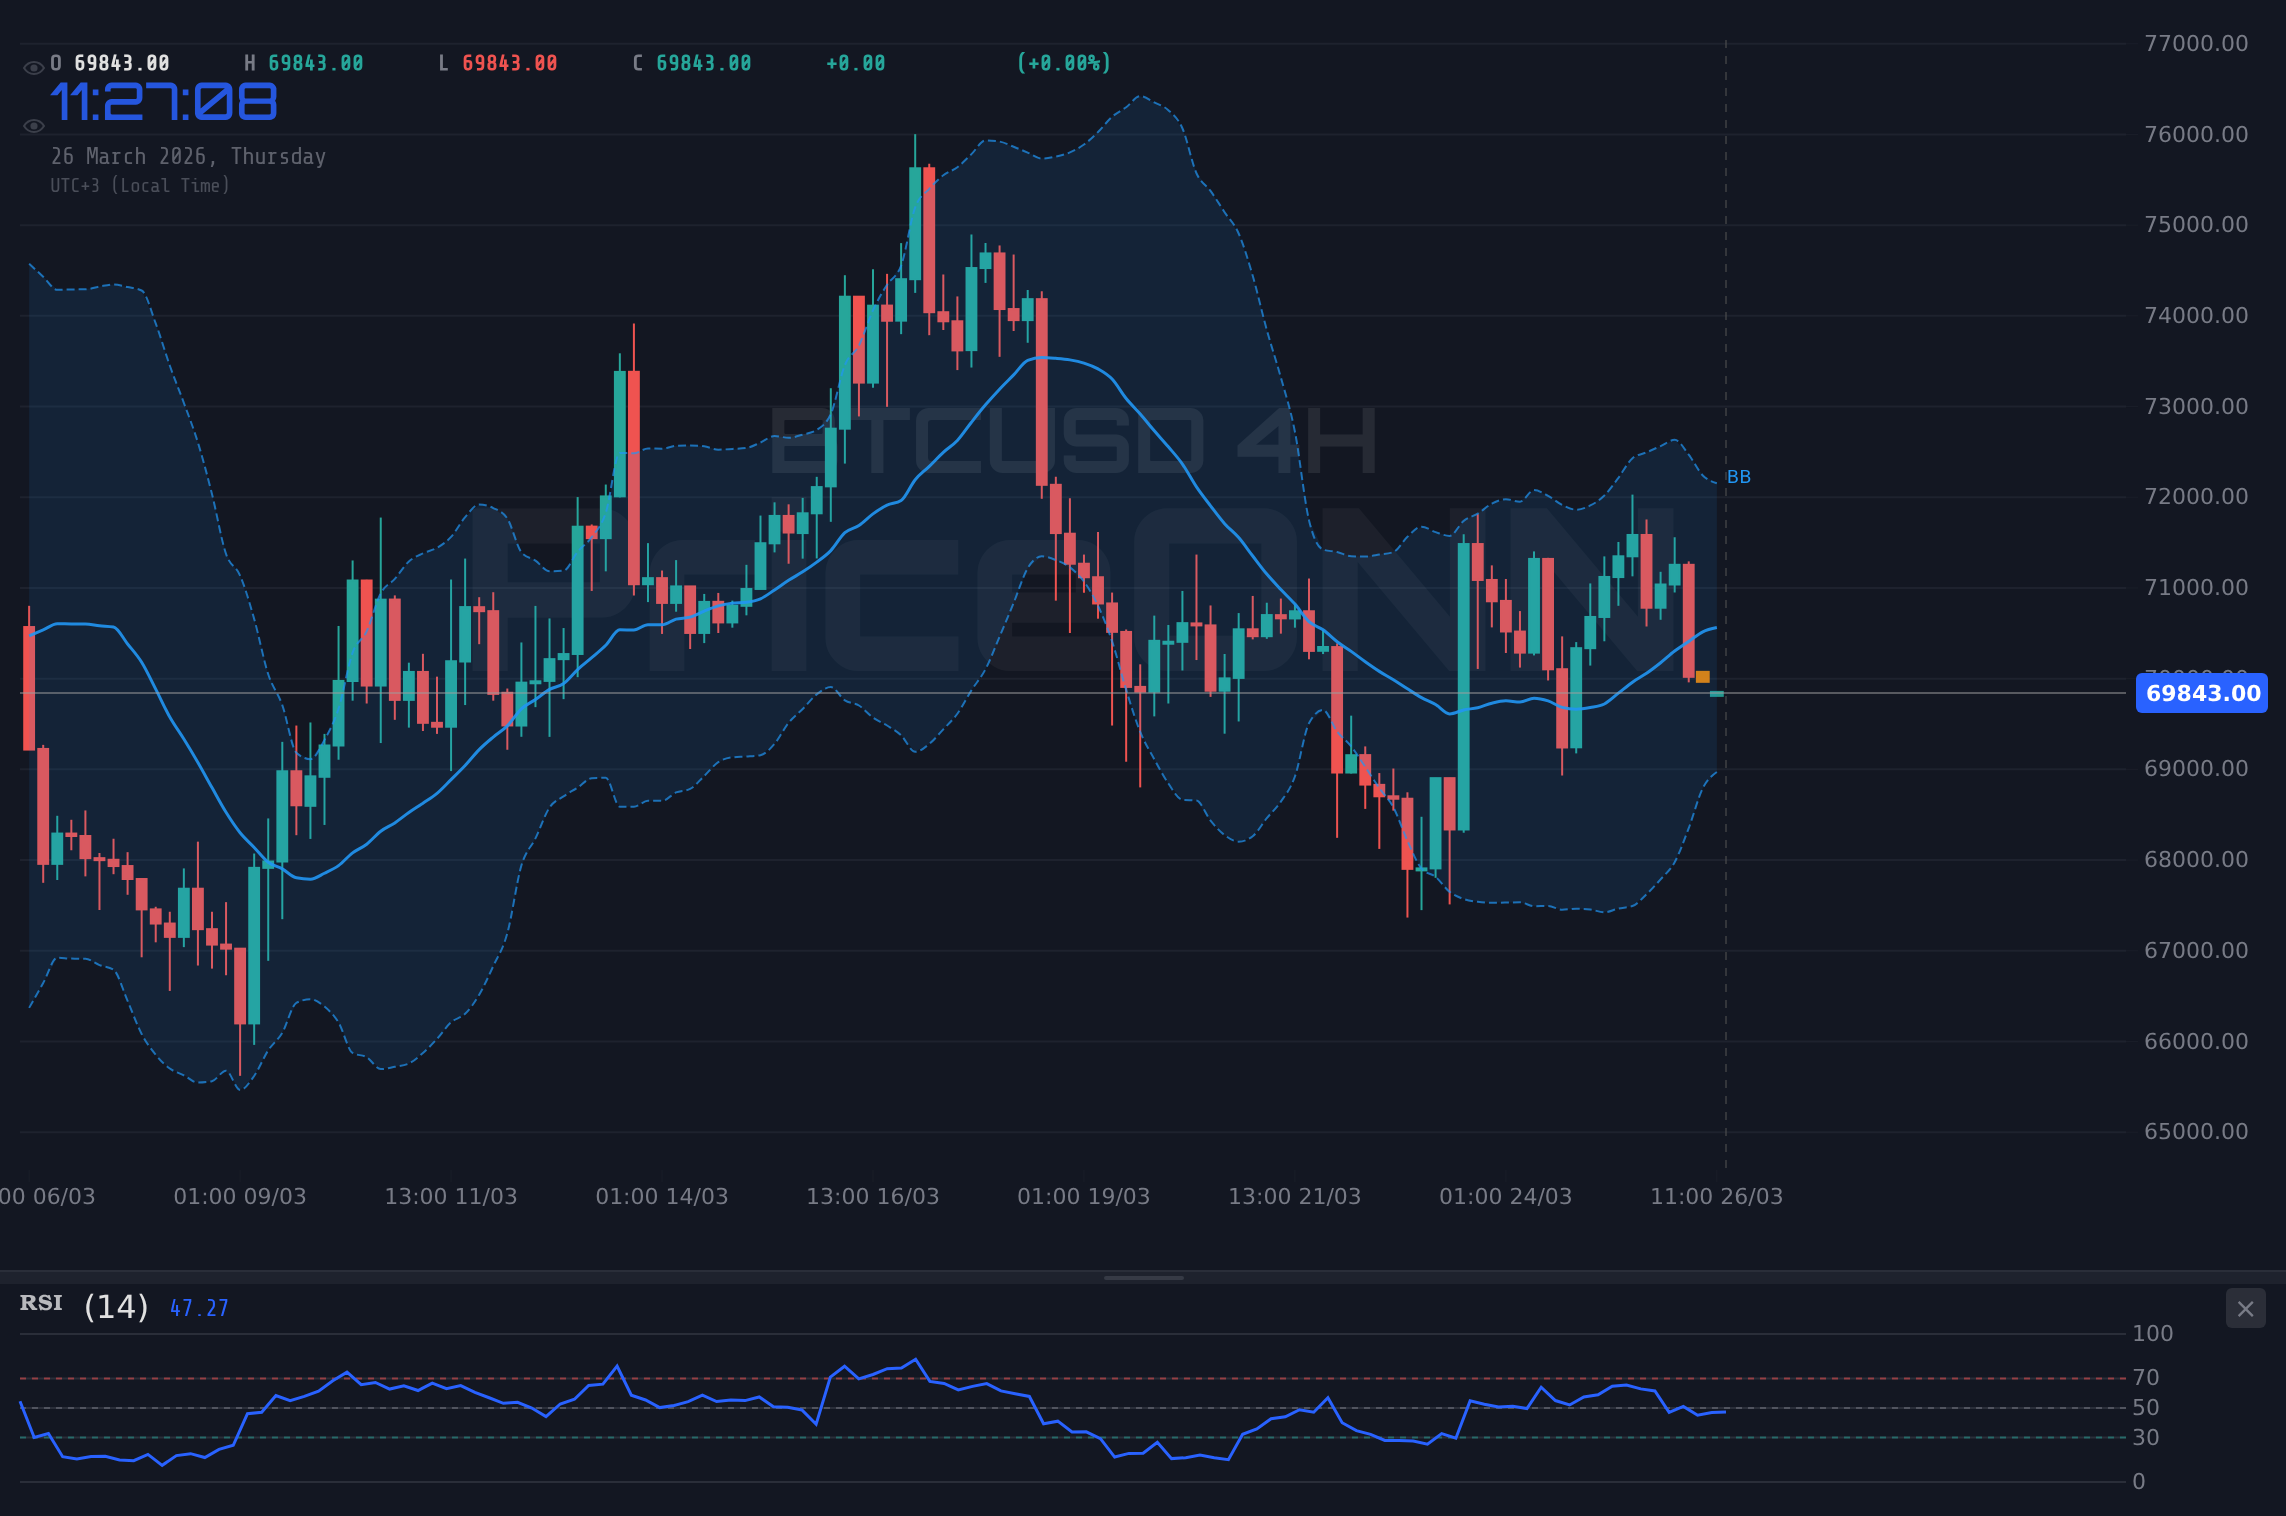
Conversely, the bearish scenario appears more potent given the current technical readings and macro environment. The 1H chart shows immediate support at $69,628.33, followed by $69,376.33 and $69,185.33 on the 1D chart. A break below $69,628.33, especially with strong selling volume, would confirm bearish sentiment. The RSI(14) at 33.06 on the 1H and 42.47 on the 4H suggests considerable room for further downside before reaching oversold territory. The MACD on the 1H is firmly negative, indicating prevailing selling pressure.
The ADX indicator provides a strong bearish clue. On the 1H, it's at 16.46, and on the 4H, it's 15.56, both indicating weak trending conditions. However, on the daily chart, the ADX rises to 16.6, suggesting that while the trend is weak, downward momentum is present. A more concerning signal comes from the Bollinger Bands. On the 1H and 4H charts, BTCUSD is trading below the lower band, which often precedes further price declines or signals extreme bearish sentiment. The Stochastic Oscillator on the 1H (K=6.49, D=24.85) is deeply oversold, but this can persist in strong downtrends, offering little immediate comfort to bulls.
If the bears gain the upper hand, the first key support level to watch would be $69,628.33. A decisive close below this could open the path towards $69,376.33 and potentially the $69,185.33 level on the daily chart. Further downside could target $68,226.67, a significant level seen on the 1D timeframe. The invalidation of this bearish thesis would occur if price decisively breaks above $70,510.33, signaling a potential shift in momentum.
The Waiting Game: Navigating Sideways Action
While the immediate indicators lean towards caution, the possibility of range-bound trading cannot be entirely dismissed, especially given the weak ADX readings across multiple timeframes. This neutral scenario typically occurs when conflicting signals create indecision, or when market participants are waiting for a clear catalyst. In such a phase, Bitcoin could oscillate between its immediate support and resistance levels without establishing a clear direction.
The current trading range appears to be roughly defined by the $69,628.33 support and the $70,510.33 resistance on the 1H chart. Within this range, price action might be choppy, with potential for short-term volatility but no sustained trend. The 4H chart shows a wider range, with support at $70,341.33 and resistance at $71,863.33. The daily Stochastic Oscillator, however, shows %K at 36.74 and %D at 27.59, suggesting a potential upward signal, which could keep prices from falling too far. This conflict between short-term bearish indicators and a longer-term potentially bullish Stochastic reading highlights the current indecision.
A neutral scenario would likely persist until a significant macroeconomic event or a clear geopolitical development forces a directional move. Until then, traders might expect choppy price action with limited upside potential and downside risk within the established bands. The key here is to identify when the price is respecting these boundaries and to avoid chasing trades that lack strong momentum confirmation. The weak ADX readings across the board support the idea that the market is currently lacking a strong directional conviction.
The Bearish Grind: Downside Pressure Mounts
65% ProbabilityConsolidation Phase: Choppy Waters Ahead
25% ProbabilityBullish Rebound: A Cautious Optimism
10% ProbabilityWhat's Driving the Market Sentiment?
The overarching theme influencing BTCUSD and broader markets remains the persistent inflation fears, exacerbated by the escalating geopolitical tensions in the Middle East. This narrative directly impacts central bank policy expectations. While the Federal Reserve might be on a path towards potential rate cuts later in the year, any signs of sticky inflation could force them to maintain a hawkish stance for longer. This uncertainty directly affects risk assets, with Bitcoin often being among the first to react to shifts in monetary policy expectations.
The recent economic data releases offer a mixed picture. While some US indicators, like the latest ISM Manufacturing PMI at 52.4 (forecast 51.5), suggest resilience in the economy, others like the ISM Services PMI showing 51.1 (forecast 52) point to potential cooling. The JOLTS Job Openings data, while not provided with specific numbers in the snippet, often provides crucial insights into labor market dynamics, which are key for the Fed. Any surprises in upcoming employment figures or inflation data could significantly sway Bitcoin's price action.
Furthermore, the strength of the US Dollar (DXY at 99.48) is a critical factor. A stronger dollar typically makes dollar-denominated assets, including Bitcoin, more expensive for holders of other currencies, potentially dampening demand. The correlation between DXY and BTCUSD needs careful observation. If the dollar continues to strengthen due to safe-haven flows driven by Middle East tensions, it could exert additional downward pressure on Bitcoin. The narrative around Western Canada's LNG projects and Australia's AUD facing inflation risks due to these tensions highlights the global nature of these concerns, potentially leading to broader risk aversion.
Navigating the Technical Landscape
Delving deeper into the technicals, the 1H chart paints a picture of caution. The RSI(14) at 33.06 is approaching oversold territory, but the MACD is showing negative momentum, with the MACD line below the signal line. The ADX at 16.46 indicates a weak trend, suggesting that any moves might lack sustained conviction. The Stochastic Oscillator, with K=6.49 and D=24.85, is deeply oversold, hinting at a potential short-term bounce, but this can persist in downtrends.
The 4H chart presents a slightly different, though still cautious, view. The RSI(14) is at 42.47, still in neutral territory with a downward bias. The MACD shows positive momentum, which is a slight divergence from the 1H, but the Stochastic Oscillator (K=55.37, D=74.04) is in the upper range, showing a potential for a downturn. The ADX at 15.56 reinforces the idea of a weak trend. On this timeframe, resistance is seen at $71,559.33 and support at $70,950.33.
The daily timeframe offers the longest-term perspective. Here, the RSI(14) is at 48.25, hovering near the midpoint, suggesting neither strong buying nor selling pressure. The MACD is negative, indicating prevailing bearish momentum, but the Stochastic Oscillator (%K=36.74, %D=27.59) is showing a potential bullish signal with %K above %D. The ADX at 16.6 points to a weak trend. The key daily support is at $70,111.67, with resistance at $71,996.67. This mixed picture across timeframes underscores the current indecision and the importance of price action at key levels.
| Indicator | Value | Signal | Interpretation |
|---|---|---|---|
| RSI (14) | 33.06 | Bearish | Approaching oversold on 1H, but still room to fall. |
| MACD | - | Bearish | Negative momentum on 1H, below signal line. |
| Stochastic | K: 6.49, D: 24.85 | Bearish | Deeply oversold on 1H, potential for bounce but trend is weak. |
| ADX | 16.46 | Neutral | Weak trend strength on 1H, suggesting choppy action. |
| Bollinger Bands | Lower Band Break | Bearish | Price below lower band on 1H indicates selling pressure. |
What to Watch This Week: Key Triggers
The immediate future for Bitcoin will likely be dictated by a confluence of technical levels and macroeconomic news. Traders should keep a close eye on the $69,628.33 support level. A failure to hold this could trigger significant downside momentum, aligning with the prevailing bearish sentiment. Conversely, a decisive push above $70,510.33, especially if accompanied by strong volume and positive shifts in momentum indicators like the MACD and RSI, would signal a potential bullish reversal.
Geopolitical developments will remain a key wildcard. Any escalation or de-escalation in the Middle East could dramatically shift risk appetite, impacting Bitcoin alongside other risk assets and gold. Investors should also pay close attention to upcoming US economic data, particularly employment figures and inflation prints. Surprises in these reports could influence Federal Reserve policy expectations, a major driver for cryptocurrency markets. The strength of the DXY will also be a crucial barometer for risk sentiment.
Finally, the overall market structure needs continued monitoring. The weak ADX readings across timeframes suggest that we might be in for a period of consolidation or choppiness. Patience will be key; waiting for clear signals and confirmation of trend direction before committing to significant positions is advisable. The interplay between short-term oversold Stochastic signals and longer-term bearish MACD readings highlights the current ambiguity.
Frequently Asked Questions: BTCUSD Analysis
What happens if BTCUSD breaks below the $69,628.33 support level?
A break below $69,628.33 on the 1H chart, especially with increased volume, would likely trigger further downside momentum. This could lead to tests of $69,376.33 and potentially $69,185.33, aligning with the bearish scenario's targets.
Should I buy BTCUSD at current levels near $69,835 given the RSI at 33.06?
Buying solely based on the RSI at 33.06 would be risky, as it can remain in oversold territory during downtrends. Confirmation is needed, such as a bullish MACD crossover and a break above immediate resistance at $70,510.33, before considering a bullish entry.
Is the weak ADX reading of 16.46 on the 1H chart a sell signal for BTCUSD?
No, a weak ADX reading of 16.46 itself is not a sell signal; it indicates a lack of strong trend. It suggests that current price action might be choppy or range-bound, making directional trades riskier until a clear trend emerges.
How will rising DXY (currently 99.48) and Middle East tensions affect BTCUSD this week?
Rising DXY often puts pressure on risk assets like BTCUSD due to safe-haven flows. Escalating Middle East tensions could exacerbate this, potentially leading to further downside for Bitcoin as investors seek perceived safety in the dollar.
Track markets in real-time
AI-powered analysis, technical indicators and real-time price data.
Join Our Telegram Channel
Breaking market news, AI analysis and trading signals instantly.
Join Channel