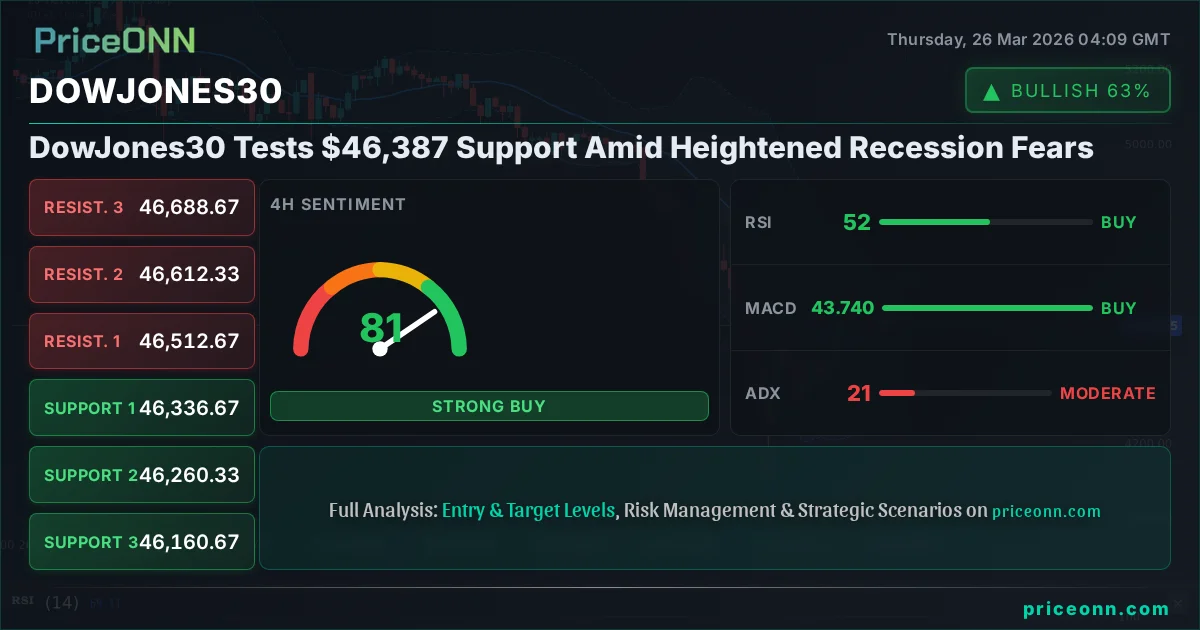
DowJones30 Tests $46,387 Support Amid Heightened Recession Fears
DowJones30 hovers near $46,387 as the DXY strengthens and geopolitical risks escalate, prompting a technical review of key levels and potential scenarios.
The Dow Jones Industrial Average (DJIA) finds itself at a critical juncture, trading around the $46,387 mark as a confluence of rising recession fears and geopolitical tensions casts a shadow over the market. This delicate balance demands a close examination of the technical landscape, particularly the support levels that are being tested and the resistance zones that could dictate the index's short-to-medium term trajectory. With the Dollar Index (DXY) showing renewed strength and oil prices reflecting underlying inflationary pressures, understanding the interplay between these macro factors and the Dow Jones's price action is paramount for traders navigating this uncertain environment.
- The Dow Jones Industrial Average is trading near the critical $46,387 support level, with a daily RSI of 36.2 indicating potential for further downside pressure.
- Key support is identified at $46,154.67 (S1), with a breakdown below this level potentially targeting $45,896.33 (S2).
- Resistance is forming around $46,707.67 (R1), a break above which could signal a short-term recovery, though ADX at 40.99 suggests a strong trend is in play.
- The strengthening DXY (currently at 99.4) and elevated oil prices are contributing to market caution, influencing correlation dynamics for the Dow Jones.
Navigating the Dow Jones's Current Technical Stance
On the daily timeframe, the Dow Jones Industrial Average presents a picture of considerable caution. The index is currently trading below its 50-day moving average, a common technical signal that often precedes further downside movement. The ADX indicator, a measure of trend strength, stands at a robust 40.99 on the daily chart, signaling a strong prevailing trend. Given the current price action and the robust ADX reading, the prevailing trend appears to be downwards, despite the choppy, range-bound conditions observed on shorter timeframes. The RSI(14) at 36.2 further reinforces this bearish sentiment, sitting deep within the neutral zone and showing a clear downward lean, suggesting that sellers have maintained the upper hand over the past several sessions.
Zooming into the 4-hour chart, the picture becomes slightly more nuanced, though still leaning bearish. Here, the ADX is at 20.55, indicating a moderate trend strength, a significant step down from the daily reading but still suggesting directional movement is present. The RSI(14) is hovering at 52.44, a level that historically has acted as a pivot point, neither strongly indicating overbought nor oversold conditions but leaning towards a slight bullish bias on this timeframe. However, the MACD histogram, while positive, is showing signs of narrowing momentum, and the Stochastic Oscillator's K line at 66.02 and D line at 72.94 suggest an overbought condition on this timeframe, with a potential bearish crossover imminent. This conflict between the daily's strong bearish signals and the 4-hour's mixed indicators highlights the current indecision and the importance of watching for confirmation on shorter timeframes.
The 1-hour chart introduces further complexity, painting a picture of consolidation rather than decisive trend. The ADX here is a mere 10.27, signifying a very weak trend and indicating that shorter-term price action is largely range-bound. The RSI(14) sits at 49.88, almost perfectly neutral, offering little directional insight. The MACD is in negative territory, with the histogram below the signal line, suggesting bearish momentum on this very short-term scale. Compounding this, the Stochastic Oscillator shows K=29.78 and D=35.1, indicating oversold conditions and a potential for a short-term bounce. This divergence across timeframes - a strong downtrend on the daily, moderate trend on the 4-hour with conflicting signals, and a weak, choppy trend on the 1-hour - underscores the current market's indecisiveness and the need for a clear catalyst to break the stalemate.
The Dollar's Grip and Oil's Influence
The broader market context cannot be ignored when assessing the Dow Jones's prospects. The Dollar Index (DXY) is currently trading at 99.4, showing a clear upward bias and exhibiting strong bullish signals on the daily timeframe, with an ADX of 31.32. Historically, a strengthening dollar often correlates with pressure on U.S. equity indices like the Dow Jones, as it can make American exports more expensive and reduce the value of foreign earnings when repatriated. This inverse relationship is a key factor to monitor, especially as the DXY pushes towards its daily resistance at 99.72. The fact that the DXY is showing strong upward momentum while the Dow Jones is testing support levels creates a challenging environment for the bulls.
Furthermore, oil prices, represented by Brent Crude at $102.06, are also signaling inflationary pressures and potential economic headwinds. Brent Crude's ADX at 62.51 on the daily chart indicates a very strong uptrend, pushing towards its daily resistance of $103.49. Elevated oil prices can act as a drag on economic growth by increasing operational costs for businesses and reducing consumer discretionary spending. This persistent inflationary pressure is a significant concern for central banks, potentially leading to prolonged higher interest rates, which in turn can dampen corporate earnings and stock valuations. The Dow Jones's sensitivity to these macroeconomic indicators means that continued strength in oil prices, coupled with a robust dollar, creates a strong headwind for the index.
The economic calendar, while not showing immediate high-impact events for the US today, has recent data that paints a concerning picture. The ISM Manufacturing PMI came in at 52.4, slightly above the forecast of 51.5, but the ISM Services PMI was 51.1, below the forecast of 52. The recent figures for industrial production and capacity utilization, while not explicitly detailed here for immediate impact, have been mixed. The market is keenly awaiting upcoming high-impact data releases, particularly any indicators that might sway Federal Reserve policy. The current elevated geopolitical risk, as highlighted by recent news suggesting potential US-Iran ceasefire hopes dimming and continued global tensions, adds another layer of uncertainty, often leading to a flight towards perceived safe-haven assets and away from riskier equities like those in the Dow Jones.
Key Levels and the Battle for Control
The immediate focus for the Dow Jones rests on the $46,387 level. This price point is not just a psychological benchmark but also represents a significant area of historical price action. Looking at the daily support levels provided, S1 is at $46,154.67, S2 at $45,896.33, and S3 at $45,601.67. A decisive break below $46,387 and subsequently S1 at $46,154.67 would likely trigger further selling pressure, potentially engulfing the index in a more significant downturn towards S2. The strength of the daily ADX at 40.99 suggests that if a breakdown occurs, it could be swift and decisive, lacking the chop seen on shorter timeframes.
Conversely, any upward movement will need to contend with immediate resistance. The first level of resistance (R1) stands at $46,707.67. A sustained move above this level, coupled with increasing volume and a shift in shorter-term indicator signals towards bullish, could signal a temporary reprieve or a short-covering rally. However, the overall bearish trend indicated by the daily chart, alongside the strengthening dollar and oil price pressures, suggests that any rallies may be met with selling interest. R2 at $47,002.33 and R3 at $47,260.67 represent more significant hurdles that would require a fundamental shift in market sentiment to overcome. The current technical setup implies that upside potential is currently capped, with downside risks appearing more pronounced.
The divergence in signals across timeframes is a critical element for traders to consider. While the daily chart paints a bearish picture with a strong ADX and oversold RSI potential, the 1-hour chart shows weakness in trend and a potential for a short-term bounce, indicated by the Stochastic Oscillator. This conflict suggests a market in transition or indecision. Traders should be looking for confirmation: a clear break of the $46,387 support with follow-through on the daily chart, or a decisive rally above the $46,707.67 resistance, supported by improved macroeconomic sentiment and a softening dollar. Without such confirmation, the expectation should be for continued choppiness, with a bias towards further downside given the prevailing daily trend.
Trade Scenarios and Risk Management
Given the current technical confluence and macroeconomic backdrop, three primary scenarios emerge for the Dow Jones Industrial Average:
Bearish Scenario: Sustained Downtrend Continues
65% ProbabilityNeutral Scenario: Range-Bound Consolidation
25% ProbabilityBullish Scenario: Short-Covering Rally
10% ProbabilityRisk management is crucial in the current environment. Given the strong daily trend and the conflicting signals on shorter timeframes, stop-loss orders should be placed judiciously. For any bearish positions initiated on a breakdown, stops should be placed above the R1 resistance level. For any opportunistic long positions aiming for a bounce, stops should be set just below the immediate support levels being tested. The high ADX readings on the daily chart suggest that trends, once established, can be quite persistent, making the confirmation of a new trend direction critical before committing significant capital.
The recent news flow, including reports of potential US-Iran ceasefire hopes dimming and the general geopolitical jitters, adds an unpredictable element. While some reports suggest Dow Jones futures might climb on peace deal hopes, the current macro pressures - a strong dollar and rising oil prices - remain potent counterforces. Traders should remain vigilant for any significant shifts in geopolitical news or economic data that could rapidly alter the market's risk appetite and, consequently, the Dow Jones's trajectory. The correlation with the DXY, currently at 99.4 and trending up, is a key relationship to watch; any weakening in the dollar could provide a tailwind for equities, while further dollar strength would likely exacerbate downward pressure.
The Road Ahead: What to Watch
Looking forward, the Dow Jones Industrial Average is at a critical juncture, poised between the potential for a further descent driven by recession fears and a technical bounce from key support levels. The $46,387 price point is the immediate line in the sand. A failure to hold this level, particularly with the daily chart showing a strong bearish trend (ADX 40.99), could open the door to significant declines towards $46,154.67 and beyond. Conversely, a holding pattern around current levels, potentially leading to a short-covering rally, would require breaking through the $46,707.67 resistance, a feat that seems challenging given the prevailing macroeconomic headwinds.
Traders should be monitoring the DXY closely; its current strength at 99.4 and upward trend is a significant headwind for the Dow Jones. A pullback in the dollar could provide some relief, but the persistent strength in oil prices, with Brent Crude at $102.06 and a strong daily uptrend, suggests that inflationary concerns are unlikely to abate quickly. This complex interplay of factors necessitates a data-driven approach. Patience will be rewarded as the market seeks clearer direction. Waiting for confirmation of either a breakdown below key support or a decisive breakout above resistance, supported by shifts in broader market sentiment and economic indicators, will be crucial for navigating the coming sessions effectively.
Frequently Asked Questions: DowJones30 Analysis
What happens if the Dow Jones breaks below the $46,387 support level?
A break below $46,387 on the Dow Jones, especially with the daily ADX at 40.99 indicating a strong trend, would likely trigger further selling pressure. Key support at $46,154.67 (S1) would be the next immediate target, with a potential move down to $45,896.33 (S2) if momentum continues.
Should I consider buying the Dow Jones at current levels around $46,387 given the mixed signals?
Buying at current levels carries significant risk due to the strong bearish trend on the daily chart (RSI 36.2) and the strengthening DXY. While a short-term bounce is possible from $46,387, a more prudent approach would be to wait for a clear confirmation of a bullish reversal, such as a break above $46,707.67, or a confirmed bounce from a deeper support level with improved market sentiment.
How is the RSI reading of 36.2 on the daily chart impacting the Dow Jones outlook?
An RSI of 36.2 on the daily chart for the Dow Jones indicates that the index is in a bearish territory, though not yet technically oversold. This reading suggests that selling momentum has been dominant, and while it may signal potential for a bounce, it primarily reinforces the prevailing downward pressure and the risk of further declines.
How will the rising DXY (currently at 99.4) and oil prices affect the Dow Jones this week?
The strengthening DXY at 99.4, coupled with Brent Crude nearing $103.49 resistance amidst a strong uptrend, creates headwinds for the Dow Jones. A strong dollar typically puts pressure on US equities, while high oil prices can signal inflationary concerns that might lead to tighter monetary policy. This combination suggests that any rallies in the Dow Jones may face significant selling pressure unless these macro factors show a clear reversal.
Track markets in real-time
AI-powered analysis, technical indicators and real-time price data.
Join Our Telegram Channel
Breaking market news, AI analysis and trading signals instantly.
Join Channel