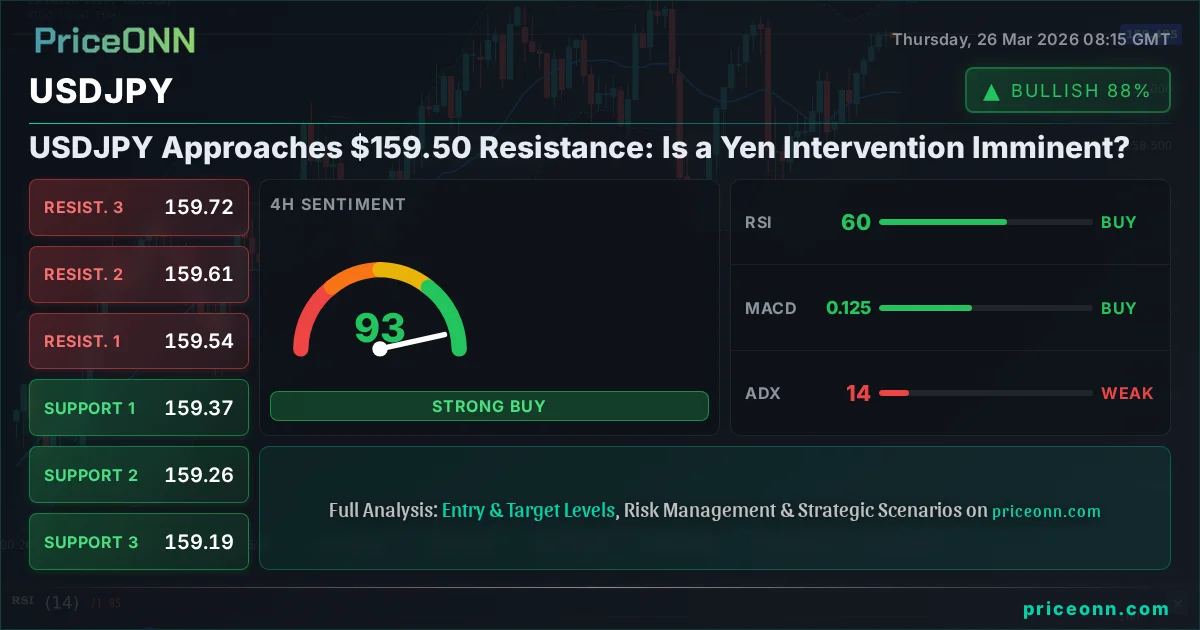
USDJPY Approaches $159.50 Resistance: Is a Yen Intervention Imminent?
USDJPY hovers near $159.50 resistance amid strong DXY gains and escalating geopolitical tensions. Traders watch for potential intervention or a breakout.
The USDJPY currency pair is currently consolidating in the vicinity of the critical $159.50 resistance level, a price point that has historically been a focal point for market participants and, potentially, for Japanese authorities. With the US Dollar Index (DXY) showing renewed strength and geopolitical tensions escalating in the Middle East, the yen is facing significant headwinds. This delicate balance between a strengthening dollar and the ever-present threat of currency intervention creates a high-stakes environment for traders looking to navigate the USDJPY pair.
- USDJPY is trading near the $159.50 resistance level, a key area of focus.
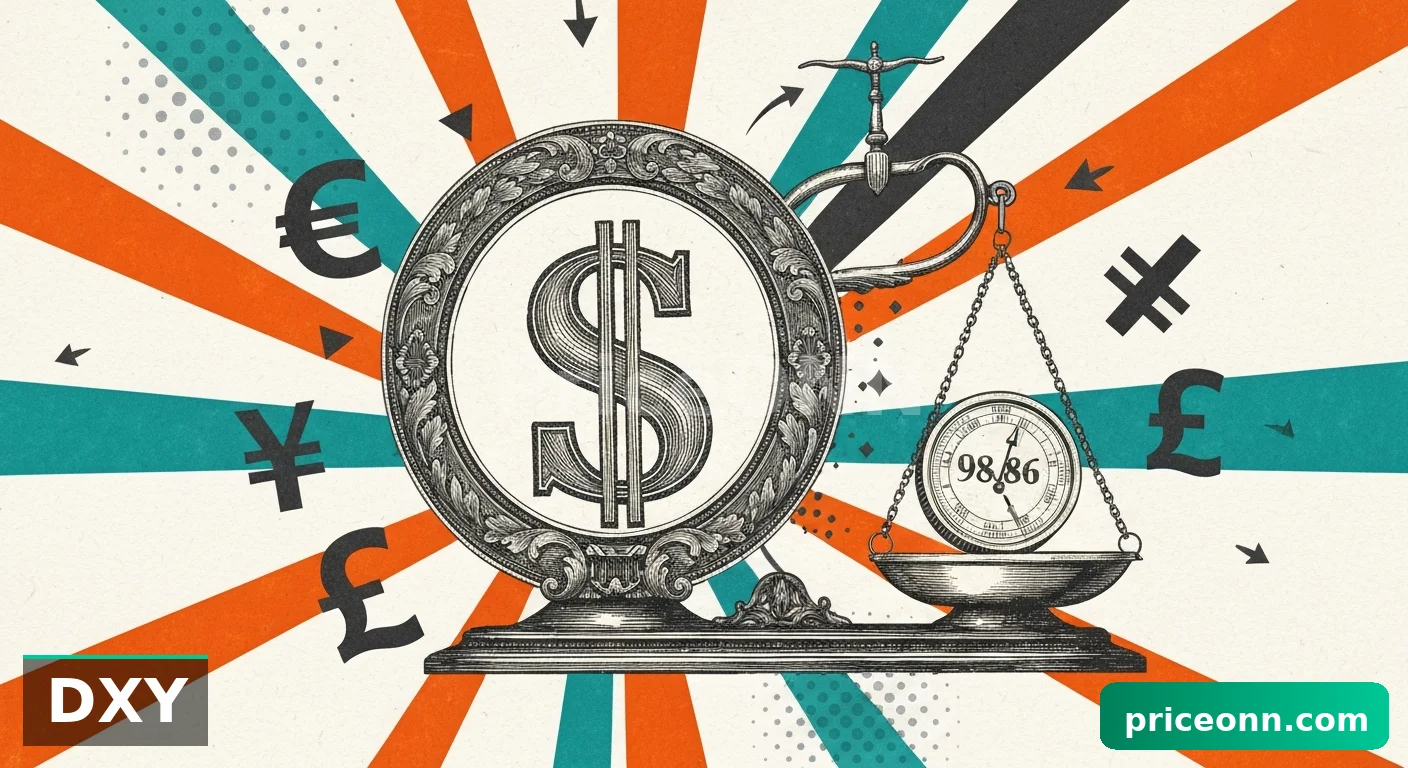
- The DXY is at 99.51, indicating dollar strength that typically pressures the yen.
- Geopolitical tensions are rising, potentially increasing safe-haven demand for the yen or triggering intervention.
- Technical indicators show a strong uptrend on USDJPY but also highlight overbought conditions on shorter timeframes, suggesting caution.
The current price action around $159.50 for USDJPY is not just a technical observation; it's a signal of underlying market forces at play. The daily chart for USDJPY shows a robust upward trend, with the price currently sitting at $159.504. However, the ADX indicator at 21.64 on the daily timeframe suggests a moderately strong trend, while the 1H and 4H charts show weaker ADX values, hinting at potential consolidation or ranging conditions in the immediate term. This divergence across timeframes underscores the complexity of the current setup. The daily RSI at 59.67 indicates a neutral-to-bullish leaning, far from overbought territory, yet shorter-term indicators on the 1H chart are flashing caution signs.
The strength of the US Dollar, as measured by the DXY, is a significant factor. Currently trading at 99.51 and showing a 0.22% daily gain, the dollar index is pushing higher, which typically exerts downward pressure on USDJPY. This correlation is a well-established dynamic in the forex markets. A rising DXY often means that the yen, being a major currency and a safe-haven asset, weakens against the dollar. The DXY’s technicals are also mixed, with a strong daily uptrend (ADX 31.51) but conflicting signals from its RSI and Stochastic oscillators on shorter timeframes. This suggests that while the dollar has momentum, it might face some headwinds or consolidation ahead.
Navigating the Yen's Tightrope
The Japanese Yen's performance is often dictated by two primary forces: the Bank of Japan's (BoJ) ultra-loose monetary policy and the constant threat of currency intervention by Japanese authorities. With interest rates in Japan remaining near zero while other major central banks have tightened policy, the yield differential between Japan and other major economies remains significant. This widening gap historically favors a weaker yen, as investors seek higher yields elsewhere. However, the rapid depreciation of the yen has put it on a precarious footing, with market participants keenly watching for any signs of official action to stem the slide.
The current price of USDJPY at $159.504 is approaching levels that have previously prompted verbal warnings from Japanese officials. While no direct intervention has occurred recently, the mere possibility can create significant volatility. Traders are therefore caught between the strong dollar trend, which pushes USDJPY higher, and the potential for a sudden shift in sentiment should Japanese authorities decide to step into the market to support the yen. The 1H chart shows a MACD with negative momentum, and Stochastic K lines are below D lines, suggesting a short-term pullback might be in play, even as the overall daily trend remains bullish.
Technical Crossroads: What the Charts Are Saying
Looking at the technical indicators across different timeframes provides a nuanced picture. On the 1-hour chart, USDJPY shows a general SAT signal (6 sell, 2 buy, 1 neutral), driven by indicators like RSI at 33.89, which is in oversold territory, and a MACD with negative momentum. The Stochastic Oscillator (K=8, D=25.1) also indicates oversold conditions, suggesting a potential short-term bounce. However, the ADX at 16.46 points to a weak trend, indicating a lack of conviction in any immediate move.
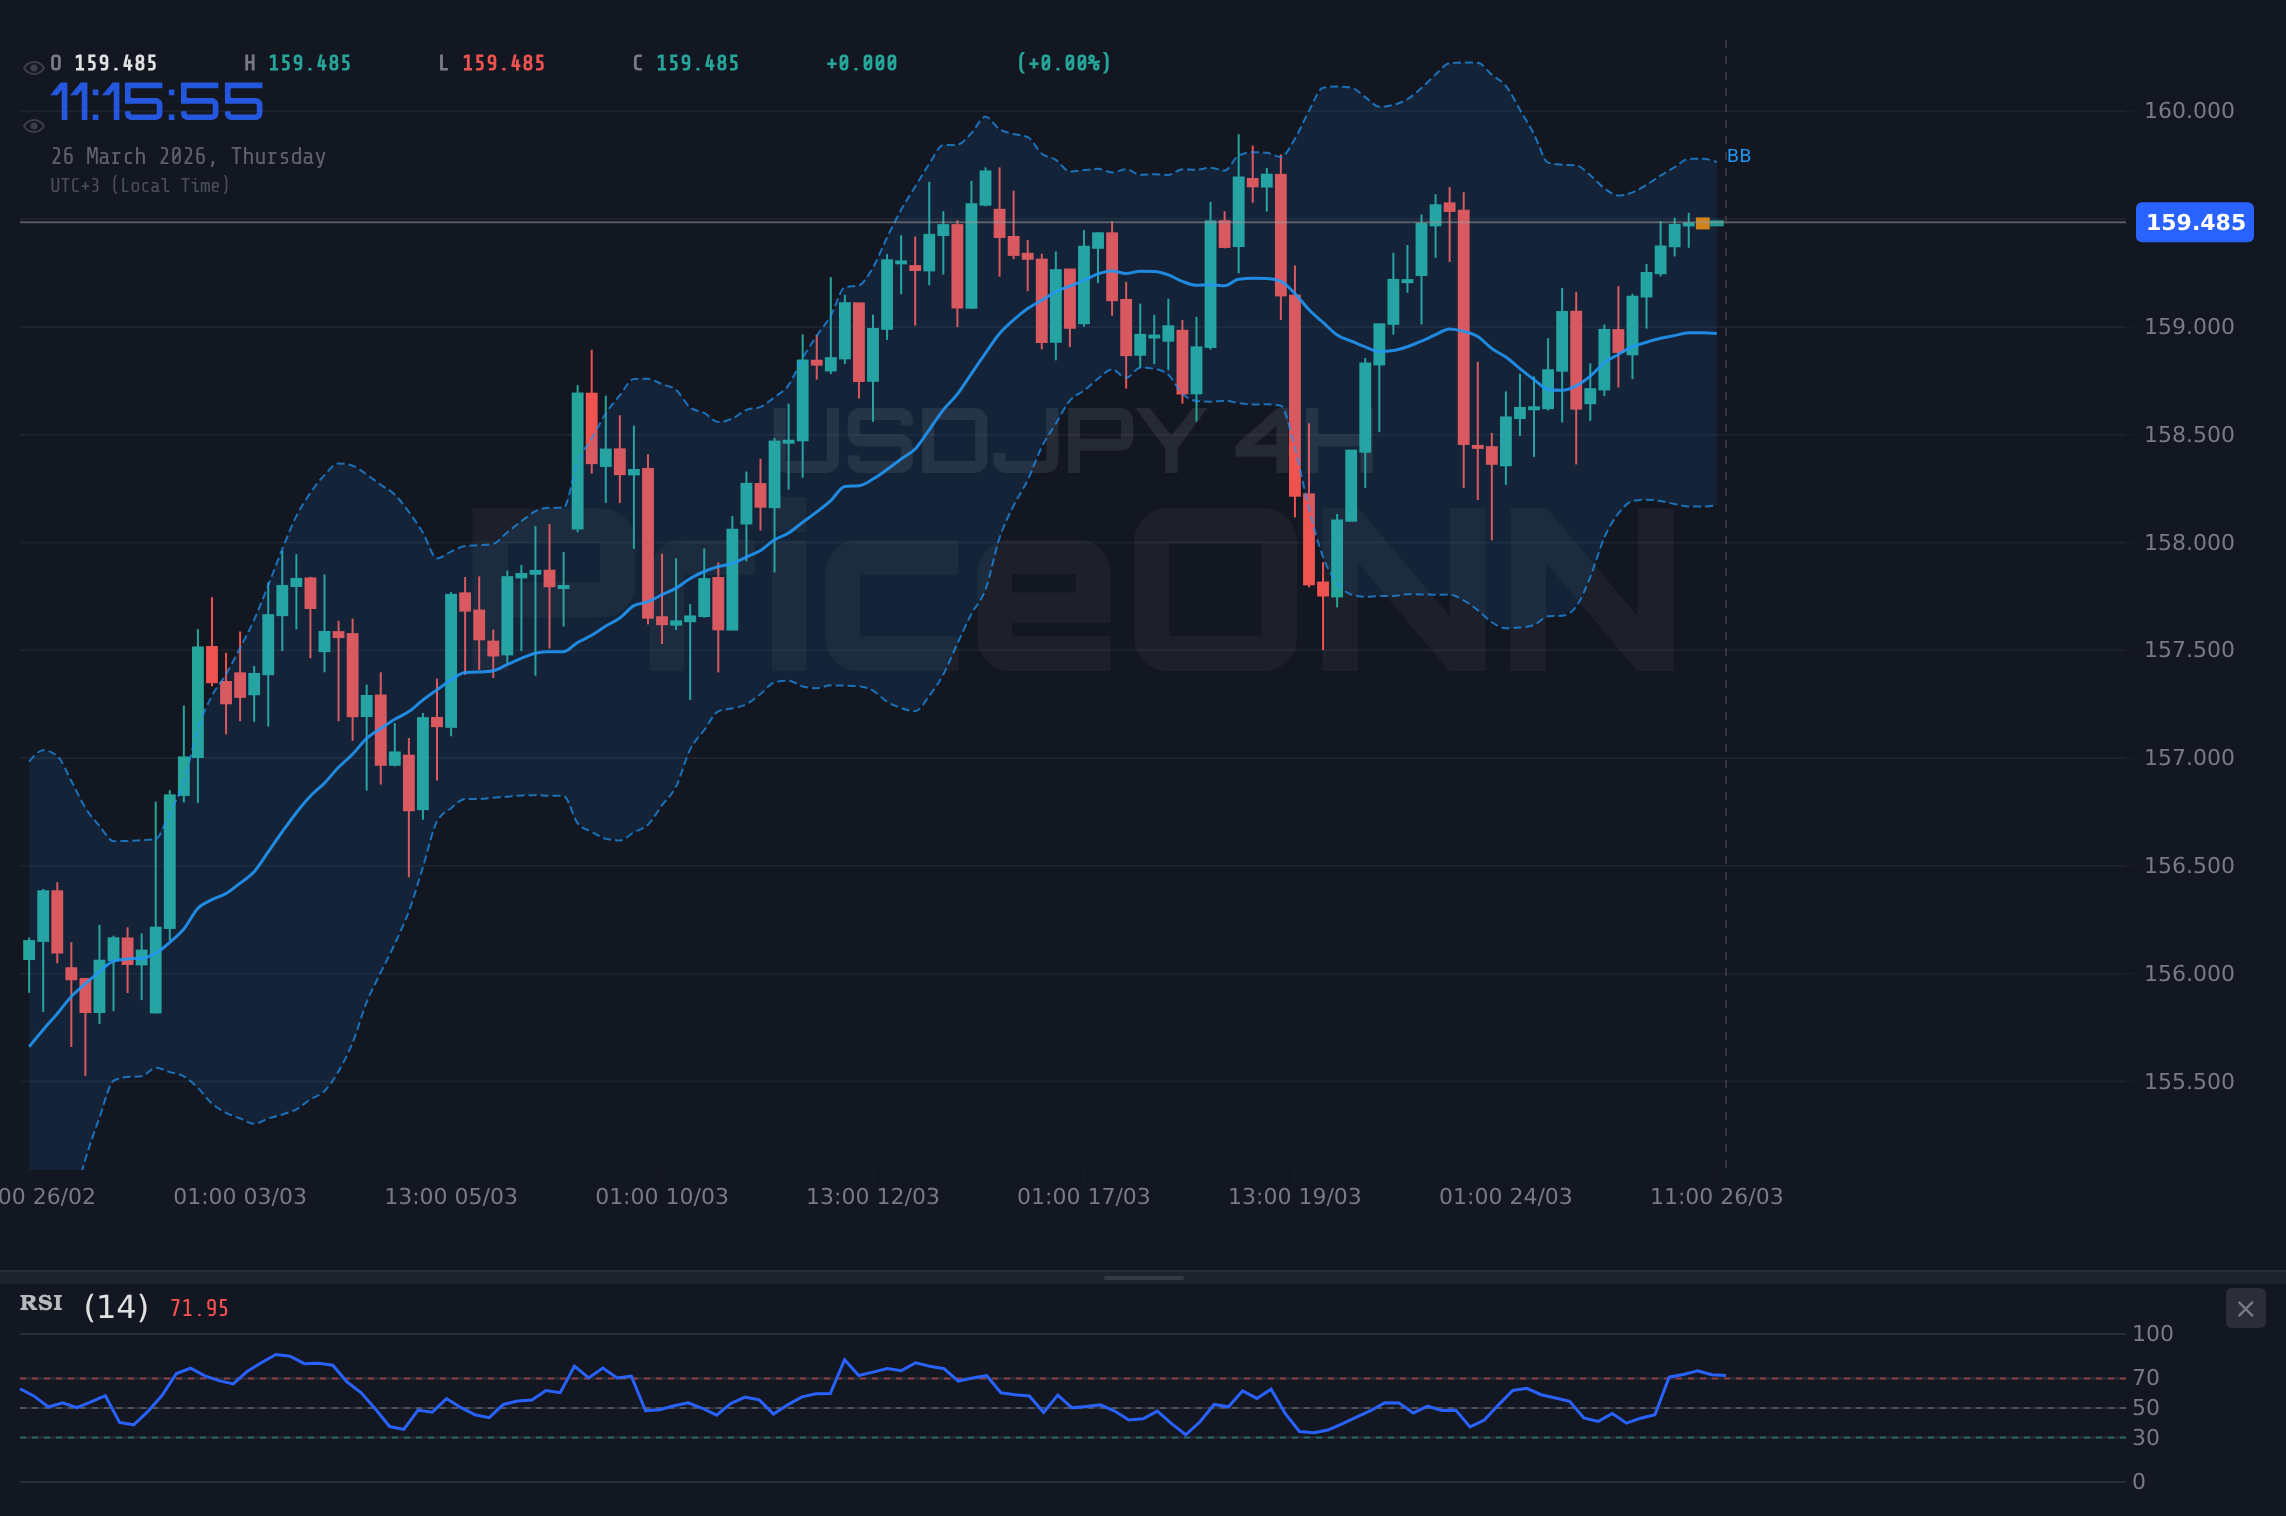
The 4-hour timeframe presents a slightly different view, with a mix of signals (2 buy, 6 sell, 0 neutral). The RSI is at 46.16, neutral, while the MACD shows positive momentum. The Stochastic Oscillator (K=56.23, D=74.18) is giving a bearish signal with the K line crossing below the D line. The ADX at 15.49 again suggests a weak trend. This mixed picture across the shorter timeframes implies that the market is indecisive, awaiting a clearer catalyst or confirmation of a sustained move.
On the daily chart, the trend is classified as neutral with a 50% strength, yet the overall signal leans towards SAT (2 buy, 6 sell, 0 neutral). The daily RSI at 48.43 is neutral, hovering below the 50 mark. The MACD has negative momentum, and the Bollinger Bands are below the middle band, suggesting a bearish bias. However, the Stochastic Oscillator (K=37.07, D=27.64) is showing a bullish crossover, with the K line moving above the D line, hinting at a potential upward correction. The ADX at 16.6 indicates a weak trend. This conflict between MACD and Stochastic on the daily chart is crucial; it suggests that while bearish momentum is present, there's a possibility of a reversal or at least a bounce from current levels if key support holds.
The Role of Geopolitics and Inflation
Escalating geopolitical tensions, particularly in the Middle East, are adding another layer of complexity. Such events often increase global uncertainty, which can boost demand for safe-haven assets like the Japanese Yen. However, the current market narrative seems to be dominated by the strength of the US dollar and the prospect of continued yield differentials, overshadowing the yen's traditional safe-haven appeal. Furthermore, rising oil prices, as seen with Brent Crude at $103.54 and WTI at $93.40, can fuel inflation concerns globally. While this might typically lead central banks to adopt a more hawkish stance, the BoJ’s commitment to ultra-loose policy creates a unique dynamic for USDJPY.
The recent news regarding Middle East tensions affecting Australia’s economy and AUD suggests a broader risk-off sentiment might be brewing. If this risk-off sentiment intensifies, it could theoretically support the yen. However, the price action in USDJPY has so far defied this logic, demonstrating the dominant influence of the dollar’s strength and yield differentials. The fact that USD/CAD is climbing to two-month highs and NZD/USD is hovering near 0.5800 also points to a general strengthening of the US dollar against other major currencies, reinforcing the pressure on USDJPY.
Trade Scenarios: Navigating the $159.50 Zone
Given the conflicting signals and the critical resistance at $159.50, a cautious approach is warranted. The market is at a crossroads, and the next move could be significant. A sustained break above the $159.50 level, confirmed by strong volume and bullish momentum across multiple timeframes, could signal a continuation of the uptrend. Conversely, a rejection from this resistance, coupled with signs of dollar weakness or yen support, could lead to a pullback towards key support levels.
The current setup for USDJPY presents a classic 'Watch Zone' scenario rather than a clear trade signal. The ADX reading of 13.73 on the 4H chart indicates a weak trend, meaning the market is choppy and prone to false breakouts. The Stochastic oscillator is in the tradeable zone, not yet at extreme overbought or oversold levels on the daily, but showing bearish signals on shorter timeframes. This suggests patience is key. A valid setup would likely require a clear break above the $159.50 resistance with confirmation, or a decisive rejection and subsequent retest of key support levels like $159.186 on the 4H chart.
Bearish Scenario: Rejection at Resistance
65% ProbabilityNeutral Scenario: Consolidation Around $159.50
25% ProbabilityBullish Scenario: Breakout Above Resistance
10% Probability| Indicator | Value | Signal | Interpretation |
|---|---|---|---|
| RSI (14) | 48.43 | Neutral | Hovering below 50, suggesting slight bearish bias on daily. |
| MACD Histogram | -0.29 | Bearish | Negative momentum on daily chart. |
| Stochastic | K:37.07, D:27.64 | Bullish Crossover | Bullish signal on daily, but needs confirmation. |
| ADX | 16.60 | Weak Trend | Lack of strong trend, market is choppy. |
Frequently Asked Questions: USDJPY Analysis
What happens if USDJPY breaks above the $159.723 resistance level?
A decisive break and daily close above $159.723, especially if accompanied by strong volume and a weakening DXY, would invalidate the bearish scenario. This could open the door for further upside towards the $160.070 daily resistance and potentially higher levels around $160.648.
Should I trade USDJPY around the $159.50 level given the mixed signals?
Trading directly at $159.50 is risky due to the conflicting indicators and weak trend signals. The probability of a bearish scenario (65%) suggests caution. Waiting for a clear breakout above resistance or a confirmed rejection and pullback towards support at $159.186 would offer a more defined risk/reward setup.
Is the Stochastic bullish crossover on the daily chart a reliable buy signal for USDJPY?
While the daily Stochastic showing a bullish crossover (K:37.07, D:27.64) is a positive sign, it contradicts the negative MACD momentum and the overall weak trend indicated by the ADX. This bullish signal needs confirmation from price action and other indicators before being considered reliable for a sustained move higher.
How will escalating Middle East tensions impact USDJPY in the short term?
Geopolitical tensions typically increase demand for safe havens like the yen. However, USDJPY's current upward trend, driven by dollar strength and yield differentials, suggests this safe-haven effect might be muted. If tensions significantly escalate, it could lead to increased volatility, potentially triggering intervention if the yen weakens too rapidly.
The current juncture for USDJPY near $159.50 is a critical test of both technical levels and market sentiment. While the dollar's strength and yield differentials are powerful drivers pushing the pair higher, the ever-present threat of Japanese intervention and the yen’s safe-haven status cannot be ignored. Traders must remain vigilant, paying close attention to price action around current resistance and support levels, as well as any official commentary or shifts in global risk appetite. Patience and disciplined risk management will be paramount in navigating this potentially volatile environment. The market is signaling caution, and only through careful observation and adherence to a well-defined plan can traders hope to find opportunities in this complex interplay of forces.
Track markets in real-time
AI-powered analysis, technical indicators and real-time price data.
Join Our Telegram Channel
Breaking market news, AI analysis and trading signals instantly.
Join Channel