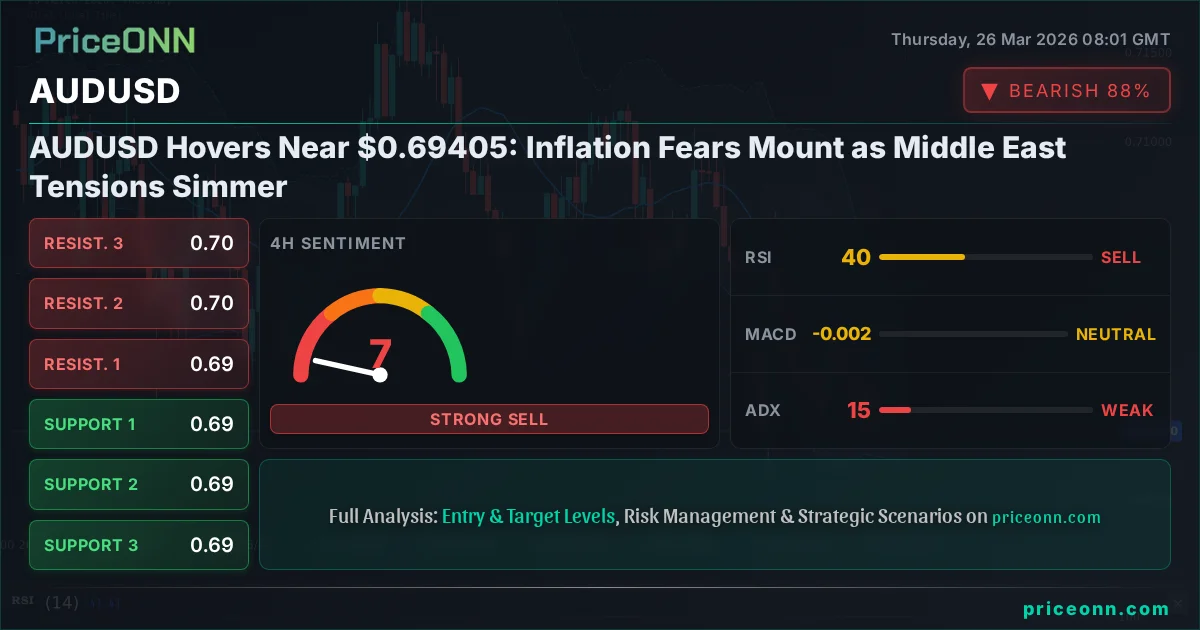
AUDUSD Hovers Near $0.69405: Inflation Fears Mount as Middle East Tensions Simmer
AUDUSD trades near $0.69405 amid escalating geopolitical risks and rising inflation concerns. Technicals show a weak trend, with support at $0.69338 and resistance at $0.69656.
The delicate balance of the Australian Dollar against the US Dollar is being tested once again, with AUDUSD hovering precariously near the $0.69405 mark. This isn't just another day of forex trading; it's a snapshot of global anxieties playing out in real-time. Escalating geopolitical tensions in the Middle East, a volatile cocktail of rising oil prices and renewed inflation fears, are casting a long shadow over risk-sensitive assets like the Aussie. While the daily charts paint a picture of a market holding its breath, the underlying currents suggest a significant push and pull between safe-haven demand for the US Dollar and the persistent inflationary pressures that could force the Reserve Bank of Australia's hand. This analysis dives deep into the technicals and fundamentals shaping AUDUSD's immediate future.
- AUDUSD is currently trading at $0.69405, with key support at $0.69338 and resistance at $0.69656 on the hourly chart.
- The ADX reading of 15.18 on the 4-hour chart indicates a choppy, ranging market, suggesting caution is warranted for aggressive trades.
- Rising Middle East tensions are sparking inflation fears for Australia, potentially impacting RBA policy and AUDUSD's trajectory.
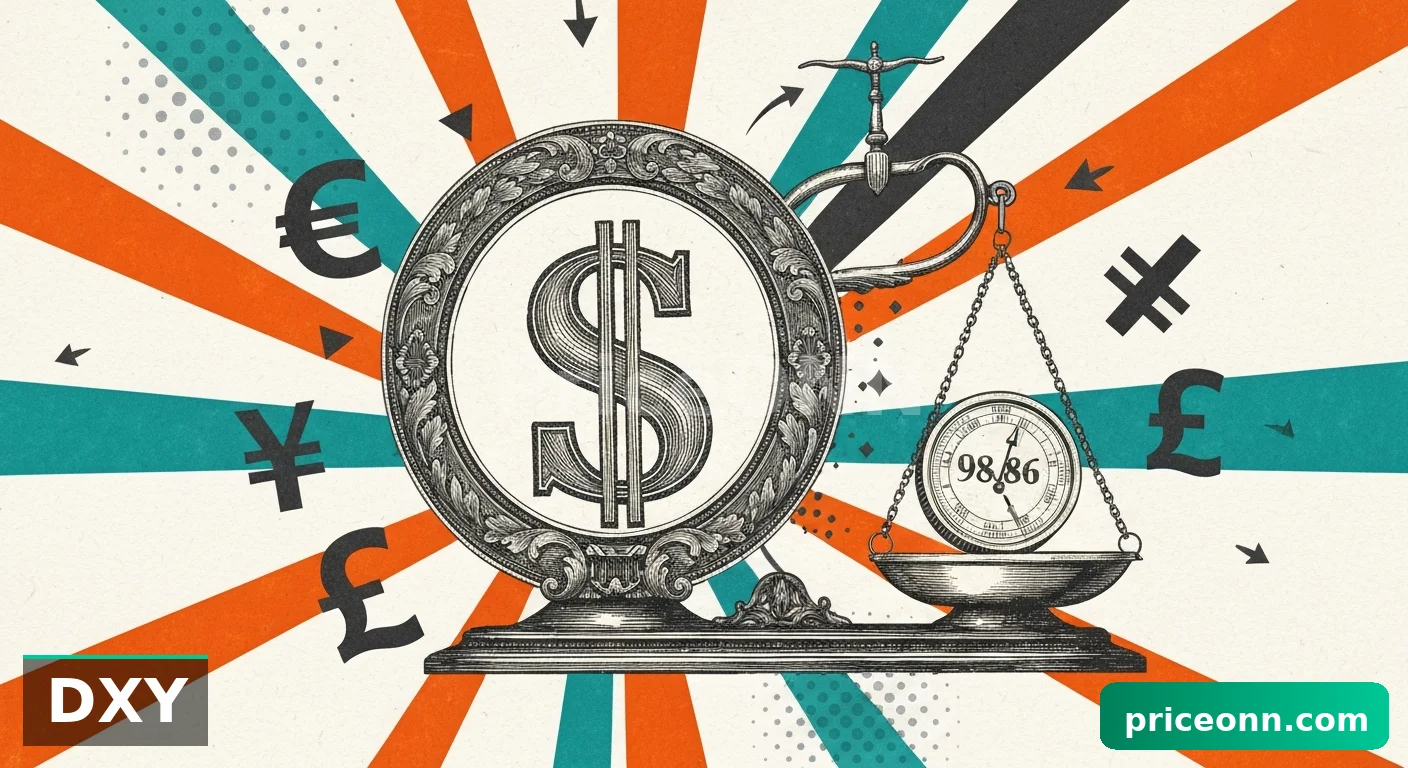
- The US Dollar Index (DXY) is firming around 99.49, exerting downward pressure on AUDUSD as global risk appetite wavers.
The narrative driving AUDUSD right now is a complex interplay of global risk sentiment and domestic economic pressures. On the global stage, the escalating conflict in the Middle East has sent shockwaves through energy markets, with Brent crude oil rallying towards $103.48. This surge in oil prices isn't just a headline; it's a direct contributor to rising inflation expectations worldwide. For Australia, heavily reliant on commodity exports and sensitive to global demand, this presents a dual threat: potentially higher export revenues but also increased import costs and a broader inflationary impulse. The latest economic calendar shows mixed data, with some US manufacturing figures (like the ISM Manufacturing PMI at 52.4) beating expectations, while others suggest a cooling economy. This divergence creates uncertainty and fuels demand for the safe-haven US Dollar, currently trading around 99.49 on the DXY index.
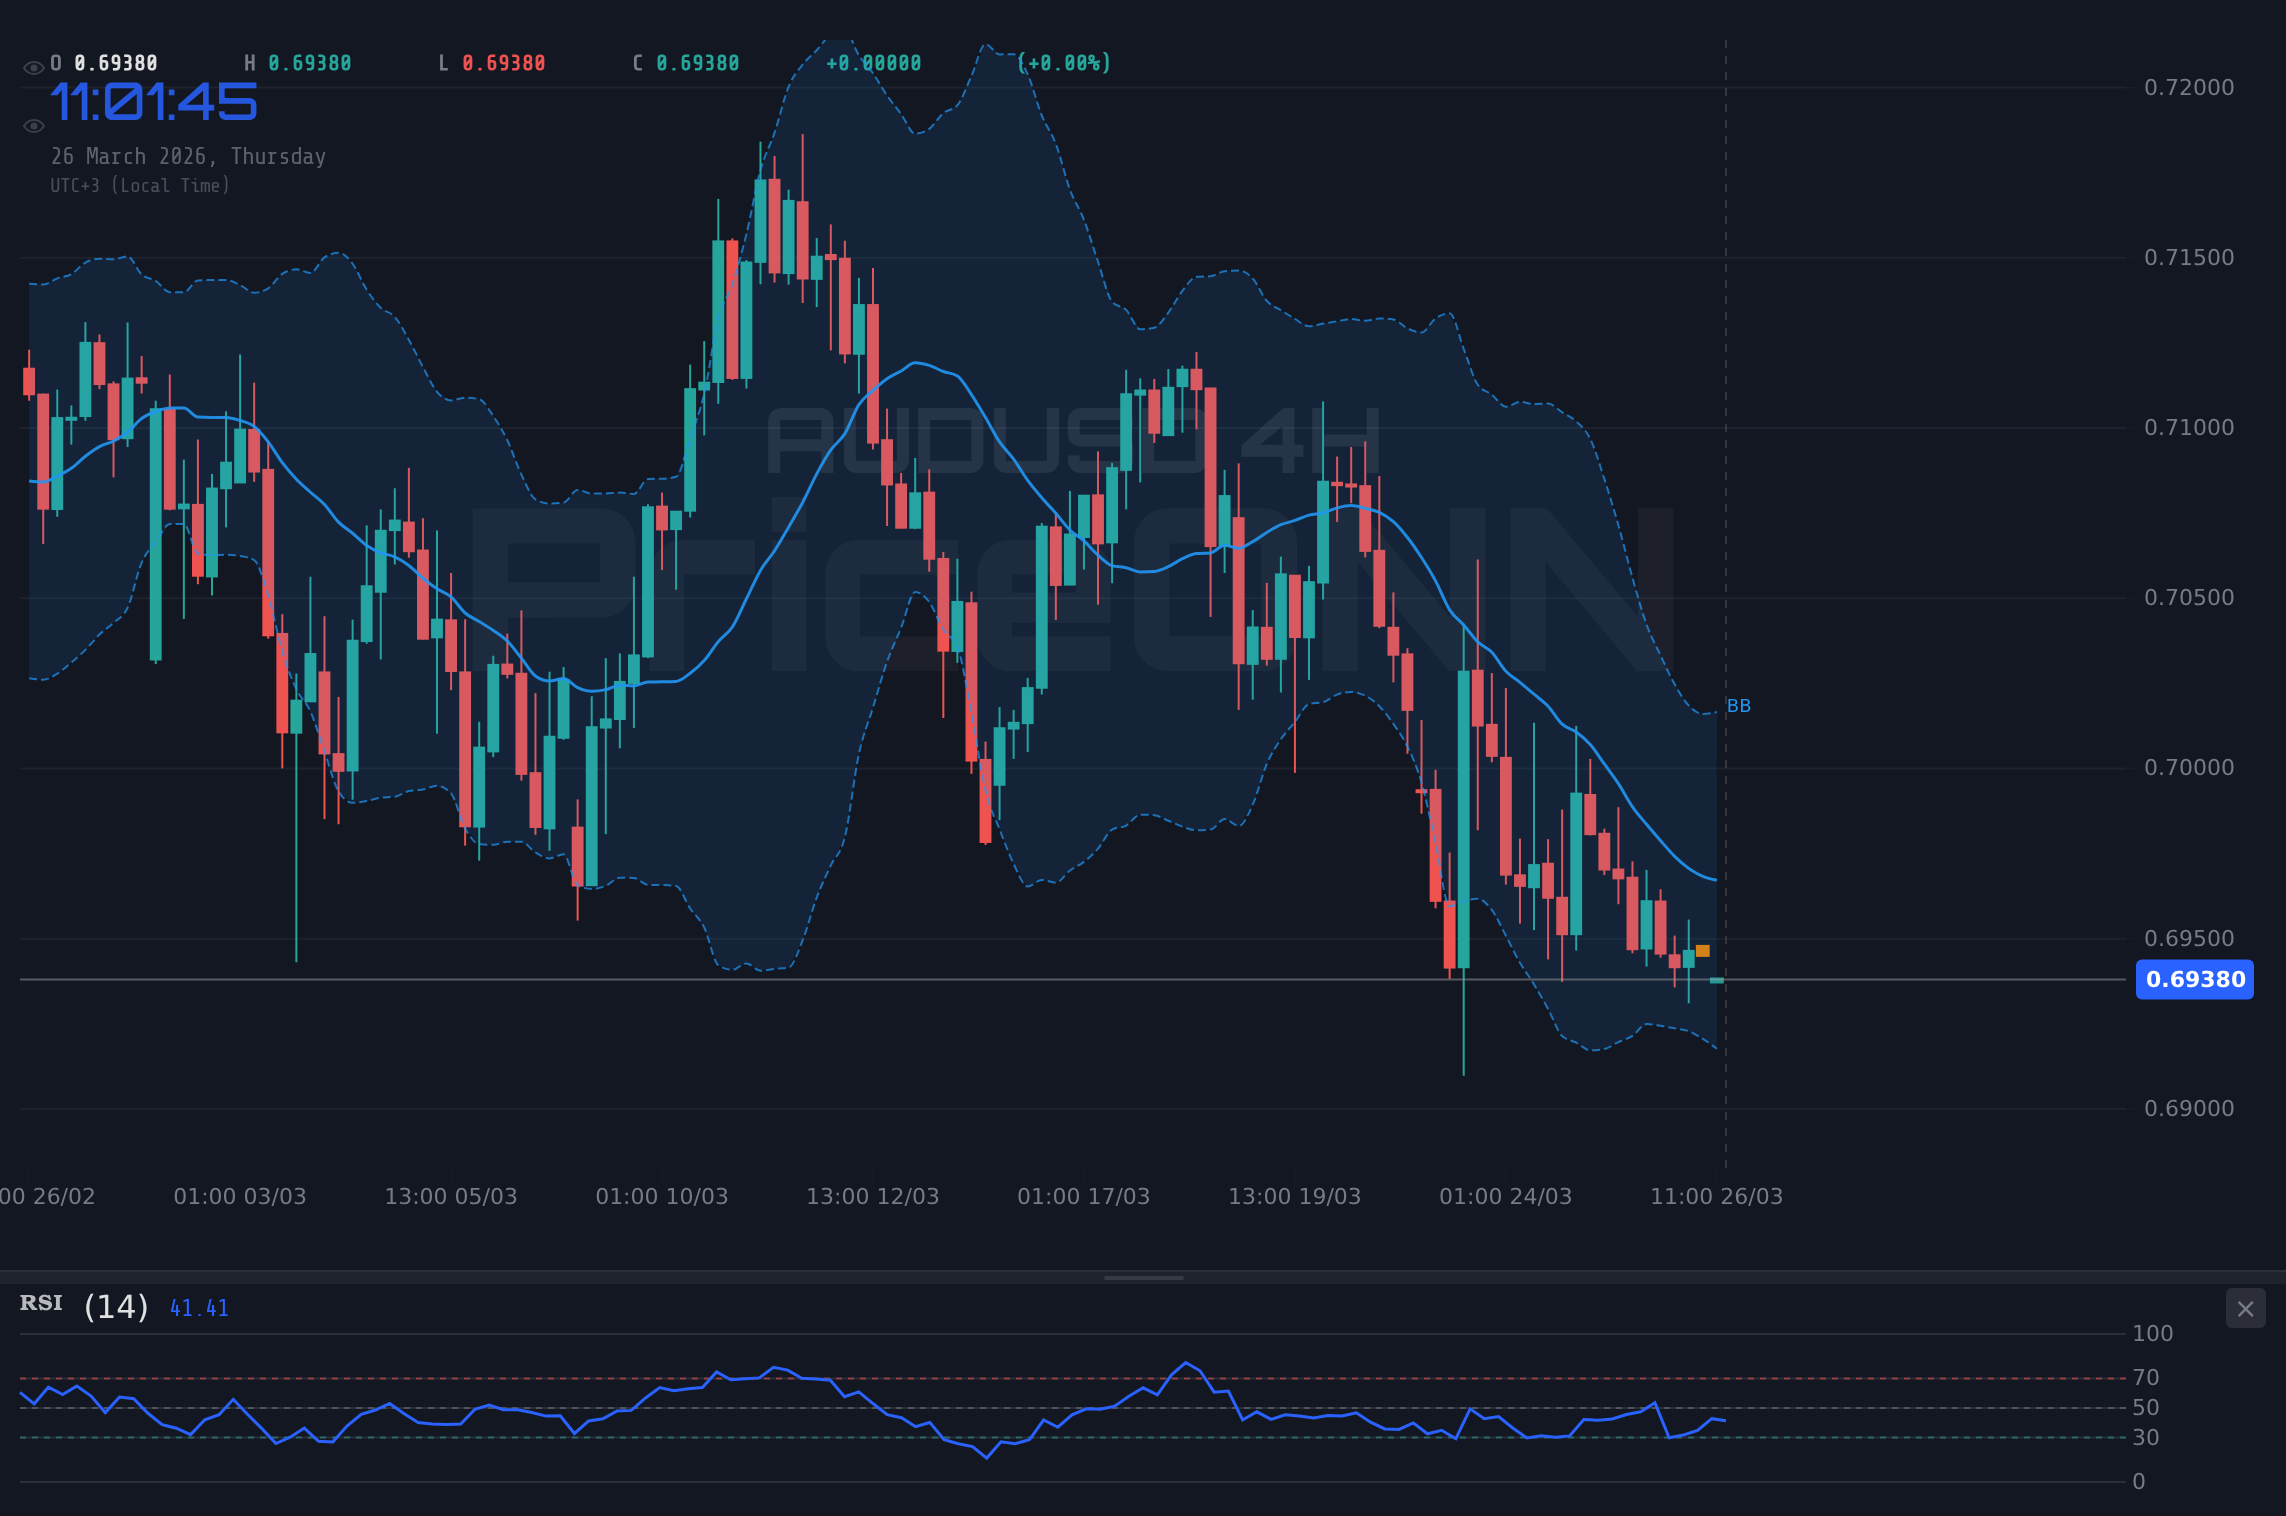
Technically, the AUDUSD pair is exhibiting signs of consolidation, a common occurrence when conflicting fundamental forces are at play. On the 1-hour chart, the trend is firmly bearish (90% strength), with the price hugging the lower Bollinger band and RSI hovering at a neutral-to-bearish 40.77. The MACD is showing negative momentum, reinforcing the short-term downward pressure. However, the broader picture across the 4-hour and daily timeframes reveals a more neutral stance, with ADX readings hovering around 15.18 and 22.85 respectively. These low ADX values signal a lack of strong directional conviction, indicating a ranging or choppy market. This is crucial for traders; it suggests that while short-term dips might occur, a sustained breakout in either direction requires stronger conviction and potentially a clear catalyst. The Stochastic oscillator on the daily chart is showing a bullish crossover (K=21.77, D=33.47), but it remains in oversold territory, hinting at potential for a bounce rather than a sustained rally.
The market's reaction to geopolitical events is often swift and decisive, and the current situation in the Middle East is no exception. Reports indicate that the conflict has already impacted 20% of global LNG trade, creating supply deficits that directly influence commodity prices. For Australia, a major commodity exporter, this could translate into higher export earnings but also poses a risk of imported inflation. The Reserve Bank of Australia (RBA) is caught in a difficult position. While inflation is a concern, the strength of the US Dollar and the potential for a global economic slowdown could temper the need for aggressive rate hikes. The market is closely watching the RBA's forward guidance, with any hint of a more hawkish stance likely to support the Australian Dollar. However, for now, the immediate focus remains on the immediate risks and the safe-haven appeal of the greenback.
On the hourly chart, AUDUSD is finding some footing near the $0.69338 support level, a critical area that has seen some buying interest emerge. However, this support is fragile, given the overall bearish sentiment on this timeframe. The RSI at 40.77 suggests there's room for further downside before reaching oversold territory, and the MACD’s negative momentum reinforces this view. The Stochastic oscillator, with K=57.86 and D=55.54 on the 1-hour chart, shows a bullish signal but is not yet in extreme territory, suggesting that any bounce might be short-lived. The key takeaway here is the lack of strong directional trend. The ADX at 17.25 on the 1-hour chart reinforces this, indicating that the current price action is more about consolidation than a clear trend. This environment is challenging for trend-following strategies and favors range-bound trading or waiting for a decisive breakout.
The correlation between AUDUSD and the US Dollar Index (DXY) remains a critical factor. With the DXY firming up and trading around 99.49, it's acting as a headwind for the Aussie. A stronger dollar generally makes Australian exports more expensive and can put pressure on commodity prices, although the current geopolitical backdrop is creating some unusual dynamics in the energy market. We're seeing WTI crude oil rally towards $93.34, driven by supply concerns stemming from the Middle East. This could provide some underlying support for the Australian Dollar, given its commodity-linked nature, but the DXY's strength is currently the dominant force. The interplay between these two assets is crucial to monitor; any significant move in the DXY will likely be mirrored, albeit with a different magnitude, in AUDUSD.
Looking at the 4-hour timeframe, the picture becomes even more nuanced. The trend is classified as bearish (88% strength), but the ADX at 29.95 suggests a strong trend is present, which seems to contradict the choppy price action observed. This discrepancy often occurs when a strong trend is losing momentum or consolidating before a potential reversal. The RSI at 40.19 reinforces the bearish bias, while the Stochastic K=12.54, D=24.89 suggests further downside potential, though it's approaching oversold conditions. The MACD is showing negative momentum, aligning with the bearish sentiment. The key resistance level to watch on this timeframe is $0.69656, while support lies around $0.69194. A break decisively above $0.69656 could signal a shift, but given the current market structure, it would require significant fundamental impetus.
The rising inflation fears, directly linked to the Middle East conflict, are a significant wildcard for the RBA. While the central bank has been cautious about further rate hikes, persistent inflation could force their hand. The latest US economic data, such as the ISM Manufacturing PMI at 52.4, suggests some resilience in the US economy, which could embolden the Federal Reserve to maintain a hawkish stance, further strengthening the dollar. Conversely, if global growth concerns intensify due to the geopolitical situation, central banks might pivot towards a more accommodative stance. This creates a complex environment for AUDUSD, where conflicting signals abound. The market is pricing in a certain level of RBA action, but any deviation from expectations could trigger significant volatility.
On the daily chart, the overall trend is considered neutral (50% strength), but the ADX at 22.85 indicates a moderate trend is in play, albeit with a bearish leaning. The RSI is sitting at 42.31, suggesting room for further decline before hitting oversold levels. The MACD is showing negative momentum, and the Stochastic K=21.77, D=33.47 has just crossed bullishly but remains in oversold territory. This suggests that while the bearish momentum is strong, there's a potential for a short-term bounce. The critical support on the daily chart is $0.69024, and a break below this level would likely trigger further selling pressure, targeting $0.6863. On the upside, resistance is seen at $0.70244, and a sustained move above this level would be needed to invalidate the current bearish bias.
The concept of 'aud usd 0.7200 target' has been a talking point, but current market conditions make such levels seem distant. The fundamentals driving AUDUSD are currently tilted towards a weaker Aussie: a strengthening dollar, rising global inflation risk, and a cautious RBA. The technical picture, while showing some oversold conditions on longer timeframes, is dominated by bearish signals on the shorter timeframes and a lack of strong directional trend on the daily. For any significant upside move towards $0.7200, we would need to see a clear shift in RBA policy, a de-escalation of Middle East tensions, and a weakening of the US Dollar. Until then, the focus remains on immediate support and resistance levels.
The 'audusd fundamentals' are currently a mixed bag, leaning towards caution. While Australia benefits from high commodity prices, the global economic outlook is clouded by geopolitical risks and persistent inflation. The RBA's next move will be crucial. If they signal a pause or a pivot towards easing due to global slowdown fears, the AUD could weaken further. Conversely, if inflation remains stubbornly high and requires further tightening, it could provide some support. However, the current strength of the DXY and the risk-off sentiment are powerful counterforces. The market is essentially waiting for a clearer signal from either the RBA, the Fed, or the geopolitical front before committing to a significant directional move.
Bearish Scenario: Downside Pressure Mounts
65% ProbabilityNeutral Scenario: Choppy Range Continues
25% ProbabilityBullish Scenario: Bounce from Support
10% ProbabilityThe confluence of technical signals and fundamental pressures paints a cautious picture for AUDUSD. While the daily chart shows some oversold conditions and the potential for a bounce, the prevailing bearish sentiment on shorter timeframes and the strength of the US Dollar suggest that downside risks remain elevated. The market is in a holding pattern, awaiting clearer direction from geopolitical developments and central bank policy signals. Traders should exercise caution, respect key support and resistance levels, and look for confirmation before committing to any significant positions. Patience is key in this environment; waiting for a clearer setup with stronger directional conviction will likely yield better risk-reward opportunities.
Frequently Asked Questions: AUDUSD Analysis
What happens if AUDUSD breaks below the $0.69194 support level?
A break below the $0.69194 support level on the 4-hour chart would likely invalidate the neutral bias and confirm a bearish continuation. This could trigger further selling pressure, with the next significant target being the daily support at $0.69024.
Should I buy AUDUSD at current levels near $0.69405 given the oversold Stochastic on the daily chart?
Buying at current levels near $0.69405 carries risk due to bearish hourly signals and a choppy market indicated by low ADX readings. While the daily Stochastic shows a bullish crossover, it's in oversold territory, suggesting a potential bounce rather than a strong rally. Confirmation above the $0.69656 resistance would be needed for a more confident bullish setup.
Is the RSI at 40.77 a strong sell signal for AUDUSD right now?
An RSI reading of 40.77 on the hourly chart indicates bearish momentum but is not yet in oversold territory. It suggests that there is room for further downside pressure before significant buying interest emerges. However, it's not a standalone sell signal; it should be considered alongside other indicators and price action.
How will the escalating Middle East tensions affect AUDUSD this week?
Escalating Middle East tensions are increasing global inflation fears and boosting demand for the US Dollar as a safe-haven asset. This dynamic puts downward pressure on AUDUSD. If tensions worsen, it could also lead to higher commodity prices, which might offer some support to the Aussie, but the DXY's strength is currently the dominant factor.
Track markets in real-time
AI-powered analysis, technical indicators and real-time price data.
Join Our Telegram Channel
Breaking market news, AI analysis and trading signals instantly.
Join Channel