XAUUSD Tests $4,450.67 Support Amidst Heightened Geopolitical Tensions
Gold prices are consolidating just below $4,450.67 as Middle East tensions escalate. Technical indicators show mixed signals, demanding caution.
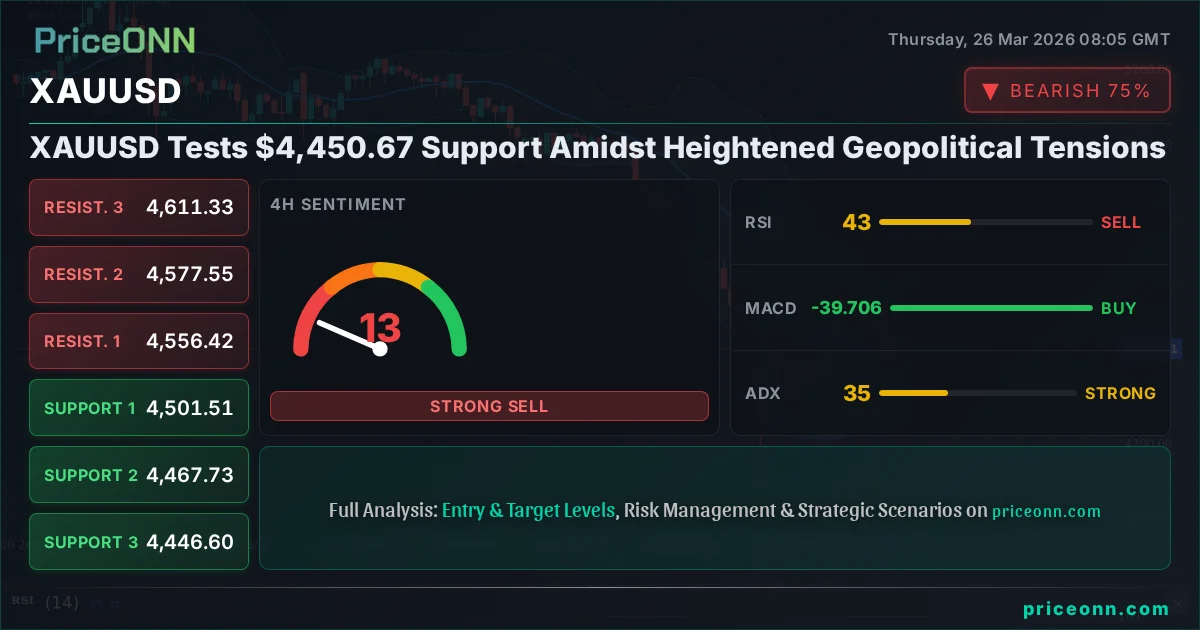
Gold, the perennial safe haven, is currently finding itself at a critical juncture, trading at precisely $4,450.67. This level is more than just a number; it represents a confluence of technical support and a market grappling with escalating geopolitical anxieties. The recent pullback in gold prices, reflected in a daily change of -1.23%, has brought the precious metal to a point where its next move could be pivotal. While the price action suggests a degree of caution, the underlying currents of global instability continue to provide a floor, preventing a steeper decline. The market is at a delicate balance, with traders and investors alike scrutinizing every tick and every headline for clues about the path forward. This analysis delves into the technical landscape, explores the correlation with broader market indicators like the DXY and equities, and assesses the potential scenarios that could unfold in the coming days, all while keeping the exact price of $4,450.67 firmly in focus.
- RSI at 38.57 on the 1H chart signals neutral momentum with a slight downward bias, indicating a lack of strong conviction.
- Critical support for XAUUSD is identified at $4,428.13 on the 1-hour timeframe, with further levels at $4,399.99 and $4,384.4.
- The ADX reading of 23.62 on the 1H chart suggests a moderate downtrend, while the daily ADX at 29.17 points to a stronger trend in play.
- With the DXY at 99.53 and trending higher, this presents a headwind for gold prices, reinforcing the inverse correlation.
Navigating the Golden Crossroad: Technical Indicators in Focus
The technical tapestry for XAUUSD is currently woven with threads of indecision and cautious optimism, painted across multiple timeframes. On the 1-hour chart, the Relative Strength Index (RSI) hovers at 38.57. While this is technically in the neutral zone, it leans towards a bearish sentiment, suggesting that the momentum behind the recent decline is still present, albeit not overwhelmingly strong. Coupled with this, the Moving Average Convergence Divergence (MACD) shows negative momentum, with the MACD line sitting below its signal line, further reinforcing the immediate bearish undertones on this short-term view. The Stochastic Oscillator, with its K line at 19.7 and D line at 35.2, unequivocally points to oversold conditions and a potential for a short-term bounce, yet the overall trend strength indicated by the Average Directional Index (ADX) at 23.62 suggests that any such bounce might lack significant follow-through in the absence of a stronger trend commitment. This nuanced picture on the hourly chart demands careful observation, as it could precede a more significant directional move.
Shifting to the 4-hour timeframe, the technical indicators begin to present a slightly more complex, almost conflicting, narrative. The RSI here sits at 42.45, still in neutral territory but showing a slightly less bearish inclination than its hourly counterpart. The MACD, however, flips the script, displaying positive momentum with the MACD line above its signal line, hinting at underlying buying pressure that might not be immediately apparent on the hourly chart. The Bollinger Bands, which often serve as a measure of volatility and trend, are showing the price below the middle band, suggesting a bearish tendency in the short to medium term. Yet, the Stochastic Oscillator's K line at 54.42 and D line at 75.28, while indicating a potential for a pullback, also suggests that the asset is not currently in extreme overbought or oversold territory on this timeframe. The ADX reading of 34.86 here is particularly noteworthy; it signifies a strong trend is in play, and given the other indicators, it leans towards a strong downtrend, creating a divergence with the MACD's positive momentum signal. This conflict between MACD and the stronger ADX/Bollinger signals on the 4-hour chart highlights the current market's ambiguity.
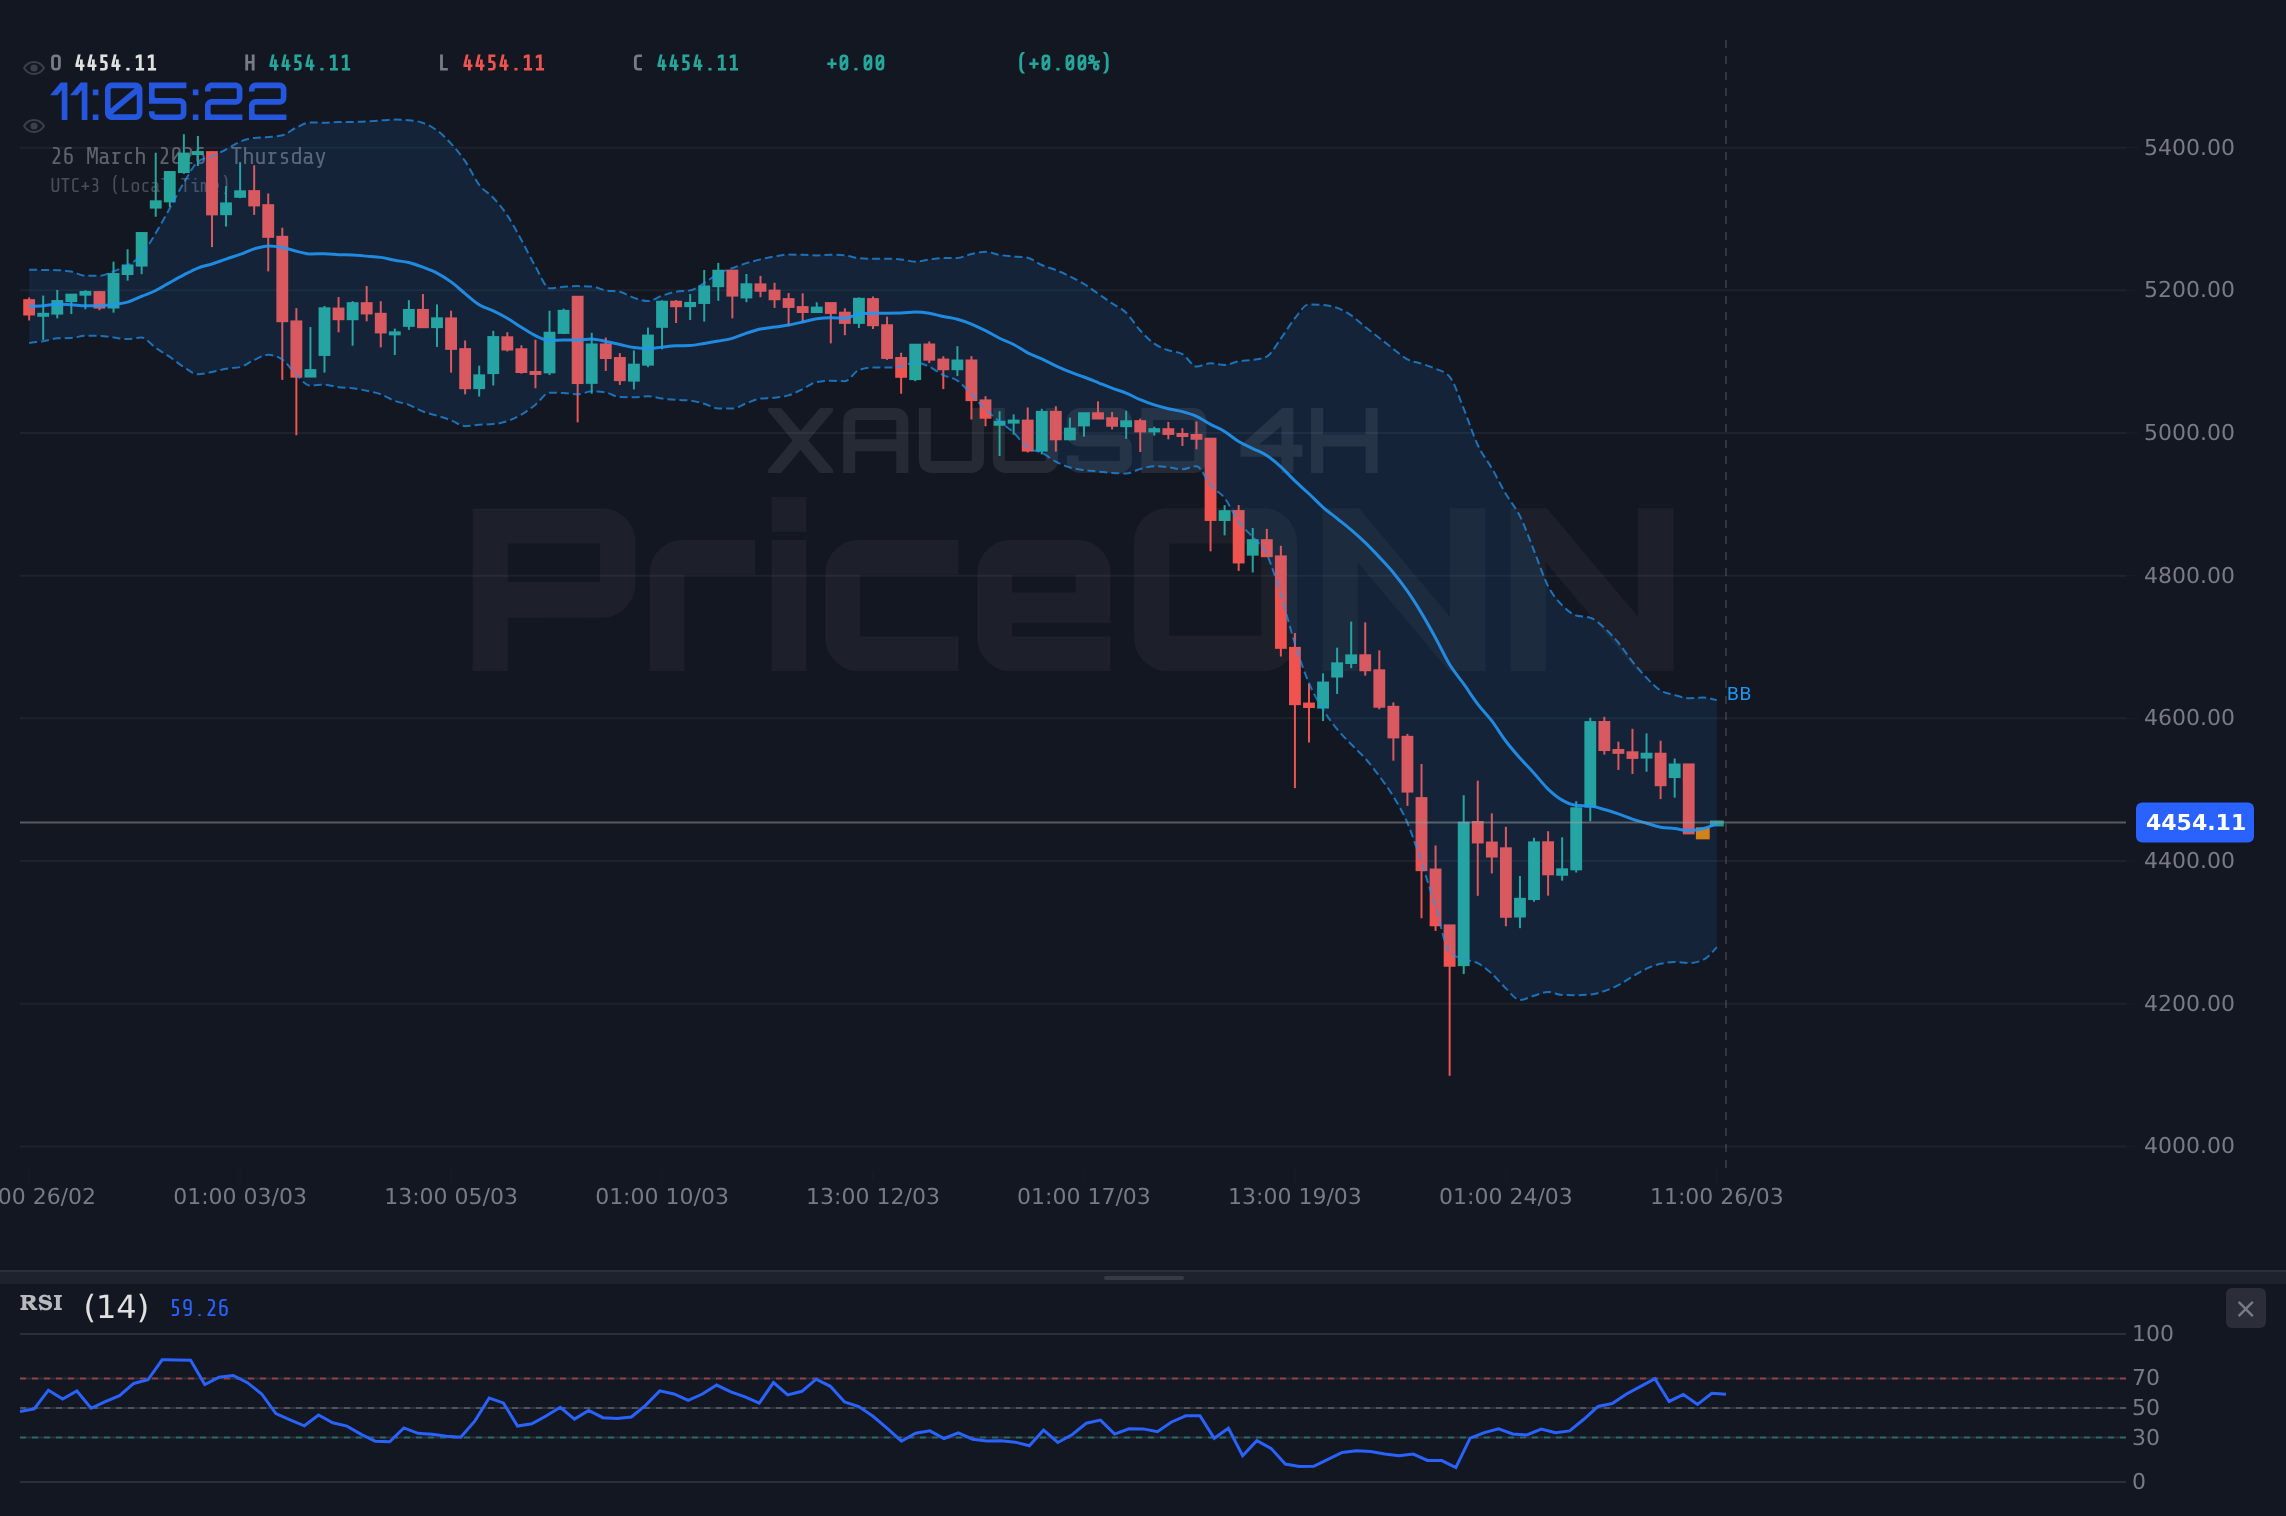
The daily chart, often considered the most reliable for long-term trend identification, paints a clearer, albeit bearish, picture. The RSI(14) at 31.67 is firmly in the oversold territory, a level that historically has preceded significant price reversals or at least a pause in the downtrend. This is a classic signal that sellers might be exhausted. However, the MACD indicator on the daily chart mirrors the hourly's sentiment, showing negative momentum with the MACD line below its signal line, suggesting that the downtrend might still have legs. The Bollinger Bands are also situated below the middle band, confirming the bearish pressure on the daily scale. Curiously, the Stochastic Oscillator on the daily chart presents a bullish divergence, with the K line (37.04) crossing above the D line (21.61), indicating a potential upward reversal. The ADX at 29.17 reinforces the presence of a strong trend, and in conjunction with the RSI and Stochastic signals, it suggests that while the trend is down, the momentum for further downside might be waning, and a potential shift could be on the horizon. This daily outlook, while predominantly bearish, contains seeds of a potential recovery, making the $4,450.67 level all the more significant.
The Dollar's Shadow: DXY and Its Impact on Gold
Understanding the trajectory of gold is incomplete without acknowledging the powerful influence of the US Dollar Index (DXY). Currently standing at 99.53 and exhibiting a daily upward momentum of 0.23%, the DXY is acting as a significant headwind for gold prices. The inverse correlation between the dollar and gold is a well-established principle in financial markets; as the dollar strengthens, it becomes more expensive for holders of other currencies to purchase dollar-denominated assets like gold, thus reducing demand. The DXY's current uptrend, supported by positive momentum on the 1-hour and 4-hour charts and a strong trend identified by the daily ADX at 31.54, suggests that dollar strength is likely to persist in the near term. This persistent dollar strength puts additional pressure on gold, potentially exacerbating the current downward trend. Traders are closely watching the DXY's ability to maintain its upward trajectory, especially as it approaches resistance levels around 99.72. A decisive break above this level could signal further dollar appreciation and, consequently, increased pressure on gold prices, potentially pushing XAUUSD towards its next support levels. Conversely, any sign of weakness in the DXY could provide a much-needed reprieve for gold.
The 4-hour DXY chart presents a particularly interesting picture. While the RSI at 59.54 indicates a healthy bullish sentiment without being overly stretched, the Stochastic Oscillator is flashing a strong warning. With the K line at 95.74 and the D line at 73.46, the Stochastic is deep within overbought territory, suggesting that the dollar's rapid ascent might be due for a short-term correction. This divergence between the RSI's strength and the Stochastic's overbought condition could be a precursor to a dollar pullback. If the dollar does indeed correct, even temporarily, it could offer a window of opportunity for gold to find some footing. The ADX at 12.56 on this timeframe, however, points to a weak trend, suggesting that any potential dollar pullback might be more of a consolidation rather than a reversal, limiting the upside potential for gold even if the dollar weakens.
On the daily timeframe, the DXY's trend is decidedly bullish, with an ADX reading of 31.54 confirming a strong upward trend. The RSI at 58.72 is comfortably in the bullish zone, not yet signaling an overbought condition. However, similar to the shorter timeframes, the Stochastic Oscillator on the daily chart shows a K line at 46.61 and a D line at 47.01, indicating a bearish crossover and a potential slowdown in dollar strength or even a minor reversal. This conflict between the strong daily uptrend and the Stochastic's warning suggests that the dollar's advance might be losing momentum. For gold traders, this is a critical observation. A sustained weakening of the DXY, particularly if it breaks below key support levels like 99.26, could alleviate some of the pressure on XAUUSD, allowing it to potentially test higher resistance levels. The interplay between the dollar's strength and gold's resilience is, therefore, a key narrative to follow.
Correlations and Contrasts: Equities, Oil, and the Gold Equation
Beyond the dollar's influence, the broader market sentiment, as reflected in major equity indices like the S&P 500 and Nasdaq 100, plays a crucial role in shaping gold's trajectory. Currently, both indices are exhibiting downward pressure, with the S&P 500 down 0.35% and the Nasdaq 100 down 0.41%. This 'risk-off' sentiment typically benefits safe-haven assets like gold. However, the current market dynamic shows a complex interplay. While equities are falling, gold is also experiencing a pullback, suggesting that factors other than just risk appetite are at play, most notably the strong dollar. The S&P 500's daily ADX at 45.86 confirms a strong downtrend, and the RSI at 36.61 indicates oversold conditions. Similarly, the Nasdaq 100 shows a strong daily downtrend with an ADX of 42.41 and an RSI of 39.17. This simultaneous decline in equities and gold is somewhat unusual and points towards the dominant influence of dollar strength and perhaps specific market dynamics within the precious metals complex itself, such as profit-taking after a recent rally.
The energy markets, particularly Brent crude oil trading at $103.37 with a significant daily gain of 1.73%, offer another layer to the inflation narrative that often supports gold. Rising oil prices typically signal increasing inflationary pressures, which historically makes gold an attractive hedge. The strong uptrend in Brent crude, evidenced by the daily ADX at 62.6, suggests that energy costs are a significant factor in the current market environment. WTI crude, trading at $93.23 with a daily increase of 1.87%, mirrors this trend. This inflationary backdrop, driven by energy prices and geopolitical supply chain concerns (as suggested by recent news regarding Middle East tensions impacting LNG trade), should theoretically be supportive of gold. However, the fact that gold is not rallying strongly despite these factors suggests that the market's focus is currently elsewhere, primarily on the strength of the US dollar and potentially on technical indicators suggesting a near-term bearish bias for gold itself. The divergence between expected inflation support from oil prices and gold's actual price action is a key point of observation for traders.
The correlation analysis reveals a nuanced picture. Typically, a falling S&P 500 (currently at 6568.4) and a rising DXY (at 99.53) would create a strong bearish environment for gold. While the DXY's rise is indeed exerting pressure, gold's own technical indicators on the daily chart, such as the RSI at 31.67 and the Stochastic's bullish crossover, suggest that the metal might be approaching a point where it could decouple from this correlation and begin to find its own upward momentum, especially if geopolitical risks continue to escalate. The current situation where both equities and gold are experiencing pullbacks, despite rising oil prices, indicates that the market is processing multiple, somewhat conflicting, signals. This complexity underscores the importance of adhering to specific price levels and technical confirmations rather than relying solely on broad correlations. The $4,450.67 price point for XAUUSD is therefore not just a support level, but a battleground where these competing forces are being tested.
Decoding the Signals: What Different Traders Should Watch
For scalpers operating on the shortest timeframes, the immediate focus remains on the 1-hour chart's signals. The RSI at 38.57 and the Stochastic's oversold reading at 19.7/35.2 suggest potential for quick, short-lived bounces. Scalpers will be looking for confirmation of upward momentum breaking through immediate resistance at $4,471.86. However, the weak ADX of 23.62 indicates that these intraday moves might be range-bound, making tight stop-losses crucial. Any failure to hold the $4,428.13 support level on the 1-hour chart would be an immediate signal to exit long positions or even consider a short entry targeting the next support at $4,399.99. Volume analysis would be paramount here; a breakout on low volume would be a red flag.
Swing traders, who typically operate on 4-hour and daily charts, will find the mixed signals more challenging. The 4-hour chart shows a divergence between the MACD's positive momentum and the stronger ADX trend signal, while the daily chart presents a bearish MACD against a potentially oversold RSI and a bullish Stochastic crossover. For swing traders, the key will be confirmation. A decisive close above the 4-hour resistance at $4,556.42, especially if accompanied by increasing volume and a stronger trend signal on the ADX (above 25), could signal a shift. Conversely, a break and hold below the critical daily support at $4,440.66 would likely invalidate any bullish thesis and confirm a continuation of the downtrend, targeting $4,375.01. The current price of $4,450.67 sits precariously between these two critical zones, demanding patience and a clear strategy.
Long-term investors, however, might view the current pullback as a potential accumulation opportunity, especially if they believe geopolitical tensions will persist or escalate, thereby increasing safe-haven demand for gold. The daily chart's oversold RSI (31.67) and the bullish Stochastic crossover are classic signals that long-term investors often look for to initiate or add to positions. They would be watching for a clear break and sustained hold above the daily resistance at $4,587.04 as a confirmation of a bottoming process. The historical context of gold's performance during periods of geopolitical uncertainty, such as the lead-up to major conflicts or economic crises, reinforces this view. While short-term volatility is expected, the fundamental backdrop of global instability and potential inflationary pressures provides a long-term bullish case, provided key support levels around $4,375.01 hold firm. For these investors, the $4,450.67 price is less about immediate trading and more about establishing a strategic entry point for potential long-term gains.
Trade Scenarios and Probabilities
Bearish Scenario: Downside Pressure Mounts
65% ProbabilityNeutral Scenario: Consolidation Near Key Levels
25% ProbabilityBullish Scenario: Rebound from Support
10% ProbabilityThe current geopolitical climate introduces a high degree of unpredictability. Unexpected escalations could rapidly shift market sentiment and invalidate technical patterns. Traders should exercise extreme caution and employ robust risk management strategies, including tight stop-losses, especially given the conflicting signals across different timeframes and the current strong trend indicated by the daily ADX.
Frequently Asked Questions: XAUUSD Analysis
What happens if XAUUSD breaks below the $4,428.13 support level on the 1-hour chart?
A break below $4,428.13 on the 1-hour chart would likely trigger the bearish scenario, invalidating any short-term bullish hopes. This would signal increased selling pressure, potentially leading XAUUSD towards the next support level at $4,399.99, as indicated by our technical analysis.
Is the RSI at 38.57 a sell signal for XAUUSD right now?
An RSI of 38.57 on the 1-hour chart leans towards bearish momentum but is not an outright sell signal on its own. It suggests a lack of buying conviction. Confirmation would be needed, such as a break below key support levels or a bearish MACD crossover on a higher timeframe, to validate a sell decision.
How will escalating Middle East tensions affect XAUUSD prices this week?
Escalating geopolitical tensions typically increase demand for safe-haven assets like gold. While currently pressured by dollar strength, a significant escalation could override technical factors and push XAUUSD towards higher resistance levels, potentially testing the $4,500 mark and beyond.
Should I buy XAUUSD at the current $4,450.67 level given the mixed daily indicators?
Buying at $4,450.67 is a high-risk proposition due to the mixed daily signals and strong downtrend indicated by the ADX. Long-term investors might consider it a strategic entry if they anticipate sustained geopolitical risk, but confirmation above $4,471.86 resistance is needed for a more confident bullish outlook.
| Indicator | Value | Signal | Interpretation |
|---|---|---|---|
| RSI (14) | 38.57 | Neutral | Slightly bearish bias, lack of conviction |
| MACD Histogram | - | Bearish | Negative momentum on 1H/1D |
| Stochastic | K=19.7, D=35.2 | Bearish | Oversold on 1H, potential bounce |
| ADX | 23.62 | Moderate Trend | Weak trend on 1H, stronger on Daily (29.17) |
| Bollinger Bands | Middle Band Break | Bearish | Price below middle band on 1H/1D |
Track markets in real-time
AI-powered analysis, technical indicators and real-time price data.
Join Our Telegram Channel
Breaking market news, AI analysis and trading signals instantly.
Join Channel