SP500 Tests $6,539.90 Support Amid Bearish RSI: A Bull vs. Bear Showdown
The SP500 is teetering at $6,539.90, with a bearish RSI signaling caution. Bulls and bears are locked in a battle at critical levels. We break down the arguments.
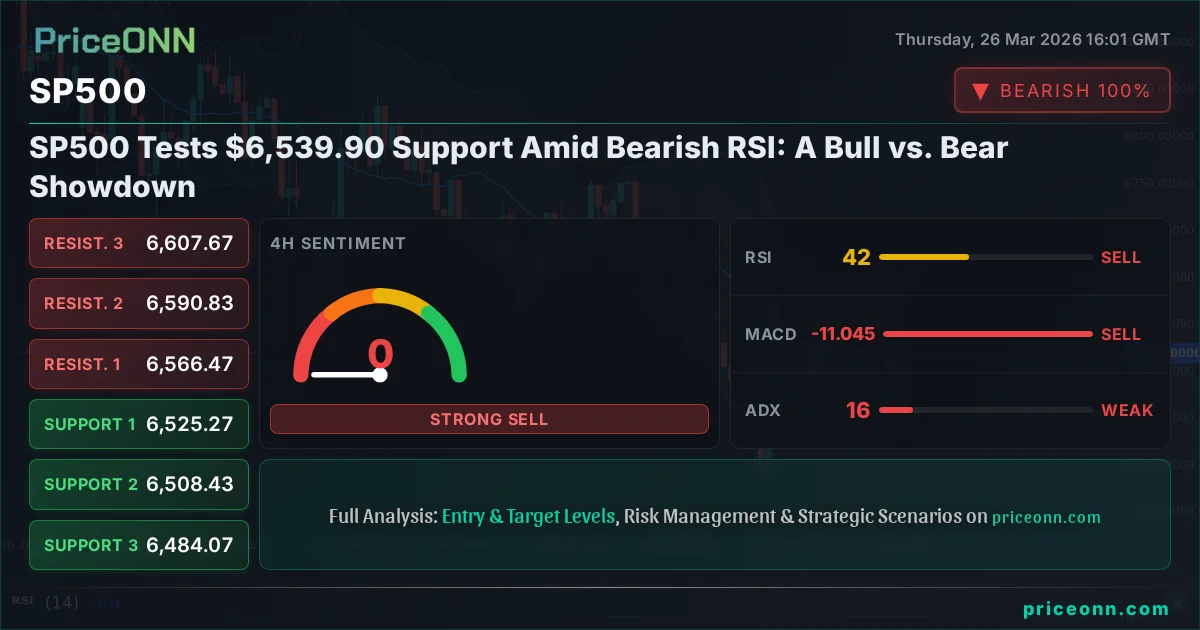
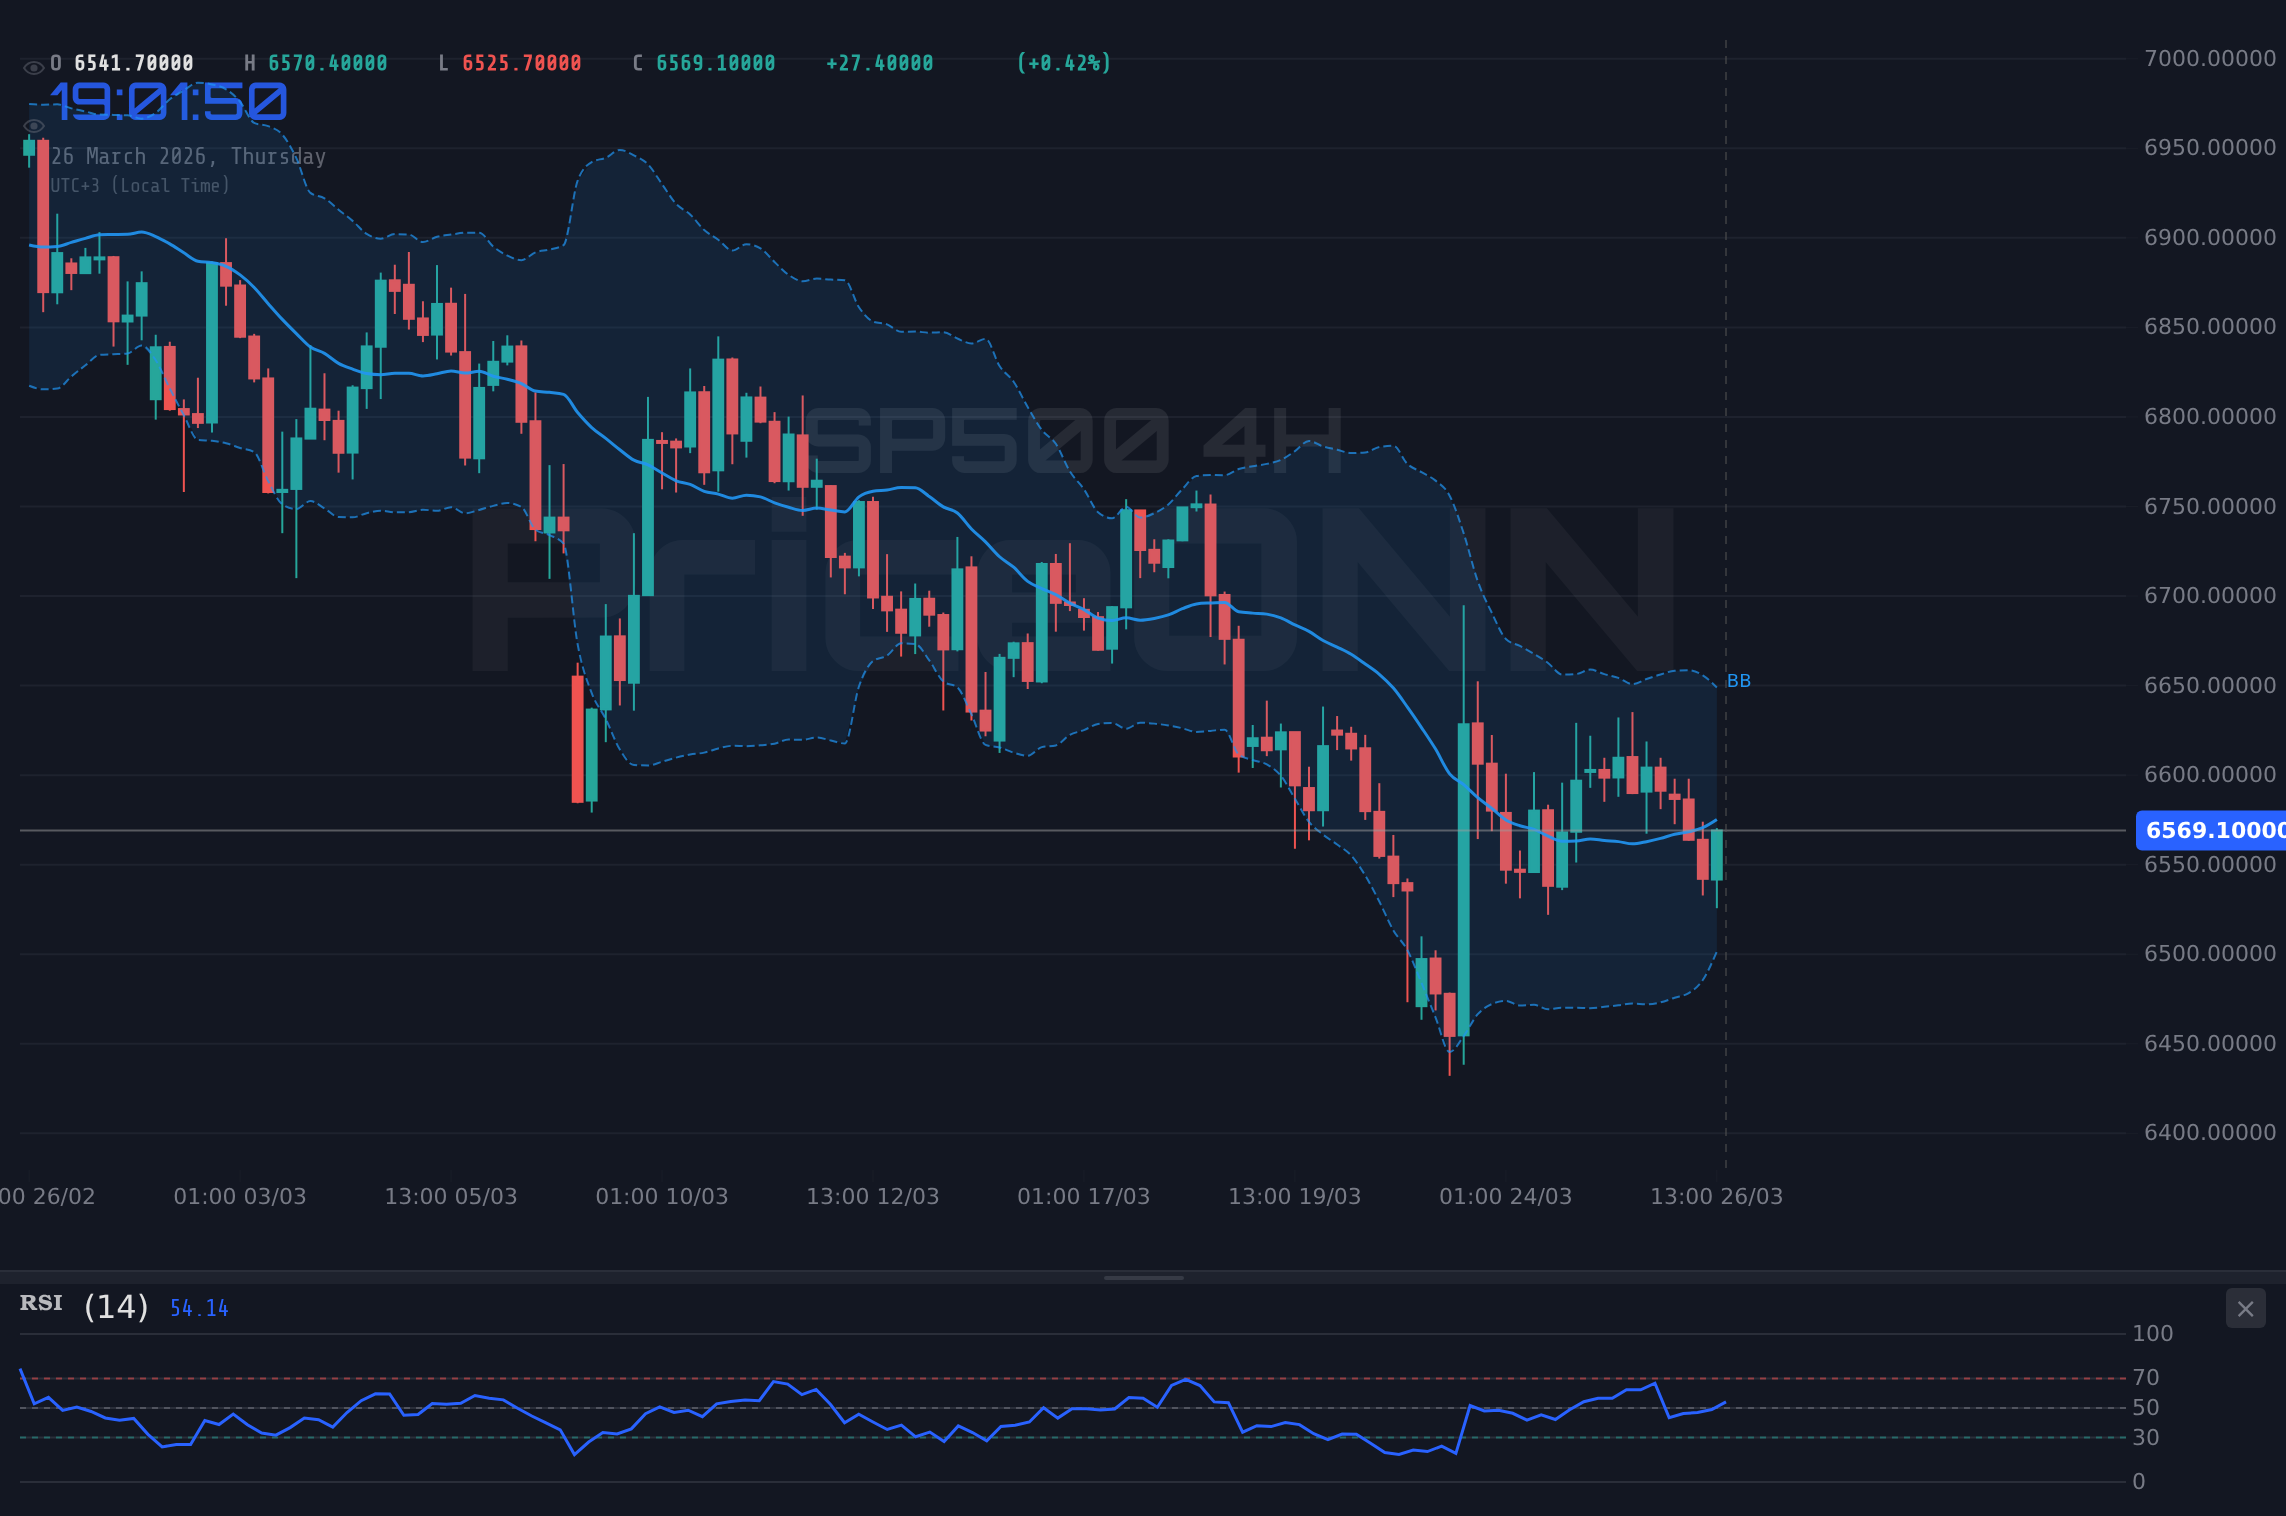
The battle lines are drawn around the $6,539.90 mark for the SP500 today. As traders grapple with conflicting signals from technical indicators and a backdrop of geopolitical unease, the question isn't just *if* the index will move, but *which direction* will ultimately prevail. The current price action, with the SP500 trading near its daily low of $6,525.70 and showing a bearish RSI reading of 40.85 on the 1-hour chart, suggests bears are currently holding the upper hand. However, the ADX at a mere 19.52 on the 1H chart indicates a lack of strong trend commitment, leaving the door ajar for a potential reversal or a continuation of the choppy, range-bound conditions we've seen recently.
- RSI at 40.85 signals weakening bullish momentum on the 1H chart, approaching oversold territory.
- Critical support sits at $6,525.27 (4H S1), tested multiple times this week, while resistance looms at $6,569.27 (1H R1).
- The ADX reading below 20 across multiple timeframes suggests a lack of strong trend, indicating choppiness.
- Correlation with DXY at 99.61 and a falling Nasdaq at 23,890.07 points to risk-off sentiment weighing on equities.
The Case for the Bulls: Can Support Hold?
Despite the immediate bearish technical signals, the argument for the bulls rests on the SP500's resilience around the $6,525-$6,530 area. This zone has acted as a significant floor on the 4-hour chart, with support levels noted at $6,525.27 (S1), $6,508.43 (S2), and $6,484.07 (S3). Historically, when the index has approached these levels after a period of consolidation, there has been a tendency for buyers to step in, anticipating a bounce. The Stochastic Oscillator on the 1-hour chart, currently showing %K at 50.4 and %D at 28.34 with %K > %D, hints at a potential short-term upward momentum build-up, suggesting a possible reversal could be brewing if buyers can defend these crucial support areas. Furthermore, the MACD on the 1H chart, while showing negative momentum, is still relatively close to its signal line, leaving room for a potential upward cross if buying pressure intensifies. The bulls are looking for a confirmation signal, perhaps a daily close above $6,569.27, to signal a potential resumption of upward momentum.
The underlying narrative supporting a potential bullish resurgence often ties back to macroeconomic expectations. While the current market sentiment leans towards risk aversion, driven by geopolitical tensions and a strong dollar (DXY at 99.61), any hint of a less hawkish stance from the Federal Reserve or a softening in inflation data could quickly shift the tide. Traders will be closely watching upcoming US economic releases, particularly any figures that might influence the Fed's next move. A surprisingly weak employment report or a dip in inflation could fuel a rally not just in equities, but across risk assets, as it would increase the probability of a sooner-than-expected rate cut or pause. The correlation with the Nasdaq 100, which is also showing signs of oversold conditions on shorter timeframes despite its 1.11% daily drop, indicates that a broader tech sector recovery could drag the SP500 higher. The bulls are betting that the current price weakness is an overreaction and that fundamental support will eventually assert itself.
Looking at the longer-term daily chart, the SP500 is still trading well above key psychological levels and significant historical support zones. While the daily RSI at 34.94 is firmly in the bearish-leaning territory, it's not yet in extreme oversold conditions that would typically signal a strong reversal. This allows room for further downside before the daily chart presents a compelling buy signal. The bulls' strategy here is defensive: protect the current support levels at all costs and wait for the market to present a clear reason to turn upwards. They are looking for a divergence on the daily RSI, or a solid break and hold above the $6,569.27 resistance, to confirm that the selling pressure is abating. Until then, it's about survival and positioning for a potential bounce, rather than chasing the current downtrend.
The Bearish Case: Trend is Down, Risk Remains
On the flip side, the bears have a compelling argument, primarily driven by the persistent downward trend and the prevailing risk-off sentiment. The SP500's daily trend is firmly established as 'Düşüş' (Bearish) with a power of 100%, according to the provided data. The daily ADX at 46.04 reinforces this, indicating a strong, established downward trend. The current price of $6,539.90 is below the 1H, 4H, and 1D middle Bollinger Bands, a consistent sign of bearish pressure across timeframes. The MACD histogram remains negative on most timeframes, and the price is consistently trading below the signal line, suggesting that the bearish momentum is still dominant. The daily RSI at 34.94, while not deeply oversold, is trending downwards, indicating that sellers are in control and further declines are probable before any significant buying interest emerges.
The geopolitical landscape is a significant tailwind for the bears. Escalating tensions in the Middle East, coupled with rising oil prices (Brent crude at $105.73, WTI at $94.95), create an environment of uncertainty that typically leads investors to de-risk. The surging dollar index (DXY) to 99.61 further exacerbates this, as a stronger dollar often correlates with weaker equity markets, especially for US-based indices like the SP500. The fact that the Nasdaq 100 has fallen 1.11% to $23,890.07 and the Dow Jones 30 is down 0.41% to $46,220.50 suggests a broad-based selloff in the US equity market, not just a sector-specific correction. The bears see the current price action as a continuation pattern, with the next logical targets being the 4-hour support levels, particularly $6,508.43 and potentially down to $6,484.07 if the selling pressure intensifies.
From a technical perspective, the bears are watching for confirmation that the current support holds will fail. A decisive break below $6,525.27 on increased volume would be a strong bearish signal, potentially triggering stop-loss orders and accelerating the decline towards the $6,500 handle and beyond. The daily chart presents resistance at $6,628.57 (R1), $6,665.83 (R2), and $6,696.47 (R3). Any failed attempts to reclaim these levels on the upside would reinforce the bearish thesis. The Stochastic Oscillator on the 4-hour chart, with %K at 12.39 and %D at 46.19, clearly indicates oversold conditions, but in a strong downtrend, this can persist for some time before a meaningful reversal occurs. The bears believe the path of least resistance is still downwards, and any rallies are likely to be short-lived opportunities for sellers to enter the market at better prices.
The Verdict: A Watchful Stance Amidst Uncertainty
The current market condition for the SP500 is best described as a "WATCH_ZONE." The ADX readings across all timeframes (1H: 19.52, 4H: 15.59, 1D: 46.04) paint a picture of conflicting trends. While the daily chart shows a strong downward trend, the shorter timeframes suggest a lack of directional conviction and potential for ranging or reversal. The RSI is signaling weakness, but the Stochastic on the 1H chart offers a glimmer of hope for a short-term bounce. This divergence means that a clear, high-probability trading setup is not yet present.
The critical level to watch is the $6,525 support zone on the 4-hour chart. A daily close below this level, especially on increased volume, would significantly strengthen the bearish case and invalidate any immediate hopes of a bullish reversal. Conversely, a sustained break and hold above the $6,569.27 resistance on the 1-hour chart would be the first sign that the bulls are regaining control. Until one of these key levels is decisively breached, the market is likely to remain choppy, with price action dictated by short-term sentiment shifts and economic data releases. Traders should exercise caution, manage risk tightly, and wait for a clearer directional signal before committing significant capital.
The confluence of a strong dollar, rising oil prices, and broader equity market weakness creates a challenging environment. While the SP500's price action around $6,539.90 suggests a potential short-term bounce is possible, the dominant bearish trend on the daily chart and the prevailing risk-off sentiment cannot be ignored. A prudent approach would be to wait for a confirmed breakout or breakdown, or for the ADX to show a clearer directional trend. Patience looks like it will be rewarded here, as the market navigates these competing forces.
Bearish Scenario: Breakdown Below Support
65% ProbabilityNeutral Scenario: Consolidation Around Support
25% ProbabilityBullish Scenario: Bounce from Support
10% ProbabilityFrequently Asked Questions: SP500 Analysis
What happens if the SP500 breaks below the critical $6,525 support level?
A daily close below $6,525.27 would significantly strengthen the bearish case, potentially triggering further selling pressure. Bears would then target the 4-hour support levels at $6,508.43 and $6,484.07.
Should I buy the SP500 at current levels around $6,539.90 given the bearish RSI?
Buying at current levels is risky due to the bearish RSI (40.85 on 1H) and the strong daily downtrend (ADX 46.04). A higher probability setup would involve waiting for a confirmed break above $6,569.27 or a clear bullish signal on the daily chart.
Is the RSI at 40.85 a sell signal for the SP500 right now?
An RSI of 40.85 on the 1-hour chart indicates weakening bullish momentum but is not yet in oversold territory. While it leans bearish, it doesn't automatically signal a sell, especially with the ADX suggesting a lack of strong trend on shorter timeframes.
How will the current DXY strength at 99.61 affect the SP500 this week?
A strong DXY often correlates with risk-off sentiment, pressuring US equities like the SP500. If the dollar continues to rise, it could exacerbate the selling pressure on the index, making it harder for bulls to defend current support levels.
Track markets in real-time
AI-powered analysis, technical indicators and real-time price data.
Join Our Telegram Channel
Breaking market news, AI analysis and trading signals instantly.
Join Channel