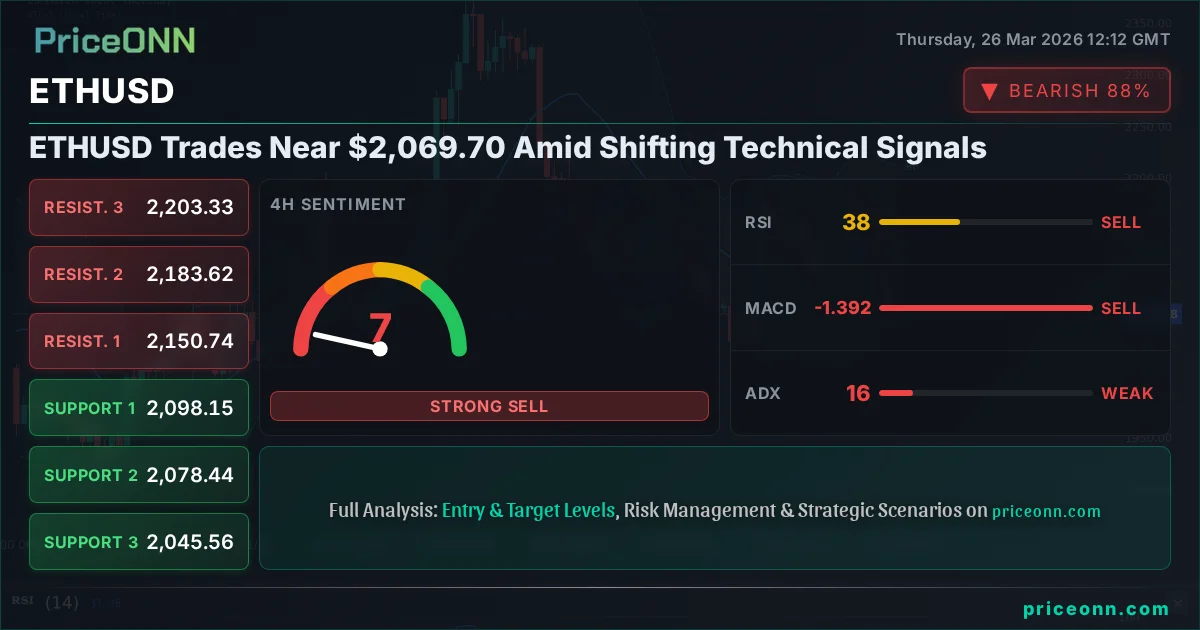
ETHUSD Trades Near $2,069.70 Amid Shifting Technical Signals
ETHUSD is hovering near $2,069.70, with mixed technical indicators suggesting a period of consolidation. Key support at $2,060.04 and resistance at $2,092.59 are closely watched.
This is precisely where you need to pay attention: ETHUSD is currently navigating choppy waters around the $2,069.70 mark. The charts are telling a story of indecision, a delicate dance between bulls trying to reclaim lost ground and bears pressing their advantage after a sharp pullback. Having watched ETHUSD closely through its recent volatility, it’s clear that the market is in a transitional phase, and the next move will likely be dictated by which side can break the current stalemate. We're seeing conflicting signals across different timeframes, making it crucial to understand the nuances before making any hasty decisions. The question on everyone's mind is: will the current consolidation lead to a renewed upward push, or will it be a prelude to further declines?
- ETHUSD is trading near $2,069.70, showing signs of consolidation after a recent downturn.
- The 1-hour RSI at 20.76 signals oversold conditions, potentially hinting at a short-term bounce.
- Key support is identified at $2,060.04, while resistance looms at $2,092.59, defining the immediate trading range.
- Conflicting signals between Stochastic (oversold) and ADX (strong downtrend) create market uncertainty.
Navigating the Current ETHUSD Price Action
ETHUSD's Delicate Balance Near $2,069.70
The cryptocurrency market, and Ethereum in particular, is often characterized by its rapid shifts and dramatic price movements. Right now, ETHUSD is trading at a critical juncture, hovering just above the $2,069.70 level. This isn't just another price point; it's a zone where the market is grappling with a significant decision. After a notable dip, evidenced by the 1-hour timeframe showing a -4.25% daily change, ETHUSD is attempting to find its footing. The daily range, from $2,060.14 to $2,180.48, highlights the recent volatility, but the current price action is far more constrained. The bulls are trying to prevent a further slide, while the bears are looking to capitalize on any weakness. This standoff is creating a tight trading range, and the directionality is far from clear.
Looking at the 1-hour chart, the trend strength is showing an 87% conviction towards the downside, but this needs to be viewed in context with other indicators. The ADX at 23.66 suggests a moderately strong downtrend is in play, but this doesn't tell the whole story. While the momentum indicators like MACD are painting a bearish picture with negative momentum, the Stochastic Oscillator is flashing an oversold signal at K=7.68, D=11.07. This divergence is where the real market watching begins. An oversold Stochastic suggests a potential for a bounce, but the persistent negative MACD and strong ADX indicate that any upward movement might be met with significant selling pressure. It’s a classic case of conflicting signals, and traders need to be exceptionally patient.
The Tug-of-War: Support at $2,060.04 vs. Resistance at $2,092.59
When we zoom into the immediate price action, the levels become paramount. On the 1-hour chart, the first line of defense for ETHUSD is at $2,060.04. This is not just a random number; it's a psychological and technical barrier that has held firm in recent trading. A break below this level would confirm the bears' immediate dominance and could open the door for further downside. Conversely, the bulls are eyeing the resistance at $2,092.59. This is the immediate hurdle they need to overcome to even suggest a reversal. The space between these two levels, roughly $32.55 wide, represents the current battleground. Price action within this range is likely to be choppy, characterized by quick reversals and potential 'stop hunts' as liquidity is tested on both sides.
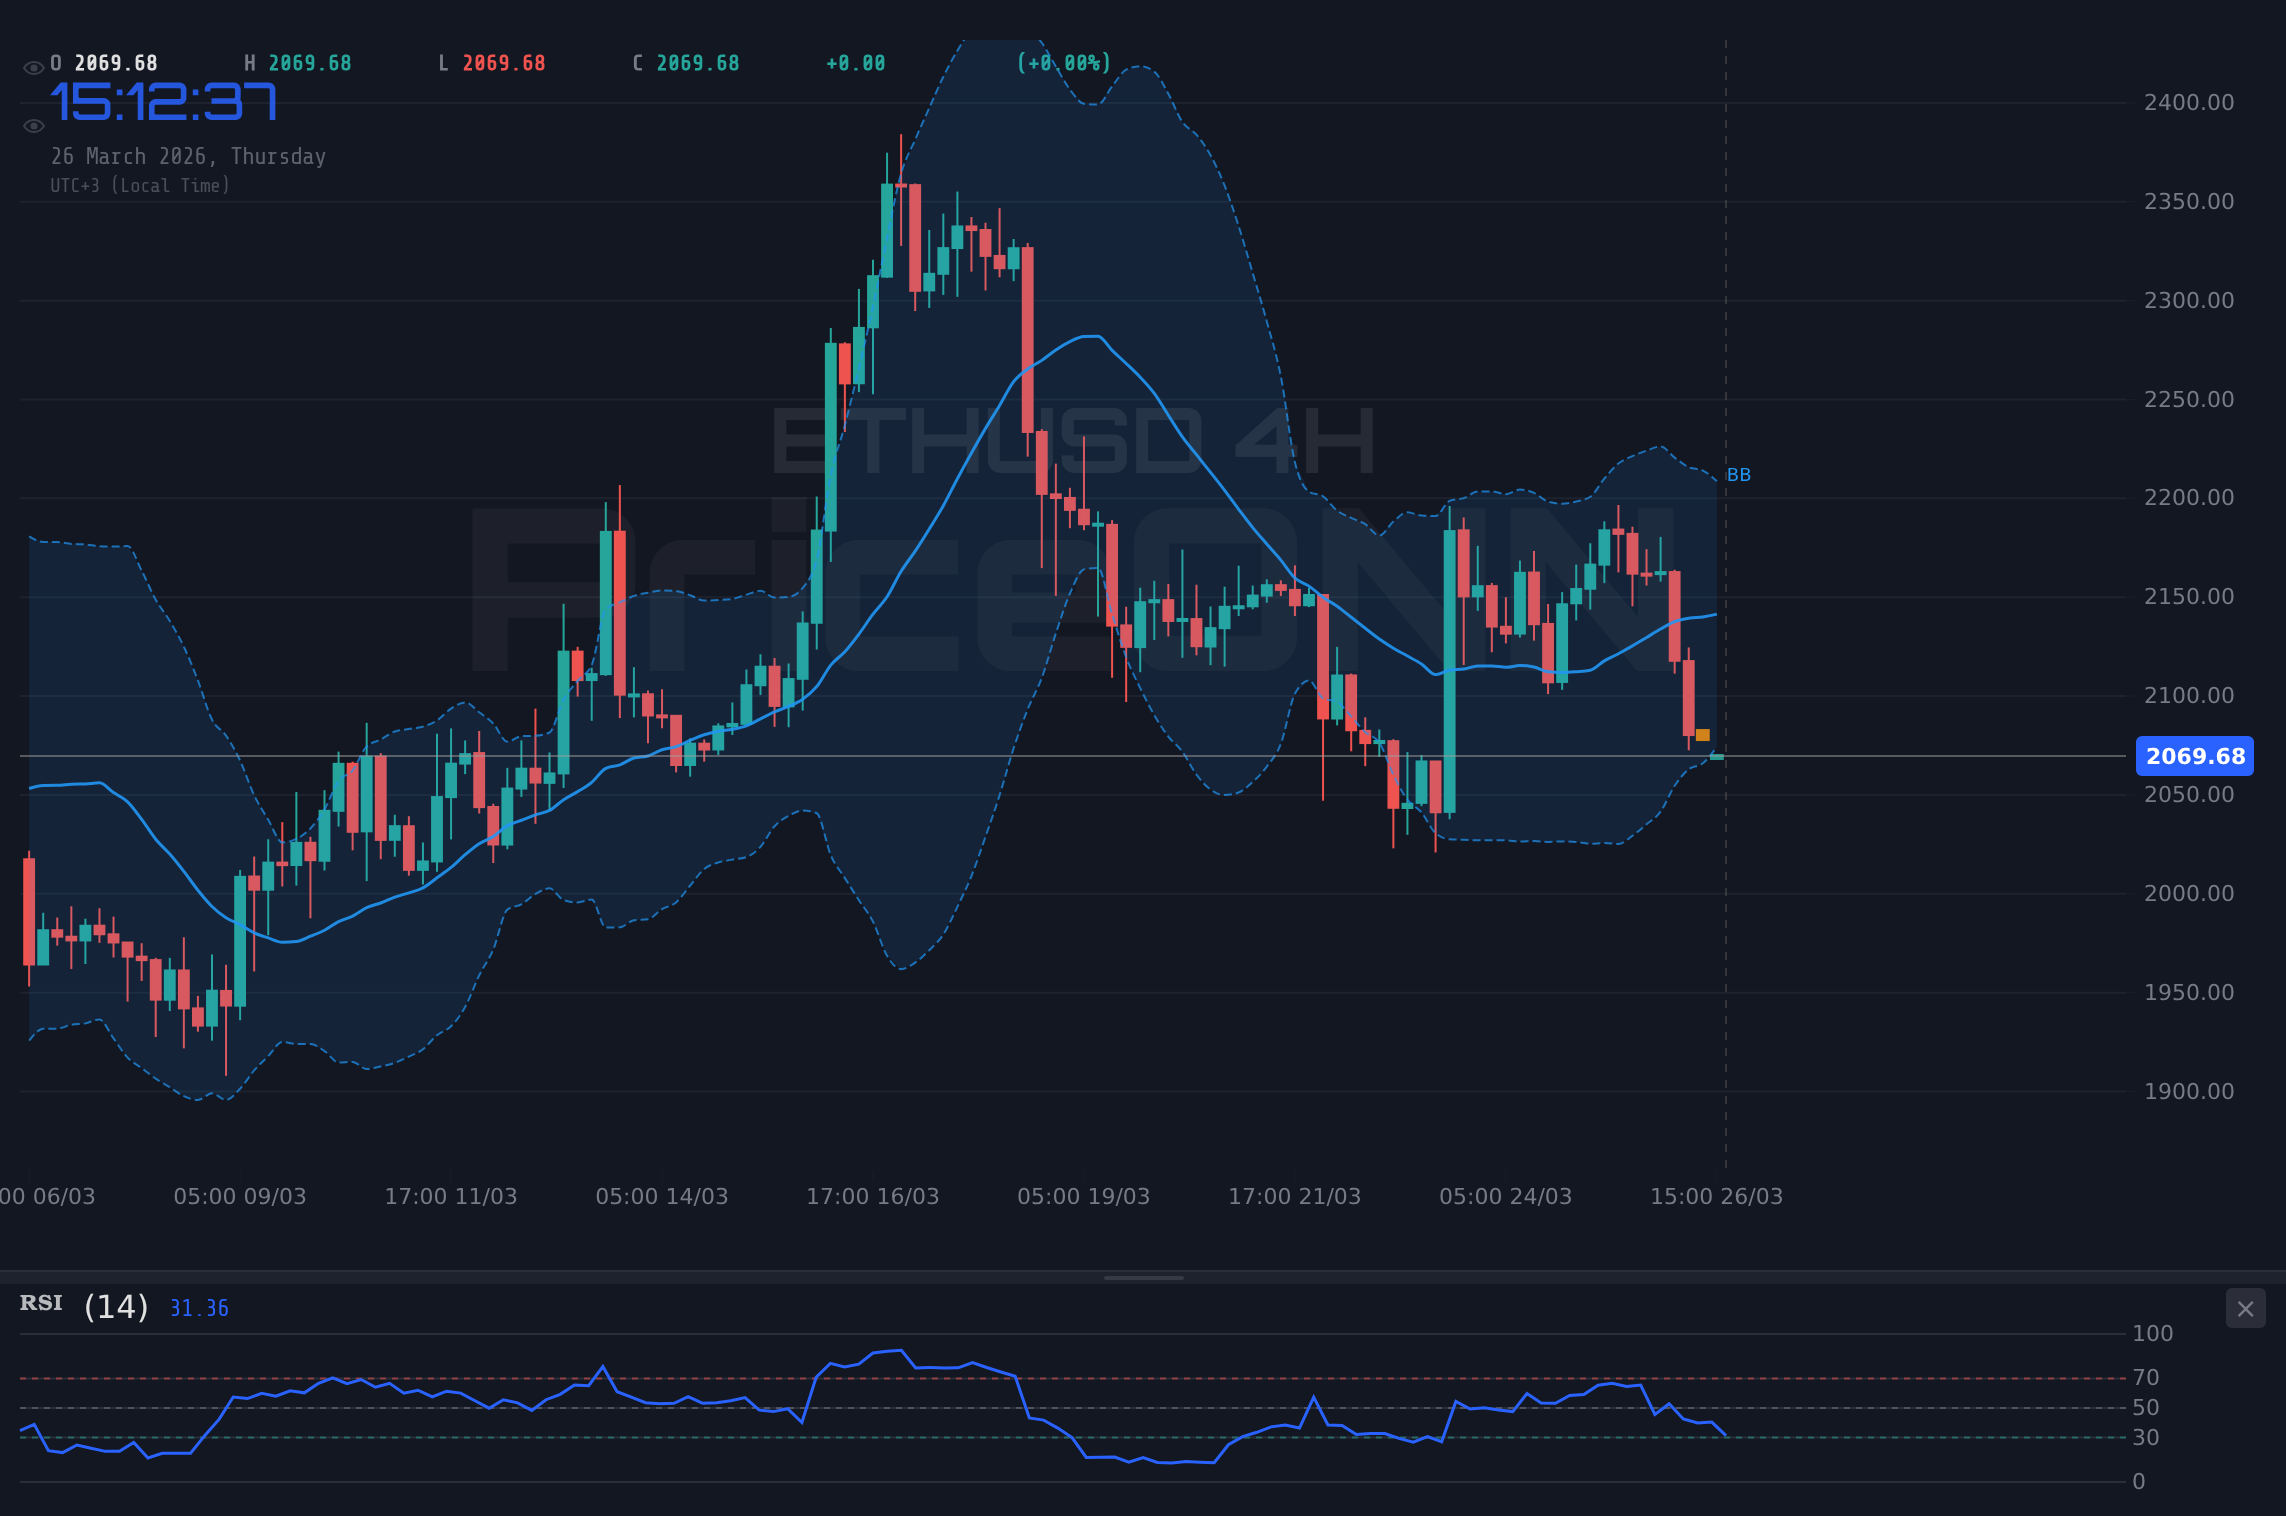
The 4-hour chart, which offers a slightly broader perspective, confirms the indecision. While the trend is technically neutral with only 50% strength, the price is currently trading below the middle Bollinger Band, indicating a bearish inclination on this timeframe. However, the RSI at 38.04 is still in neutral territory, not yet screaming 'oversold' but certainly not indicating bullish strength either. The Stochastic on the 4-hour chart, with K=26.75 and D=63.11, still leans bearish, reinforcing the idea that the path of least resistance might be downwards in the short to medium term. Yet, the ADX at 15.98 on this timeframe suggests a weak trend, implying that the market might be consolidating rather than trending strongly in either direction. This ambiguity is precisely why a cautious approach is warranted.
Deeper Dive: Technical Indicators and Their Conflicting Messages
RSI and Stochastic: The Oversold Clues
Let's talk about the oversold signals. On the 1-hour chart, the RSI is sitting at a very low 20.76. This is deep into territory that, historically, has often preceded a short-term bounce or at least a pause in the selling. Similarly, the Stochastic Oscillator on the same timeframe is extremely low, with the %K line at 7.68 and the %D line at 11.07. These are classic 'oversold' readings. It suggests that sellers may have overextended themselves in the very short term, and a potential snap-back rally could be on the cards. Think of it like stretching a rubber band too far; eventually, it wants to snap back towards its original position. This doesn't guarantee a sustained rally, but it does suggest that the immediate selling pressure might be exhausting itself.
However, we must be careful not to jump to conclusions. While these oversold conditions are present on the 1-hour chart, they look less convincing on the higher timeframes. The 4-hour RSI is at 38.04, still well within neutral territory, and the 1-day RSI is at 46.89, also showing no signs of being oversold. This creates a conflict: short-term traders might see a buying opportunity based on the 1-hour extremes, but longer-term investors might be wary as the higher timeframes don't confirm this potential bottom. The key here is confirmation. A sustained move above the immediate resistance, coupled with rising RSI on higher timeframes, would be a much stronger signal than simply buying because the 1-hour Stochastic is low.
MACD and ADX: The Bearish Undertones
Now, let's look at the other side of the coin, the indicators that are leaning bearish. The MACD, across all three timeframes we're examining (1H, 4H, 1D), is consistently showing negative momentum. On the 1-hour and 1-day charts, the MACD line is below its signal line, and the histogram is negative. This indicates that the selling pressure is still dominant, and the recent price action hasn't been enough to shift the underlying momentum. This is like seeing a car that has slowed down significantly but is still rolling downhill – it hasn't started climbing the hill yet. The bears are still in command of the momentum.
The ADX, which measures trend strength, is also providing a consistent, albeit somewhat mixed, message. On the 1-hour chart, it's at 23.66, suggesting a moderately strong downtrend. On the 4-hour, it dips to 15.98, indicating a weaker trend or consolidation. However, on the daily chart, it ticks up to 17.83, still in the 'weak trend' category but showing a slight increase. This overall ADX reading suggests that while there's downward pressure, the trend isn't overwhelmingly strong or committed. This aligns with the price action hovering around key support levels. A strong downtrend would typically see the ADX consistently above 25. The current levels suggest that while bears have the upper hand in terms of momentum (MACD), the trend strength isn't yet at a point where a definitive breakdown is guaranteed without further catalysts.
Bollinger Bands and Price Action: A Tale of Two Bands
The Bollinger Bands offer another visual perspective on ETHUSD's current state. On the 1-hour timeframe, the price is hugging the middle band, with a slight downward bias. This suggests that the market is neither extremely overbought nor oversold on this very short-term view, but rather consolidating around the average price. However, when we look at the 4-hour and daily charts, the picture shifts. The price is consistently trading below the middle band on both these timeframes. This indicates that, on a slightly longer perspective, the bears have maintained control, pushing the price into the lower half of its recent range. The bands themselves aren't excessively wide, which again points towards a lack of strong directional conviction across all timeframes, but the daily position below the middle band is a bearish flag.
This observation is crucial for traders. If the price were consistently above the middle band on all timeframes, it would signal bullish strength. If it were consistently below on all timeframes, it would confirm a strong bearish trend. The current mixed picture – below the middle band on 4H/1D, but around it on 1H – suggests that short-term fluctuations could be significant. A move back above the 4-hour middle band would be the first sign of bullish resurgence, but we're not there yet. Until then, the price action relative to the Bollinger Bands reinforces the idea that ETHUSD is in a precarious position, susceptible to moves in either direction but with a slight bearish lean on the daily.
The Broader Context: DXY, Equities, and Geopolitical Ripples
Dollar Strength and Its Impact on ETHUSD
It's impossible to analyze ETHUSD without considering the movements of the US Dollar Index (DXY). Currently, the DXY is showing strength, trading around 99.68 and exhibiting an 87% trend strength on the 1-hour chart, moving towards the 100 mark. This rise in the dollar typically acts as a headwind for riskier assets like cryptocurrencies, including Ethereum. When the dollar strengthens, it becomes more expensive for holders of other currencies to buy dollar-denominated assets, including ETH. Furthermore, a stronger dollar often correlates with a 'risk-off' sentiment in broader markets, which can spill over into crypto.
The DXY's current momentum, with positive MACD and RSI above 70 on the 1-hour chart, suggests that dollar strength might continue in the very short term. This presents a challenge for ETHUSD. If the DXY continues its upward trajectory, it could exacerbate the downward pressure on ETHUSD, potentially pushing it closer to the $2,060.04 support level. Conversely, if the dollar shows signs of weakening - perhaps due to shifting central bank expectations or a sudden increase in global risk appetite - it could provide some relief for ETHUSD. The correlation here is not always perfect, but the general trend of a stronger dollar weighing on crypto remains a significant factor to monitor.
Equity Market Weakness and Safe-Haven Flows
Adding to the complexity, major equity indices like the S&P 500 and Nasdaq are also showing weakness. The S&P 500 is down -0.8% at 6538.6, and the Nasdaq 100 has fallen -0.99% to 23917.88. This broad-based selloff in equities often indicates a decrease in overall market risk appetite. In such an environment, investors tend to move away from speculative assets and towards safer havens. While gold is traditionally seen as a safe haven, and we've seen it react to geopolitical tensions, the current equity weakness suggests a general flight to safety.
For ETHUSD, this equity market downturn is another piece of bearish evidence. Cryptocurrencies, despite their claims of being uncorrelated, often move in tandem with tech stocks, particularly the Nasdaq. A declining Nasdaq implies that risk sentiment is souring, which can lead investors to reduce their exposure to high-risk assets like ETH. This could mean that any potential bounce in ETHUSD might be short-lived, as the broader market sentiment is currently tilted towards caution. The fact that both the DXY and equity markets are showing weakness simultaneously creates a challenging environment for risk assets.
Geopolitical Tensions and Their Indirect Influence
While the provided market data doesn't explicitly detail geopolitical events influencing ETHUSD, it's impossible to ignore their broader market impact. News about rising geopolitical tensions, as hinted at in the recent breaking news snippets (though not directly related to ETHUSD), can significantly influence market sentiment. Such events often lead to increased volatility across all asset classes. For example, the surge in Brent crude oil prices to $105.59, up 3.92%, is a clear indicator of heightened geopolitical risk, likely stemming from the Middle East. Higher oil prices can fuel inflation concerns, which in turn can influence central bank policy and, consequently, risk asset valuations.
While ETHUSD might not react directly to oil prices or specific geopolitical headlines in the same way gold does, these factors contribute to the overall market mood. A tense geopolitical climate generally increases market uncertainty, leading to reduced risk appetite. This indirectly impacts ETHUSD by reinforcing the 'risk-off' sentiment that favors assets like the US Dollar (DXY) and can pressure speculative assets. Traders need to be aware that while the technicals might suggest a potential bounce, underlying geopolitical anxieties could cap any upside potential or even trigger a sharper sell-off if tensions escalate further.
Trading Scenarios for ETHUSD: What Lies Ahead?
Given the conflicting signals and the current market environment, it's essential to outline potential scenarios for ETHUSD. The price action around $2,069.70, with key support at $2,060.04 and resistance at $2,092.59, sets the stage for a few possibilities. The probabilities assigned below reflect the current technical picture and broader market correlations, acknowledging that the market is inherently uncertain.
Bearish Scenario: Breakdown Below Support
65% ProbabilityNeutral Scenario: Consolidation Around $2,069.70
25% ProbabilityBullish Scenario: Bounce from Oversold Conditions
10% ProbabilityThe current technical setup favors a bearish continuation scenario, given the multiple bearish signals on higher timeframes and the prevailing risk-off sentiment. However, the oversold conditions on the 1-hour chart cannot be ignored and might lead to a short-term bounce. Traders should prioritize risk management and wait for clear confirmation before committing to a trade. A break below $2,060.04 would be the primary signal for a bearish entry, while a sustained move above $2,092.59 would be needed to invalidate that thesis and suggest a potential reversal.
What to Watch Next for ETHUSD
Economic Calendar and Potential Catalysts
While the current data doesn't highlight specific immediate economic releases directly impacting ETHUSD, the broader macroeconomic landscape remains a key driver. The US Dollar Index (DXY) is showing strength, and equity markets are under pressure. This environment typically favors a cautious approach to risk assets. Any shift in the DXY, perhaps driven by upcoming US economic data (like employment figures or inflation reports, though not explicitly detailed for today in the provided snippet) or changes in Fed policy expectations, could quickly alter the sentiment for ETHUSD. For instance, stronger-than-expected US inflation data could lead to expectations of a more hawkish Fed, further strengthening the dollar and pressuring ETHUSD. Conversely, signs of cooling inflation or a dovish pivot from the Fed could provide a much-needed tailwind.
The energy market's reaction, with Brent crude oil surging to $105.59, also warrants attention. Rising energy prices can contribute to inflation fears, which complicate the central banking environment. If inflation remains stubbornly high, it could force central banks to maintain tighter monetary policies for longer, which is generally bearish for growth assets. The interplay between energy prices, inflation expectations, and central bank responses will be a critical background factor for ETHUSD's price action in the coming weeks. Traders should keep a close eye on any news related to these macroeconomic themes, as they can override short-term technical signals.
The Importance of Confirmation and Risk Management
In a market environment as uncertain as this, confirmation is king. Relying solely on oversold indicators on a low timeframe can be a recipe for disaster. The bearish signals on the 4-hour and daily charts, coupled with the strength of the DXY and the weakness in equities, suggest that the path of least resistance is likely downwards. Therefore, any bullish trades should be approached with extreme caution and require significant confirmation, such as a decisive break above key resistance levels ($2,092.59) with strong volume and positive divergence on higher timeframes.
For those leaning bearish, the trigger would be a clear break below the $2,060.04 support. This would align with the prevailing downtrend on higher timeframes and could signal further downside. However, even in a bearish scenario, expecting a straight line down is unrealistic. Choppy price action and potential short-term bounces are likely. This underscores the absolute necessity of robust risk management. Setting appropriate stop-losses, managing position size, and having a clear exit strategy are not optional - they are fundamental to surviving and thriving in volatile markets like crypto. Patience is key; waiting for the market to provide a clearer signal or a more favorable risk-reward setup is often the wisest course of action.
Frequently Asked Questions: ETHUSD Analysis
What happens if ETHUSD breaks below the $2,060.04 support level?
A close below $2,060.04 on the 4-hour chart would likely trigger a bearish scenario, with potential targets at $2,045.56 and $2,030.00. This would confirm the bears' dominance given the current downtrend signals.
Should I buy ETHUSD around $2,069.70 given the oversold RSI at 20.76?
Buying solely on the 1-hour oversold RSI is risky due to conflicting signals on higher timeframes. Confirmation, such as a sustained move above $2,092.59 with increasing volume, is needed to validate a bullish move.
Is the MACD negative momentum signal at -0.16 a sell signal for ETHUSD right now?
The negative MACD momentum indicates that selling pressure is dominant, aligning with the bearish trend on daily charts. However, it should be considered alongside other indicators like Stochastic, which shows oversold conditions, suggesting potential for a short-term bounce before further downside.
How will the rising DXY around 99.68 affect ETHUSD this week?
The strengthening DXY typically puts pressure on risk assets like ETHUSD. If the dollar continues its ascent, it could exacerbate the downward pressure on ETHUSD, potentially pushing it towards the $2,060.04 support level.
Track markets in real-time
AI-powered analysis, technical indicators and real-time price data.
Join Our Telegram Channel
Breaking market news, AI analysis and trading signals instantly.
Join Channel