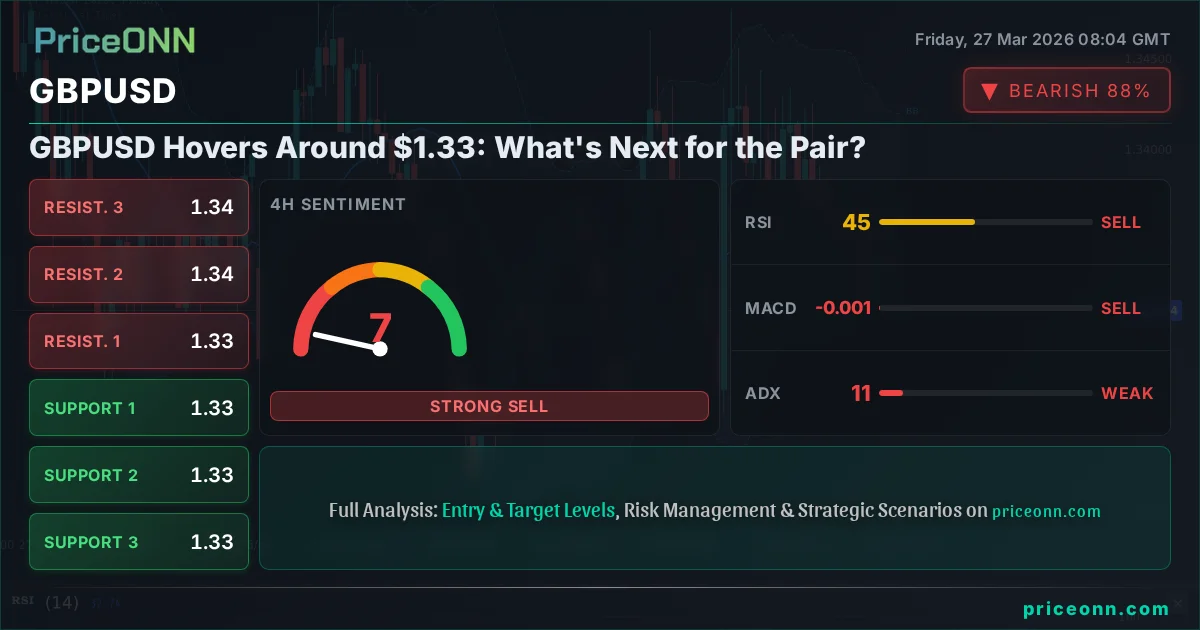
GBPUSD Hovers Around $1.33: What's Next for the Pair?
GBPUSD is trading near $1.33, caught in a neutral trend. Key technical indicators suggest caution as traders watch for a decisive breakout from current levels.
GBPUSD's Current Standoff Near $1.33: A Technical Crossroads
The GBPUSD currency pair finds itself at a critical juncture, currently hovering around the significant psychological level of $1.33. This price point represents a delicate balance, with both bulls and bears vying for control. Recent price action reveals a market caught in a neutral trend, characterized by waning momentum and conflicting signals across various timeframes. The 1-hour chart shows a neutral trend with 50% strength, while the 4-hour and daily charts lean towards a bearish trend, albeit with slightly reduced conviction compared to previous sessions. This indecision suggests that neither side has a firm grip on the market, making it imperative for traders to scrutinize the underlying technicals to decipher the next probable direction. With the Dollar Index (DXY) showing signs of strength, currently trading around 99.8, and global risk sentiment exhibiting choppiness, the GBPUSD's path forward is far from clear-cut. Understanding the interplay of these factors is crucial for navigating the upcoming trading sessions.
- GBPUSD is currently trading around $1.33, reflecting a neutral trend on the hourly chart and a bearish lean on daily timeframes.
- The ADX reading of 10.71 on the 4-hour chart indicates a weak, choppy market environment, suggesting potential for range-bound trading or a sudden shift in momentum.
- Key support levels are identified at $1.33291 and $1.33241, while resistance looms around $1.33418 and $1.33495.
- Conflicting signals from RSI (36.57 on 1H, 45.42 on 4H) and Stochastic (oversold on 4H, heading lower on 1H) necessitate caution and a clear trigger for entry.
Navigating the Choppy Waters: Indicator Insights
Delving deeper into the technical indicators provides a nuanced, albeit complex, picture for GBPUSD. On the 1-hour chart, the Relative Strength Index (RSI) stands at 36.57, firmly in neutral territory but leaning towards oversold conditions, suggesting some selling pressure might be exhausting. However, this is somewhat contradicted by the MACD, which shows positive momentum and is positioned above its signal line, hinting at potential upward movement in the short term. The Stochastic Oscillator on this timeframe, with %K at 41.97 and %D at 53.16, presents a bearish signal as %K dips below %D, indicating a possible move lower. The Average Directional Index (ADX) on the 1-hour chart is a mere 12.17, signaling a very weak trend, which aligns with the neutral sentiment. This confluence of mixed signals underscores the current indecision in the market.
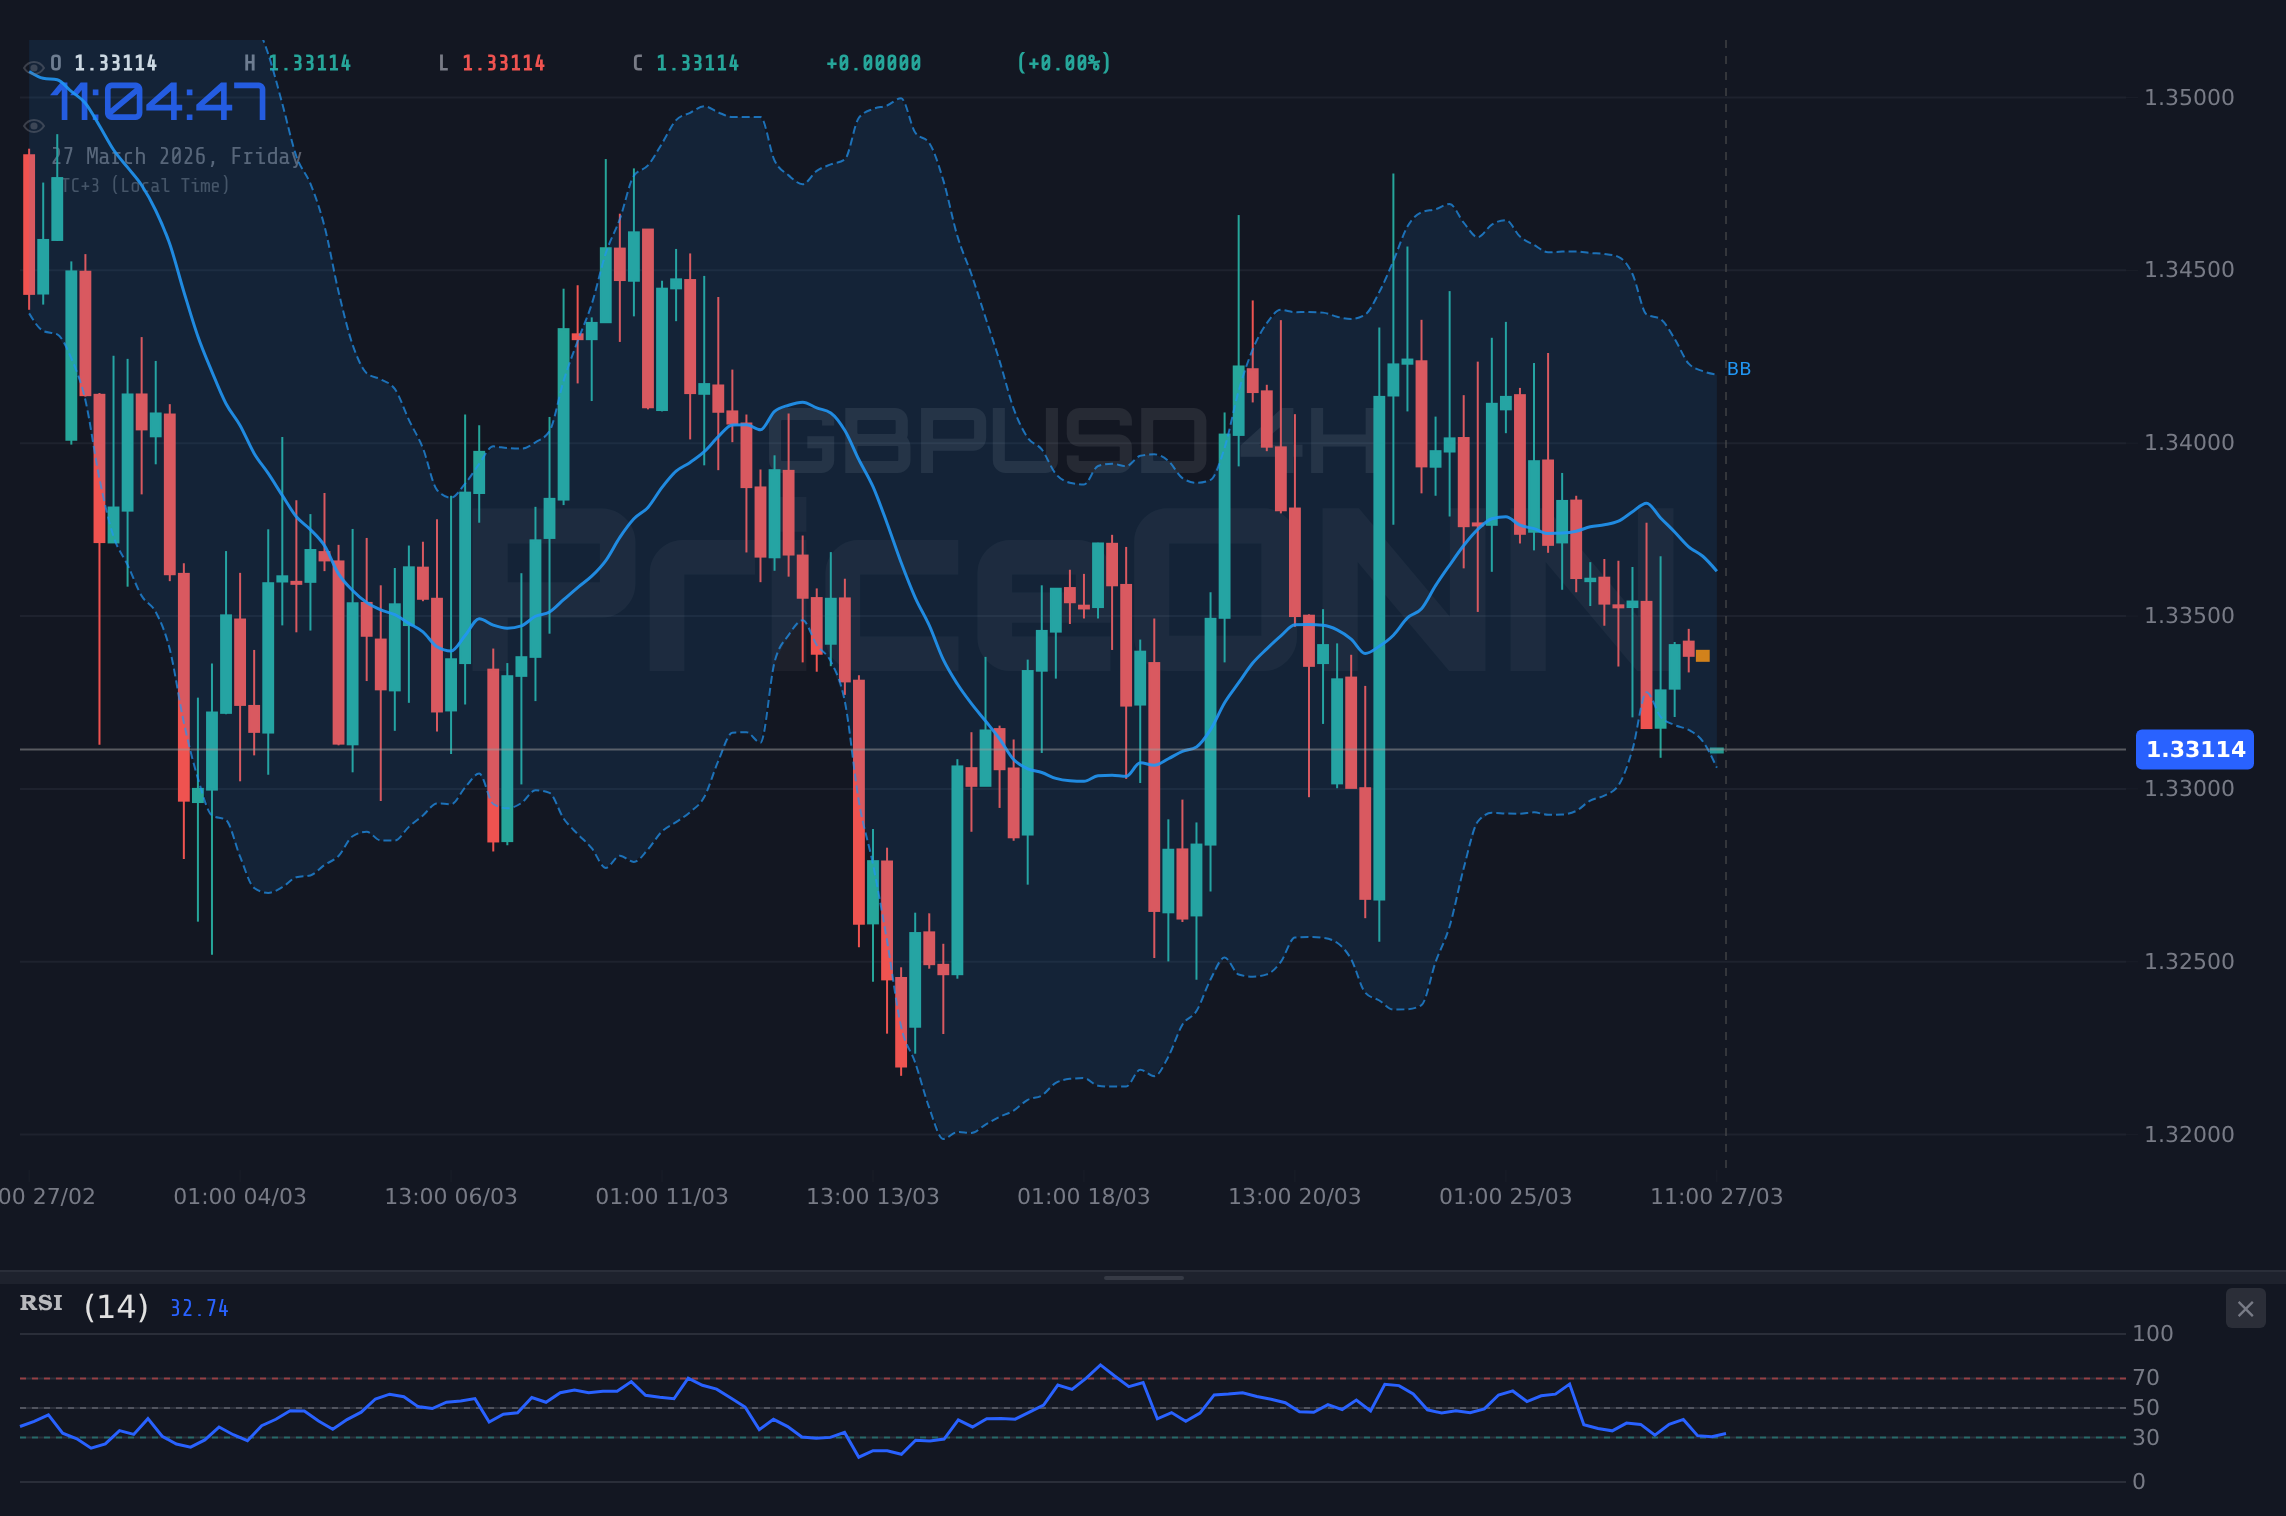
Shifting to the 4-hour timeframe, the narrative becomes slightly more bearish. The RSI sits at 45.42, still in neutral territory but showing a downward inclination, reinforcing the idea of prevailing selling pressure. The MACD here is negative, with the histogram below the signal line, pointing towards bearish momentum. The Stochastic Oscillator, however, offers a glimmer of hope for the bulls, with %K at 31.71 and %D at 18.98, showing a bullish signal as %K crosses above %D and emerging from oversold levels. This divergence between the MACD and Stochastic on the 4-hour chart is a key point of conflict. Crucially, the ADX on this timeframe rises to 10.71. This low ADX reading is particularly significant; it suggests a lack of directional strength and a market that is essentially ranging or choppy. Such conditions are often treacherous, as they can lead to false breakouts and whipsaws. The overall signal across the 4-hour chart leans towards a 'SELL', with only one 'BUY' signal and seven 'SELL' signals from the aggregated indicators.
The daily timeframe paints a clearer picture of a bearish trend, with an impressive 97% strength according to the provided data. The RSI is at 43.69, continuing the trend of neutral readings with a bearish bias. The MACD is positive, with the MACD line above the signal line, which is a bullish sign on the daily chart, creating further divergence with the shorter timeframes and the overall trend direction. The Stochastic Oscillator on the daily chart shows %K at 41.79 and %D at 58.46, indicating a bearish signal as %K is below %D and pointing downwards. The ADX on the daily chart strengthens to 29.39, confirming a strong downward trend. Despite the bearish signals from the ADX and Stochastic on the daily chart, the positive MACD adds a layer of complexity, suggesting that while the overarching trend might be down, there's underlying positive momentum that could challenge the bears if confirmed by price action.
Key Levels to Watch: The $1.33 Battleground
The immediate price action for GBPUSD is defined by its proximity to the $1.33 mark. On the 1-hour chart, immediate support is seen at $1.33291, followed by $1.33241 and $1.33207. Resistance, conversely, is located at $1.33401, $1.33464, and $1.33498. These tight levels highlight the intraday volatility and the narrow trading range the pair is currently confined within. A decisive break above the $1.33495 resistance on the hourly chart could signal a short-term bullish move, targeting higher levels. Conversely, a failure to hold the $1.33207 support might invite further selling pressure, pushing the pair towards the 4-hour support levels.
Looking at the 4-hour chart, the support structure is more robust, starting at $1.33284, then $1.33175, and crucially $1.33117. This $1.33117 level is particularly important; a close below it on this timeframe could confirm the bearish bias and open the door for a more significant decline. Resistance on the 4-hour chart is found at $1.33451, with subsequent hurdles at $1.33509 and $1.33618. The proximity of these levels to the current price means that any move could be swift. The daily support levels are more distant, beginning at $1.33093, followed by $1.32876, and then a more significant floor at $1.32565. On the resistance side, the daily chart shows potential upside targets at $1.33621, $1.33932, and $1.34149. Traders should pay close attention to how price reacts around the $1.33117 level on the 4-hour chart, as a break here could be a strong signal for the direction of travel.
The Trade Decision: Waiting for Confirmation
Given the current technical landscape for GBPUSD, characterized by a neutral hourly trend, a bearish 4-hour and daily trend, and critically low ADX readings across the board (12.17 on 1H, 10.71 on 4H, 29.39 on 1D), the market is best described as choppy and lacking clear direction. The ADX values, particularly the sub-15 readings on the shorter timeframes, indicate that there is no strong trend to follow, making entries based on current momentum risky. While the daily chart shows a strong downward trend (ADX 29.39), the conflicting signals from other indicators, such as the positive MACD on the daily and the oversold Stochastic on the 4-hour chart, introduce significant uncertainty. The 'WATCH_ZONE' decision score of 1/8 reflects this high degree of ambiguity. A valid trading setup is not present at this moment.
For a bullish setup to emerge, we would need to see a clear and sustained break above immediate resistance levels, coupled with confirmation from momentum indicators. Specifically, a daily close above the $1.33495 resistance on the 1-hour chart, or more significantly, a sustained move and close above the $1.33618 resistance on the 4-hour chart, would be required. This would need to be supported by bullish divergence on the RSI or a sustained upward cross on the MACD, ideally with an increasing ADX value indicating trend development. Without these conditions, any upward move is likely to be met with profit-taking or renewed selling pressure.
Conversely, for a bearish setup, the key is to watch for a decisive breakdown of support. A daily close below the critical $1.33117 support level on the 4-hour chart would be the primary trigger. This breakdown should ideally be accompanied by increased volume, a bearish cross on the MACD, and confirmation from the RSI moving lower towards oversold territory. The ADX would also need to show signs of increasing, confirming the development of a strong downward trend. Until such clear signals emerge, the prudent approach is to remain on the sidelines, manage risk diligently, and wait for the market to provide a more defined trading opportunity. Patience is paramount in these indecisive conditions; forcing trades often leads to losses.
Fundamental Undercurrents and Geopolitical Ripples
While the technical picture for GBPUSD is currently indecisive, fundamental and geopolitical factors continue to shape market sentiment. The US Dollar Index (DXY) is showing strength, trading around 99.8. This rise in the dollar, as indicated by its upward movement and strong ADX reading of 31.82 on the daily chart, typically exerts downward pressure on pairs like GBPUSD. The Federal Reserve's stance on inflation versus employment continues to be a key driver. Recent reports suggest a growing emphasis on inflation concerns by Fed officials, which could support a stronger dollar if it implies a more hawkish stance or a slower pace of rate cuts. This narrative aligns with the Forex news mentioning the dollar potentially rebounding as the Fed eyes inflation over jobs.
The UK economic landscape also plays a crucial role. While specific high-impact economic data releases for GBP were not detailed with dates in the provided calendar, the general context of 'stagflation fears' mentioned in relation to AUD/JPY could, by extension, create a cautious sentiment around Sterling. If UK inflation remains stubbornly high while growth falters, it could lead to a less favorable outlook for the British Pound. The recent news mentioning GBP/USD trading slightly higher at 1.3345 after snapping a three-day losing streak, as market sentiment improves after geopolitical jitters, indicates that sentiment can shift rapidly. However, the underlying economic data and the Bank of England's policy path remain critical determinants of Sterling's long-term strength.
Geopolitical tensions, particularly those affecting oil prices and global risk appetite, cannot be ignored. The news regarding potential US government stress-testing for $200 oil prices amid escalating war risk highlights the sensitivity of markets to supply disruptions. Such events can lead to a 'risk-off' sentiment, often benefiting the US dollar as a safe-haven asset, further pressuring GBPUSD. Conversely, if geopolitical jitters subside and risk sentiment improves, it could offer some relief to Sterling. The current environment demands a careful balance between monitoring the technical signals and understanding the broader macroeconomic and geopolitical forces at play. The interplay between the Fed's inflation focus, the UK's economic health, and global risk sentiment will likely dictate whether GBPUSD can break free from its current neutral zone.
Trading Scenarios: Mapping the Path Forward
Bearish Scenario: Testing Lower Support
65% ProbabilityNeutral Scenario: Consolidation Around $1.33
25% ProbabilityBullish Scenario: Reclaiming Higher Ground
10% ProbabilityFrequently Asked Questions: GBPUSD Analysis
What happens if GBPUSD breaks below the $1.33117 support level on the 4-hour chart?
A close below $1.33117 would invalidate the neutral stance and likely trigger the bearish scenario. This could lead to a swift move towards the daily support levels at $1.33093 and potentially $1.32876, especially if accompanied by increased volume and momentum confirmation.
Should I consider buying GBPUSD at current levels around $1.33 given the mixed signals?
Buying at current levels around $1.33 is not recommended due to the indecisive market conditions and conflicting indicator signals. A more prudent approach would be to wait for a clear bullish trigger, such as a sustained break above $1.33618 resistance with confirmation, or a bounce from a clearly defined support level with bullish divergence.
Is the RSI at 45.42 on the 4-hour chart a sell signal for GBPUSD?
An RSI reading of 45.42 on the 4-hour chart indicates a neutral-to-bearish bias, but it's not a standalone sell signal. While it suggests some selling pressure, it's crucial to combine this with other indicators. A confirmed sell signal would require the RSI to move lower, ideally accompanied by bearish crosses in MACD and Stochastic, and a break below key support levels.
How might the Fed's focus on inflation impact GBPUSD this week?
If the Fed continues to signal a strong focus on inflation, it could bolster the US Dollar (DXY), currently around 99.8. This would likely create headwinds for GBPUSD, potentially pushing it lower towards its support levels as the dollar strength dominates. Traders should monitor any Fed commentary for clues on future monetary policy.
The Path Forward: Patience and Precision
The GBPUSD pair is currently in a state of technical flux, trading around the critical $1.33 level. The confluence of neutral to bearish technical indicators, weak trend strength as shown by low ADX readings, and the overarching influence of the strengthening US Dollar creates a challenging environment for traders. The market is signaling caution, and clear directional conviction is absent across multiple timeframes. The most probable outcome in the short term appears to be continued consolidation or a test of lower support levels if the bearish sentiment prevails. However, a decisive move requires a catalyst – a clear break of key support or resistance levels, confirmed by momentum indicators and potentially influenced by upcoming economic data or central bank commentary.
| Indicator | Value | Signal | Interpretation |
|---|---|---|---|
| RSI (14) | 45.42 | Neutral | Slightly bearish bias, not oversold |
| MACD Histogram | -0.001 | Bearish | Negative momentum on 4H |
| Stochastic | K:31.71, D:18.98 | Bullish | Emerging from oversold, but potential for reversal |
| ADX | 10.71 | Weak Trend | Choppy market, lack of direction |
| Bollinger Bands | Middle Band | Watch | Price testing middle band on 4H |
Track markets in real-time
AI-powered analysis, technical indicators and real-time price data.
Join Our Telegram Channel
Breaking market news, AI analysis and trading signals instantly.
Join Channel