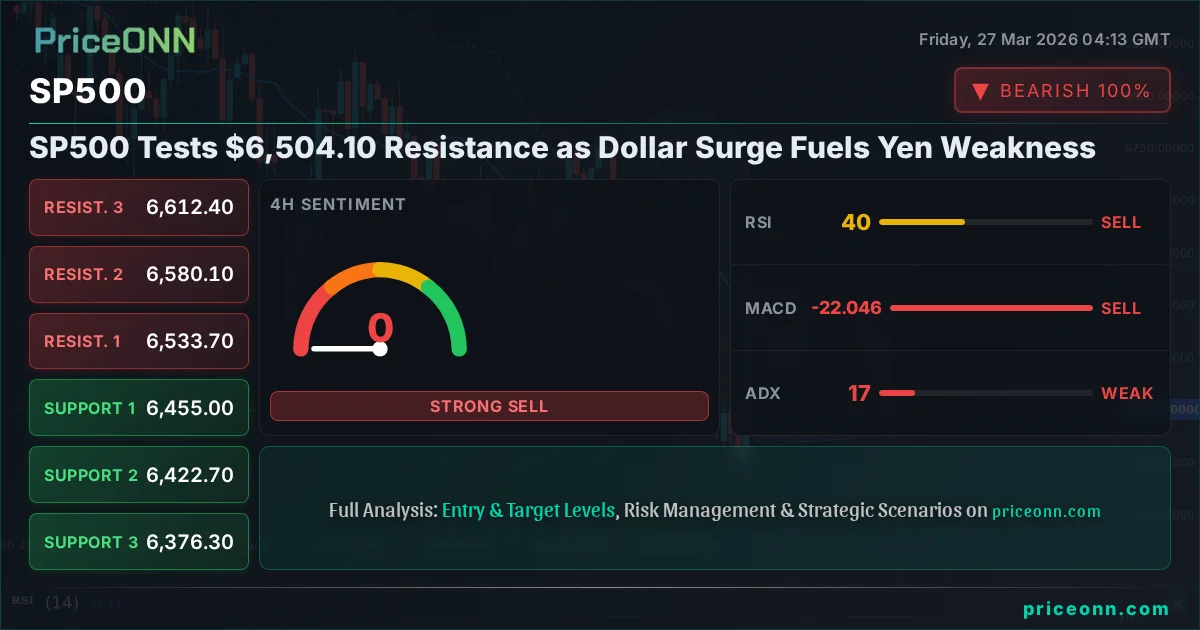
SP500 Tests $6,504.10 Resistance as Dollar Surge Fuels Yen Weakness
SP500 faces resistance at $6,504.10 amid a surging Dollar Index and accelerating Yen weakness. Technical indicators suggest caution.
The S&P 500 is currently testing a significant resistance level around $6,504.10, a move unfolding against a backdrop of a strengthening US Dollar Index (DXY) and accelerating weakness in the Japanese Yen. This confluence of factors paints a complex picture for risk assets, demanding a closer look at the underlying technical signals and macroeconomic drivers. Having tracked the S&P 500 through its recent rallies and pullbacks, it's clear that while momentum has been present, the underlying strength required for a sustained breakout remains questionable, especially with key indicators flashing mixed signals across different timeframes.
- The S&P 500 is currently facing resistance at the $6,504.10 level, with the 4H chart showing a strong downtrend signal.
- The US Dollar Index (DXY) is pushing higher, currently at 99.64, which typically exerts downward pressure on risk assets like the S&P 500.
- USD/JPY is nearing the critical 160.00 level, trading at 159.617, driven by Yen weakness and Dollar strength.
- Geopolitical tensions and a risk-averse environment are contributing to the Dollar's safe-haven appeal.
Navigating the Resistance at $6,504.10
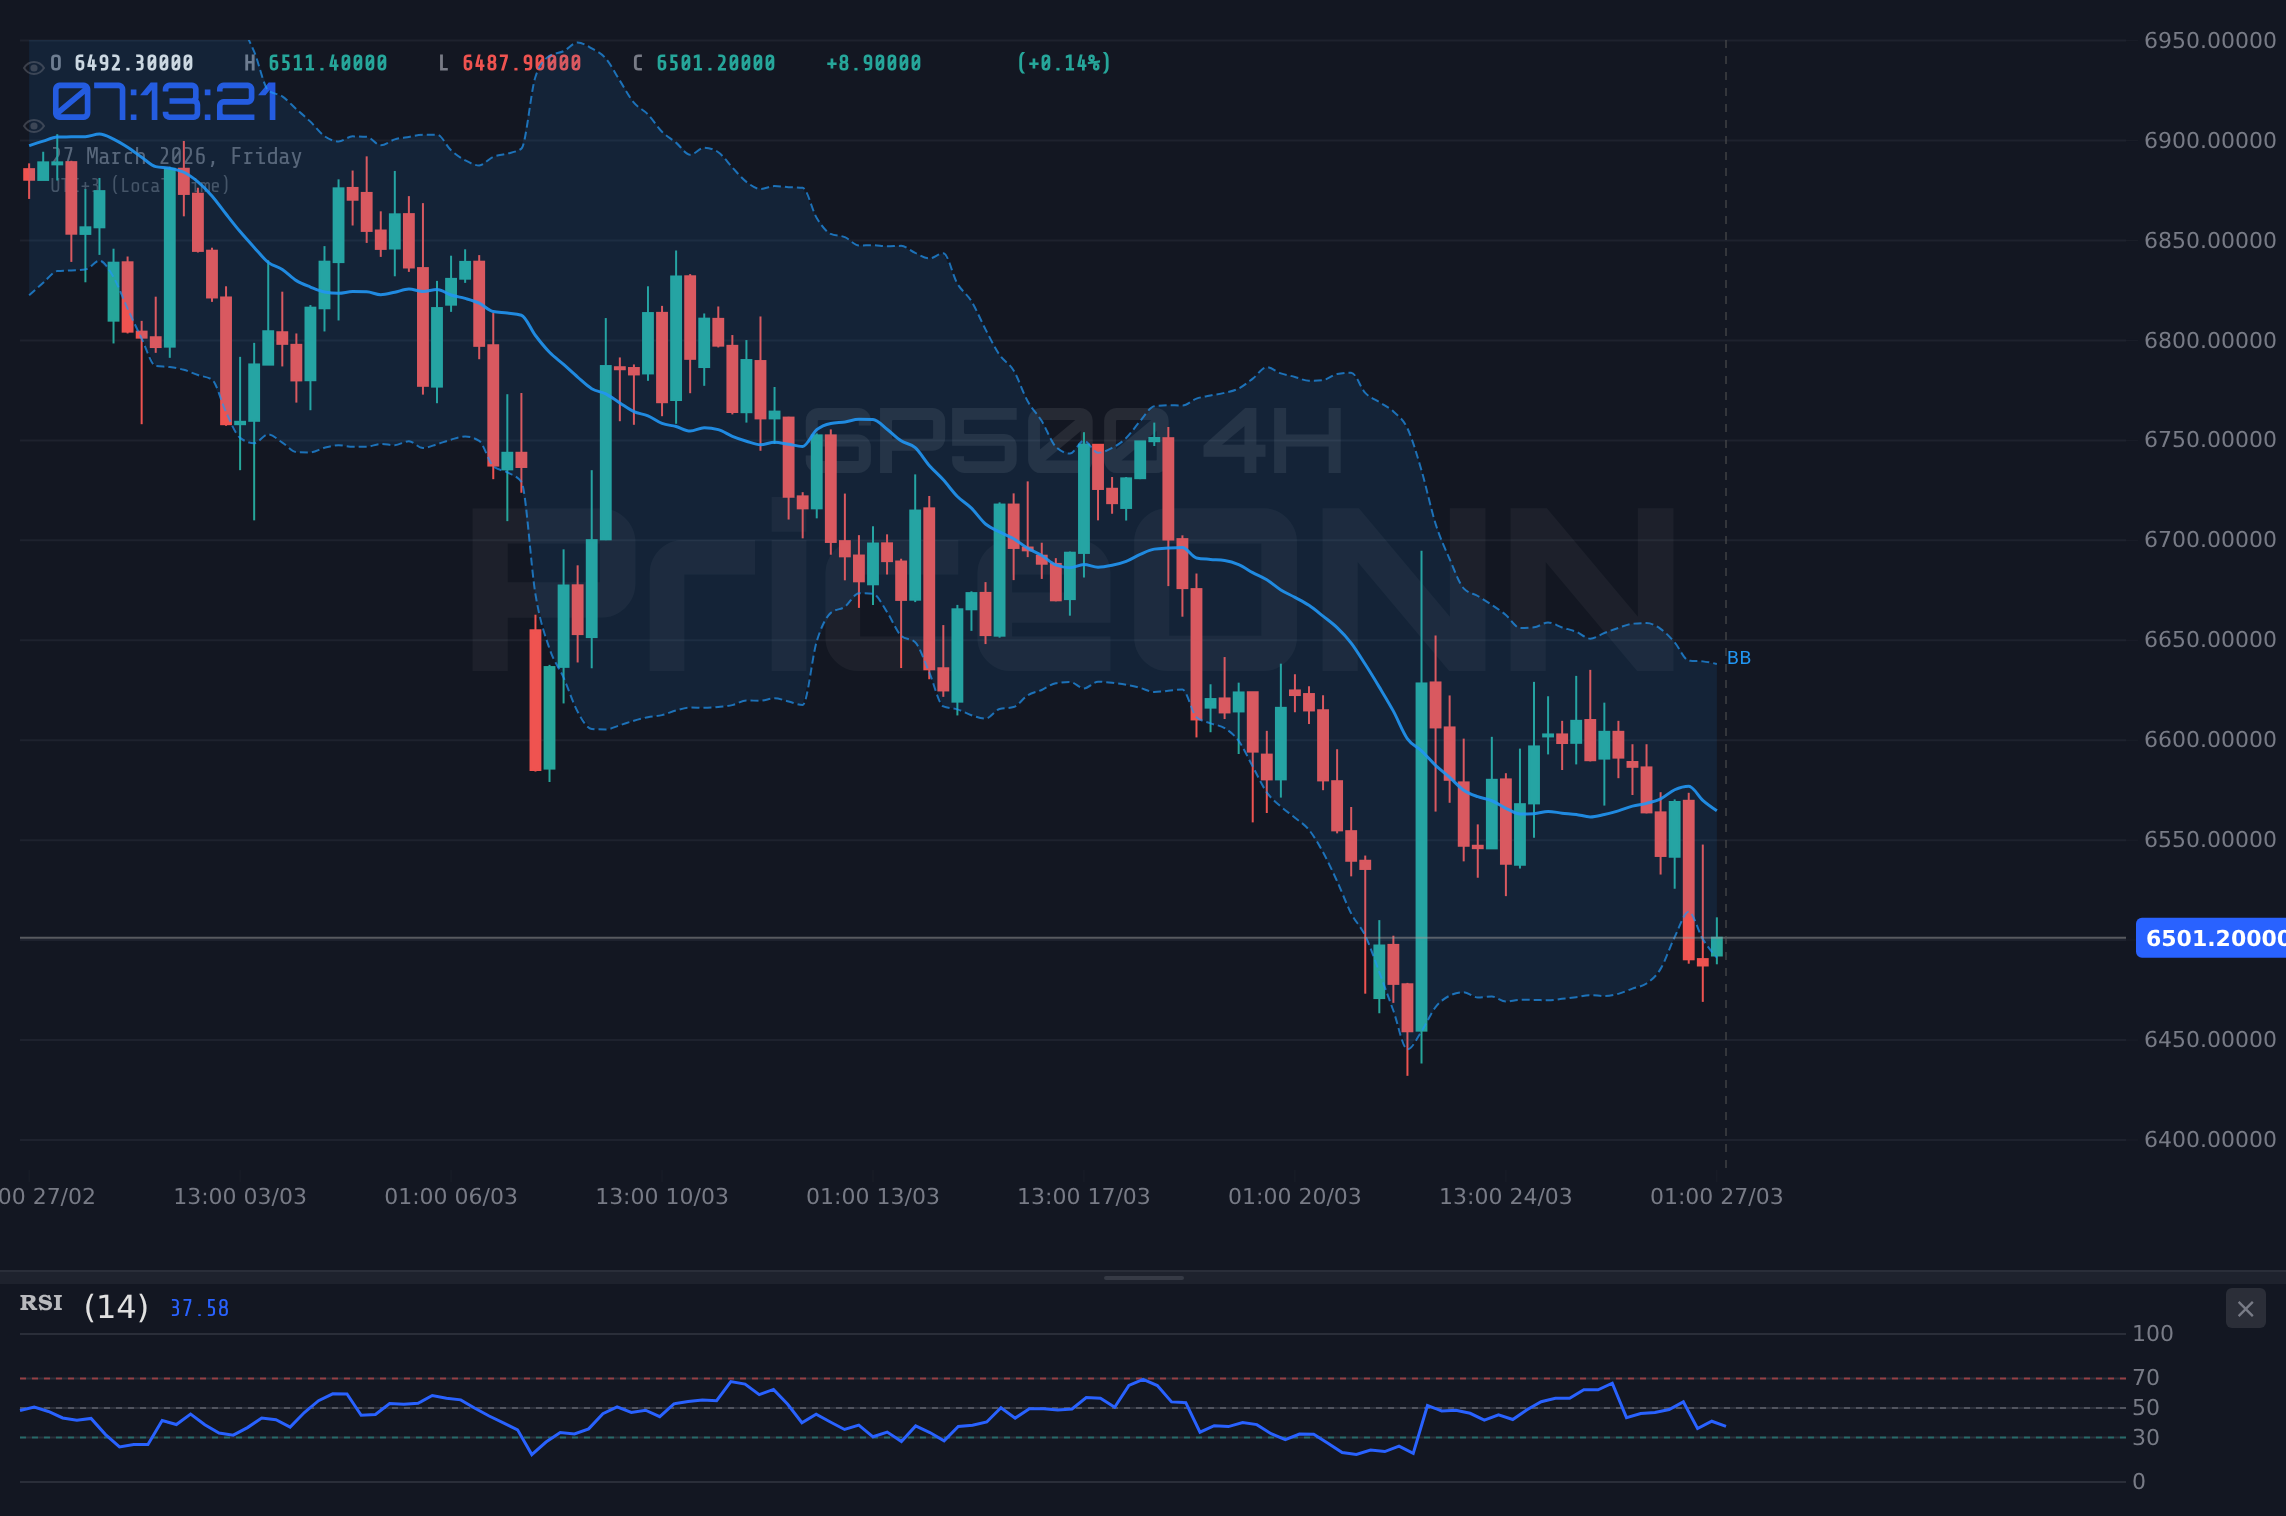
The S&P 500's ascent towards the $6,504.10 mark is a critical juncture. On the 1-hour chart, the trend is currently neutral with a power of 50%, but the RSI at 42.34 suggests a leaning towards downward momentum, despite a positive MACD reading. This creates a short-term tug-of-war. However, the 4-hour and daily charts paint a more definitive picture. The 4-hour chart shows a strong downtrend (94% power) with RSI at 40.1 and ADX at 17.38, indicating a weak trend but a prevailing bearish sentiment. The daily timeframe reinforces this, with a 99% power downtrend signal, RSI at 33.99, and a strong ADX of 47.12. This technical divergence between the short-term and longer-term outlooks suggests that while a brief push higher might occur, the path of least resistance on the daily chart remains downwards. The key takeaway here is that the current price action around $6,504.10 is not a sign of inherent strength, but rather a test of a level that longer-term indicators suggest should hold as resistance.
Dollar's Dominance and the Yen's Plight
The US Dollar Index (DXY) is currently trading at 99.64, exhibiting a strong uptrend on the 1-hour and daily charts, with power levels of 91%. This strength is a significant factor influencing global markets. A rising dollar typically correlates with pressure on commodities and emerging market currencies, and it also plays a crucial role in pairs like USD/JPY. The USD/JPY pair is hovering around 159.617, a level that has seen significant attention, pressing hard against the psychological 160.00 mark. The daily chart for USD/JPY shows a strong uptrend (81% power), with RSI at 60.16 indicating a strong but not yet overbought condition. This upward momentum in USD/JPY, fueled by a strong dollar and a weakening yen, suggests a broader risk-on sentiment in specific currency pairs, but this doesn't necessarily translate into broad equity market strength. In fact, the dollar's strength often acts as a headwind for the S&P 500, as it can make US exports more expensive and signal a global flight to safety, which would typically see US equities face headwinds.
Geopolitical Undercurrents and Inflationary Fears
Escalating geopolitical tensions, particularly in the Middle East, are undeniably contributing to the dollar's safe-haven appeal. Reports indicate that Iraq's economy is facing a severe downturn due to a blockade of the Strait of Hormuz, which has halted oil exports and led to a 70% plunge in revenues. This blockade, coupled with broader energy security worries and grid vulnerability fears, is sending ripples through global energy markets. Brent crude oil is trading at $104.85, showing a strong daily uptrend (100% power), while WTI is at $94.06 with a very strong daily uptrend (98% power). These rising oil prices have direct implications for inflation expectations. Higher energy costs can feed into broader inflation, which in turn influences central bank policy. While the Fed's immediate reaction to such pressures is complex – balancing inflation concerns with growth risks – a sustained rise in oil prices could force their hand, potentially leading to a more hawkish stance, further supporting the dollar and pressuring risk assets like the S&P 500.
Technical Divergence: What the Indicators Are Saying
The technical indicators across multiple timeframes for the S&P 500 present a somewhat contradictory narrative, demanding careful interpretation. On the 1-hour chart, the trend is neutral, but the RSI at 42.34 is trending downwards, suggesting some loss of immediate upward momentum. The MACD is positive, but the Stochastic K line is above the D line, indicating a potential for further upside in the very short term. However, this optimism is quickly tempered when we move to the 4-hour and daily charts. The 4-hour chart shows a strong downtrend with an ADX of 17.38 – not a strong trend yet, but clearly bearish. The RSI is at 40.1, and the Stochastic shows a bearish signal (%K < %D). The daily chart is even more definitive: a 99% power downtrend, RSI at 33.99, and a robust ADX of 47.12, confirming a strong bearish trend. The Bollinger Bands on the 4H and daily charts are also below the middle band, reinforcing the bearish outlook. This divergence suggests that any short-term rallies are likely to be met with selling pressure as the market adheres to the stronger, longer-term bearish trend.
The SP500 Today Analysis: A Battle for Control
This SP500 today analysis reveals a market at a critical crossroads. The index is currently trading at $6,504.10, a level that has historically acted as a significant pivot. The strength of the US dollar, currently at 99.64 on the DXY, is a major headwind. When the dollar strengthens, it often correlates with a decrease in risk appetite, putting pressure on US equities. This is further exacerbated by the accelerating weakness in the Japanese Yen, with USD/JPY approaching 160. While this might seem like a sign of global economic confidence, it's often driven by a 'risk-off' sentiment where investors seek the perceived safety of the dollar, leading to outflows from other markets. The current technical setup on the daily chart, with its strong downtrend signal and high ADX value, suggests that sellers are in a dominant position. Any upward moves are likely to be seen as opportunities for institutions to re-enter short positions at more favourable prices. The price action needs to decisively break and hold above the $6,504.10 resistance, confirmed by increasing volume and positive daily closes, to even consider a bullish reversal.
What the MACD Signal Tells Us About SP500 Trend Analysis
The MACD indicator on the S&P 500 offers a nuanced view when combined with other signals. On the 1-hour chart, the MACD is showing positive momentum, suggesting that the recent upward push might have some short-term legs. However, this is contradicted by the RSI at 42.34, which indicates bearish pressure. More importantly, on the 4-hour and daily charts, the MACD is either negative or showing weakening positive momentum below the signal line, reinforcing the dominant bearish trend. This conflict between the short-term MACD and the longer-term bearish signals is typical of markets in transition or consolidation phases. For a true bullish signal to emerge on the daily chart, we would need to see the MACD cross above its signal line with increasing histogram values, coupled with an RSI moving decisively above 50 and breaking through key resistance levels. Until then, the MACD's current readings, especially on higher timeframes, should be interpreted with extreme caution, leaning towards the prevailing trend.
SP500 Support and Resistance Levels: A Critical Battleground
The S&P 500 finds itself at a critical juncture defined by its support and resistance levels. The immediate resistance is clearly at the $6,504.10 mark, the current price. Above this, key resistance levels are identified at $6,510.30 (R1), $6,580.10 (R2), and $6,647.03 (R3) on the daily chart. These are the levels that bulls need to conquer for any significant upward continuation. On the flip side, the support structure is paramount for the bears to defend. The first level of support (S1) is at $6,483.00 on the 1H chart, followed by $6,455.00 (S1 on 4H) and $6,438.27 (S1 on Daily). Deeper support lies at $6,376.30 (S3 on 4H) and $6,309.37 (S3 on Daily). The ADX values across timeframes (17.61 on 1H, 17.38 on 4H, 47.12 on Daily) highlight a weak trend in the short-to-medium term, but a very strong trend on the daily. This suggests that while intraday fluctuations might be erratic, the daily trend is firmly established as bearish. A decisive break below the $6,438.27 daily support would likely trigger further selling, targeting the lower levels.
SP500 Price Forecast: Caution Amidst Dollar Strength
Forecasting the SP500's next move requires a sober assessment of the current technical and fundamental landscape. The prevailing bearish trend on the daily chart, supported by a strong ADX of 47.12 and RSI below 40, suggests that any upside is likely to be capped. The current price of $6,504.10 is being tested as resistance, and with the DXY at 99.64 and USD/JPY approaching 160, the macro environment favors a stronger dollar and potentially weaker equities. The SP500 price forecast, therefore, leans towards a downside scenario unless a significant shift occurs. A daily close below $6,438.27 would be a strong bearish signal, potentially opening the door for a rapid descent towards $6,376.30 and even $6,309.37. Conversely, a sustained break and close above $6,510.30, confirmed by strong volume and positive RSI momentum, would be needed to invalidate the current bearish outlook and signal a potential trend change. Until then, caution is the prevailing sentiment.
SP500 Trading Signals: Waiting for Confirmation
The current trading signals for the S&P 500 are mixed, leaning bearish on higher timeframes. The 1-hour chart offers a neutral-to-slightly-bullish short-term outlook, but the daily signals are overwhelmingly bearish, driven by strong trend strength indicators like ADX. The RSI readings across all timeframes are below 50, indicating a lack of bullish conviction. Stochastic indicators are also providing conflicting signals, with oversold conditions on lower timeframes and bearish crossovers on others. This complexity means that traders should exercise patience and wait for clearer signals. The primary risk right now is entering long positions prematurely, only to be caught in a trend continuation. The key level to watch remains $6,504.10. A failure to break decisively above this level, especially with the DXY strengthening and geopolitical risks remaining elevated, suggests that shorting opportunities on pullbacks towards support levels might be more prudent. The market is not yet offering a high-probability bullish setup; it's a battleground where bears currently hold the advantage on the daily chart.
SP500 Market Sentiment: Risk Aversion Dominates
The prevailing market sentiment appears to be shifting towards risk aversion, largely driven by the strengthening dollar and ongoing geopolitical concerns. The surge in the US Dollar Index (DXY) to 99.64, coupled with the rapid ascent of USD/JPY towards 160, indicates a global preference for safety and dollar-denominated assets. This sentiment is often a precursor to weakness in equity markets, as investors rotate out of riskier assets like stocks and into perceived safe havens. The fact that Brent crude is trading at $104.85 and WTI at $94.06, both showing strong uptrends, adds another layer of complexity, suggesting potential inflationary pressures that could influence central bank policy and further impact market sentiment. While the S&P 500 is currently testing resistance at $6,504.10, the underlying sentiment, as reflected by the daily chart's bearish indicators (ADX 47.12, RSI 33.99), suggests that optimism is waning. Traders are likely to be cautious, waiting for clearer direction rather than chasing short-term rallies.
Bearish Scenario: Trend Continuation
65% ProbabilityNeutral Scenario: Consolidation Around Resistance
25% ProbabilityBullish Scenario: Breakout Above Resistance
10% ProbabilityFrequently Asked Questions: SP500 Analysis
What happens if SP500 breaks below $6,438.27 support?
A daily close below $6,438.27 would invalidate the neutral scenario and strongly signal a continuation of the bearish trend. This could lead to rapid declines towards the next support levels at $6,376.30 and potentially $6,309.37.
Should I buy SP500 at current levels around $6,504.10 given the mixed signals?
Buying at current levels near $6,504.10 is risky given the strong bearish signals on the daily chart (ADX 47.12, RSI 33.99). A higher probability setup would involve waiting for a confirmed break above $6,510.30 or a pullback to a more defined support level with clear bullish confirmation.
Is RSI at 33.99 a sell signal for SP500 right now?
An RSI reading of 33.99 on the daily chart indicates oversold conditions are approaching, but it is not an immediate sell signal on its own. It confirms the bearish momentum, suggesting that further downside is possible before any significant bounce occurs. Confirmation would require a break of key support levels.
How will the strengthening DXY at 99.64 affect SP500 this week?
The strengthening DXY at 99.64 typically exerts downward pressure on US equities like the S&P 500. This is often linked to increased global risk aversion and a preference for dollar-denominated assets, potentially limiting upside for the index until this trend reverses.
| Indicator | Value | Signal | Interpretation |
|---|---|---|---|
| RSI (14) | 33.99 | Bearish | Daily RSI below 40 signals strong downward momentum. |
| MACD Histogram | -15.20 | Bearish | Negative MACD histogram indicates bearish momentum. |
| Stochastic | K=29.21, D=31.64 | Bearish | Bearish crossover in Stochastic suggests further downside. |
| ADX | 47.12 | Bullish Trend Strength | ADX above 40 confirms a strong trend (in this case, bearish). |
| Bollinger | Middle Band Break | Bearish | Price closing below the middle band on daily chart. |
Track markets in real-time
AI-powered analysis, technical indicators and real-time price data.
Join Our Telegram Channel
Breaking market news, AI analysis and trading signals instantly.
Join Channel