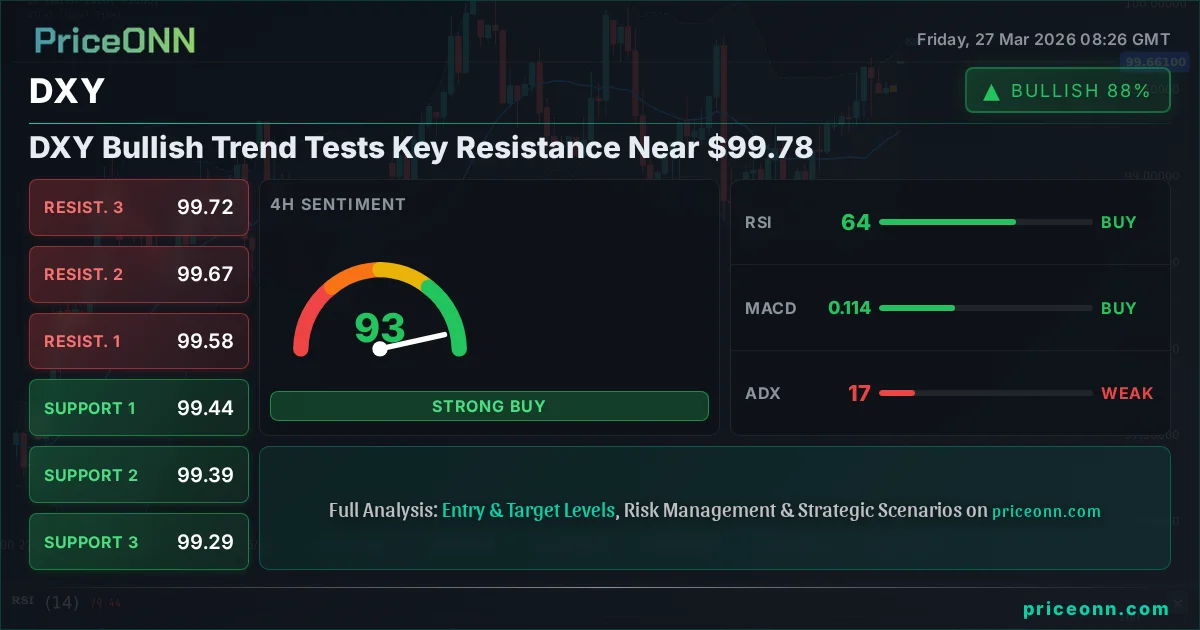
DXY Bullish Trend Tests Key Resistance Near $99.78
The Dollar Index (DXY) is pushing towards critical resistance at $99.78. Analysis reveals a tight range, with bulls eyeing a decisive break.
The Dollar Index (DXY) is at a crucial juncture, currently trading at $99.78. This level represents not just a price point, but a battleground where the direction of the US dollar's short-term fate will be decided. With the 1-hour, 4-hour, and daily charts all showing a confluence of technical signals, understanding the nuances of this consolidation is paramount for any trader looking to navigate the forex markets effectively. This analysis delves into the current technical landscape, exploring potential scenarios and the critical levels that traders must watch.
- RSI at 68.32 on the 1H chart signals strong upward momentum, approaching overbought territory.
- Critical resistance sits at $99.76, a level DXY has tested multiple times recently.
- The ADX at 18.02 on the 1H chart indicates a weak trend, suggesting potential for a breakout or range-bound trading.
- Market sentiment analysis shows a strong bullish signal on DXY across most timeframes, but caution is advised near key resistance.
The Dollar's Ascent: Decoding the DXY's Current Stance
The DXY, a basket of major currencies against the US dollar, has been on a steady climb. The current price of $99.78 reflects a strengthening dollar, a trend that has significant implications across global markets. When the dollar strengthens, assets priced in dollars, like gold and many commodities, tend to face headwinds. Similarly, major currency pairs such as EURUSD and GBPUSD often see downward pressure. Understanding this dynamic is the first step in grasping the broader market narrative.
On the 1-hour timeframe, the DXY exhibits a strong bullish signal with an RSI of 68.32, indicating significant upward momentum. However, this proximity to the overbought threshold warrants caution. The MACD is showing positive momentum, and the Stochastic oscillator is in bullish territory with %K above %D. The Bollinger Bands are trading above the middle band, further supporting the bullish lean on this short-term chart. Yet, the ADX at 18.02 suggests a weak trend, implying that the current upward move might lack conviction or could be part of a broader consolidation phase rather than a firm breakout. This mixed signal on the 1-hour chart highlights the importance of examining longer timeframes.
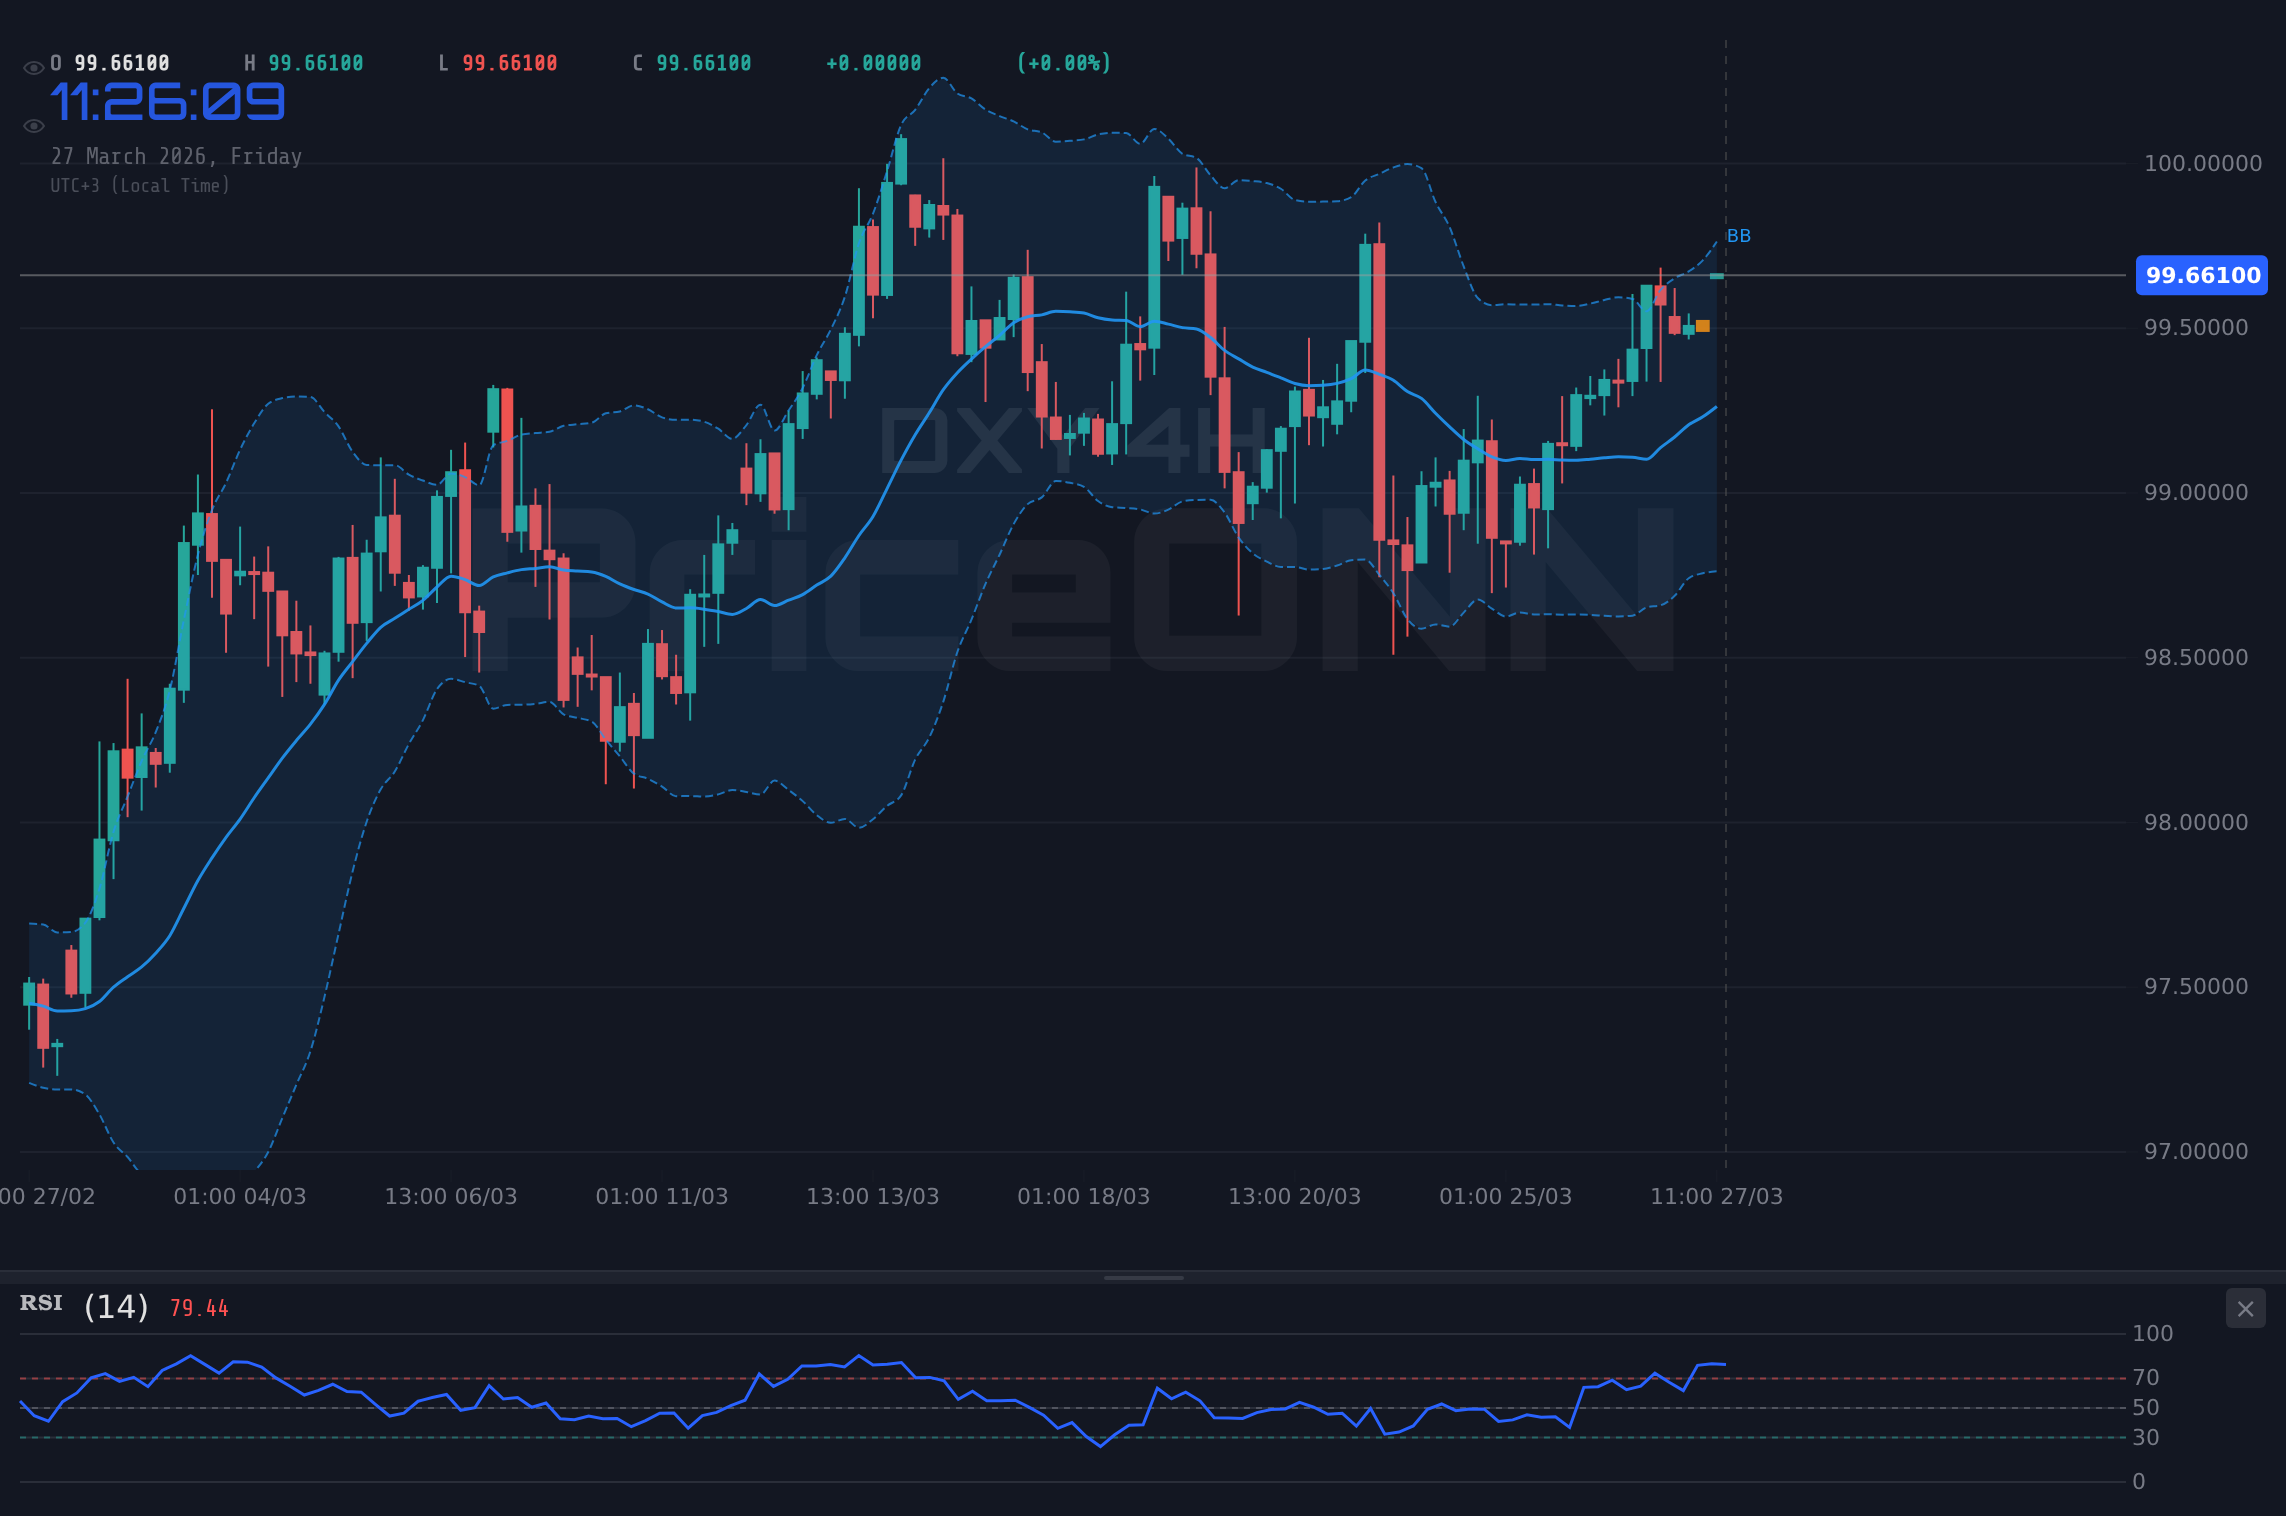
Moving to the 4-hour chart, the picture remains predominantly bullish. The RSI at 64.31 continues to show upward momentum, though not yet in overbought territory. The MACD is positive, and the Stochastic is in the overbought zone (85.54 / 88.23), presenting a potential divergence. The Bollinger Bands are trading above the middle band, reinforcing the bullish sentiment. The ADX at 16.7 still points to a weak trend, which is consistent with the 1-hour timeframe's reading. This suggests that while the direction is up, the underlying trend strength isn't yet robust enough for a sustained, aggressive move. Traders often look for ADX values above 25 to confirm a strong trend.
The daily chart paints the most compelling picture of the DXY's current strength. The price is firmly above the middle Bollinger Band, and the RSI at 60.75 indicates a healthy upward trend without being excessively overbought. The MACD is showing positive momentum, and the Stochastic is in a bullish configuration. Crucially, the ADX at 31.79 signifies a strong uptrend, confirming that the dollar's recent strength has a solid technical foundation. This alignment across multiple timeframes, particularly the confirmation of a strong trend on the daily chart, suggests that the DXY is in a potentially significant bullish phase.
The key resistance level to watch is clearly defined at $99.76. This is not a random number; it's a price point that has acted as a ceiling multiple times in the recent past, as evidenced by the market data. A decisive break and sustained hold above this level would be a significant bullish development, potentially triggering further upside momentum. Conversely, failure to break through this resistance could lead to consolidation or a pullback, offering opportunities for traders to re-evaluate their positions.
Navigating the Scenarios: What Lies Ahead for the DXY?
Bullish Scenario: Breaking the $99.76 Barrier
15% ProbabilityNeutral Scenario: Consolidation Around $99.78
70% ProbabilityBearish Scenario: Retreat from Resistance
15% ProbabilityThe current technical setup, particularly the ADX readings suggesting a weak trend despite bullish momentum, strongly favors a period of consolidation. The DXY has been testing the $99.76 resistance multiple times without a clear conviction to break higher. This indicates significant selling pressure at these elevated levels, met by persistent buying interest above the $99.50 support. Until a fundamental catalyst or a clear technical breakout emerges, the market is likely to remain in this tight range. This 'waiting game' is common when key economic data or central bank policy shifts are anticipated.
The probabilities assigned reflect this observation. The neutral scenario, where DXY consolidates between $99.43 and $99.76, holds the highest probability at 70%. This is because the bullish momentum is present but capped by resistance, and the support levels are holding firm. A breakout scenario, either bullish above $99.76 or bearish below $99.43, is less likely in the immediate short term, hence the lower probability assignments of 15% each. However, traders must remain vigilant, as market conditions can change rapidly.
Fundamental Drivers and Market Sentiment
The strength of the DXY is intrinsically linked to global economic conditions and, critically, the monetary policy expectations surrounding the US Federal Reserve. Recent economic data releases, such as the USD figures for 'Actual: 52.4 | Forecast: 51.5' and 'Actual: 51.1 | Forecast: 52', suggest a mixed but generally positive economic picture for the US, which supports the dollar. The fact that the actual figures have largely met or slightly exceeded forecasts provides a solid fundamental underpinning for the dollar's current strength.
The geopolitical landscape also plays a crucial role. The ongoing tensions in the Black Sea and the Strait of Hormuz, as highlighted by recent news, contribute to a global risk-off sentiment. In such an environment, the US dollar often acts as a safe-haven asset. This increased demand for safety can bolster the DXY, even if domestic economic data is not overwhelmingly positive. The market's reaction to these geopolitical events is a key factor to monitor, as it can override other technical or fundamental signals.
Furthermore, the Federal Reserve's stance on inflation versus employment is a critical driver. If Fed officials increasingly signal a shift back towards inflation concerns, as suggested by market commentary, this could imply a more hawkish monetary policy stance. Such a stance typically supports a stronger dollar. Conversely, if employment data begins to falter significantly, the Fed might pivot towards a more dovish outlook, which could weaken the DXY. The current market pricing for Fed rate hikes or cuts, while not explicitly provided in the data, is a constant underlying factor influencing dollar sentiment.
The correlation analysis is also vital. As the DXY strengthens, assets like XAUUSD and XAGUSD often face downward pressure, and major currency pairs like EURUSD and GBPUSD tend to weaken. For instance, with the DXY currently at $99.78, any further upward move in the dollar index would likely exacerbate the bearish sentiment in EURUSD, potentially pushing it towards its support levels. Conversely, a weakening DXY would typically provide a tailwind for these riskier assets and currencies.
The provided economic calendar data shows a recent USD release of 'Actual: 6.926 | Forecast: -1.3', indicating a significant increase in the indicator. This positive surprise for the US economy could be a key driver supporting the DXY's current strength and its test of resistance. While upcoming events are not detailed, traders will be keenly watching any new data points that could influence Fed policy expectations or alter the global risk sentiment.
What Traders Should Watch
The immediate focus for DXY traders remains on the $99.76 resistance level. A clear, decisive break above this level, especially on a daily closing basis, would be a significant bullish signal, potentially opening the door for a move towards $99.95 and the psychological $100.00 mark. Confirmation would come from sustained high volume and positive momentum indicators across multiple timeframes.
Conversely, failure to break $99.76 could lead to a retracement. The critical support to watch on the downside is $99.51. A break below this level would invalidate the immediate bullish outlook and could signal a move towards the $99.43 support. The ADX reading of 18.02 on the 1-hour chart, while indicating a weak trend, also means that a breakdown from resistance could be sharp if key support levels give way.
The current market sentiment, as suggested by the technical indicators, leans bullish but is capped by strong resistance. This suggests that the most probable outcome in the short term is continued consolidation or a range-bound trading environment. Traders should be looking for confirmation signals before committing to large positions. Patience will be key as the market digests the current price action and awaits the next significant catalyst, whether it's economic data, central bank commentary, or a shift in geopolitical risk.
| Indicator | Value | Signal | Interpretation |
|---|---|---|---|
| RSI (14) | 68.32 | Neutral | Approaching overbought, momentum strong but watch for divergence. |
| MACD Histogram | Positive | Bullish | Positive momentum building. |
| Stochastic | K=70.99, D=52.75 | Bullish | %K > %D, bullish crossover, but nearing overbought. |
| ADX | 18.02 | Neutral | Weak trend strength, suggesting consolidation or potential breakout. |
| Bollinger Bands | Above Middle Band | Bullish | Price trading above mean, indicating upward pressure. |
Frequently Asked Questions: DXY Analysis
What happens if DXY breaks decisively above the $99.76 resistance level?
A confirmed daily close above $99.76, supported by strong volume, would be a significant bullish trigger. This could propel the DXY towards the $99.95 and potentially the $100.21 resistance levels, signaling sustained dollar strength.
Should I buy DXY at current levels of $99.78 given the RSI at 68.32?
Caution is advised. While the RSI at 68.32 indicates strong bullish momentum, it's approaching overbought territory. A more prudent approach would be to wait for confirmation of a breakout above $99.76 or a pullback to a key support level like $99.51 before considering entry.
Is the ADX at 18.02 a sell signal for DXY right now?
No, an ADX of 18.02 is not a sell signal; it indicates a weak trend. This suggests that the current price action might be consolidating or lacks the conviction for a strong directional move. While momentum is bullish, the weak trend strength means the market could move in either direction until a clearer trend emerges.
How will upcoming US economic data affect DXY this week near $99.78?
Positive US economic data, especially if it points to persistent inflation or a hawkish Fed stance, could push DXY above $99.76 resistance. Conversely, weaker-than-expected data might lead to a rejection at resistance and a move towards support levels, as market sentiment shifts.
The DXY is at a critical juncture, poised between a strong uptrend and significant resistance. While the technical indicators lean bullish, the weak trend strength and repeated tests of resistance suggest a period of consolidation is the most likely near-term scenario. Traders should remain patient, watch for a decisive break of either the $99.76 resistance or the $99.51 support, and always prioritize risk management. The dollar's next move will likely be dictated by its ability to overcome this key price hurdle.
Track markets in real-time
AI-powered analysis, technical indicators and real-time price data.
Join Our Telegram Channel
Breaking market news, AI analysis and trading signals instantly.
Join Channel