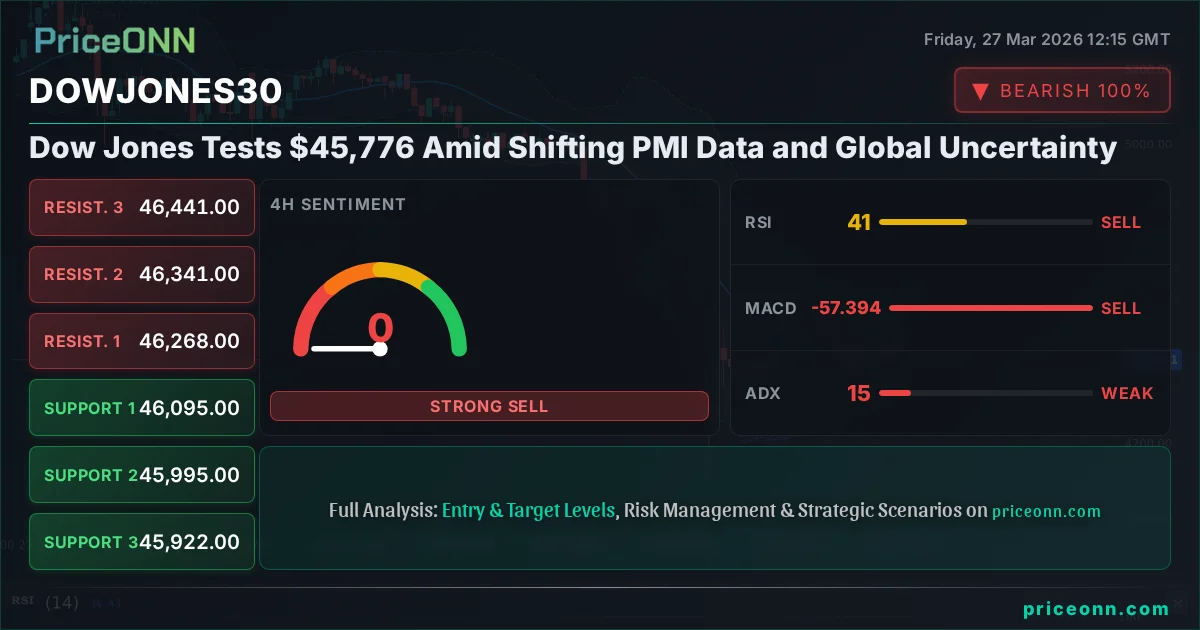
Dow Jones Tests $45,776 Amid Shifting PMI Data and Global Uncertainty
The Dow Jones Industrial Average hovers around $45,776 as investors digest mixed PMI figures and a strengthening US Dollar Index (DXY). Technical indicators suggest caution, with ADX pointing to choppy conditions.
The Dow Jones Industrial Average is currently navigating a critical juncture around the $45,776 level, a price point that demands close attention from traders and investors alike. This pivotal moment arrives amidst a backdrop of conflicting economic signals, most notably the latest Purchasing Managers' Index (PMI) data, and a palpable shift in global risk sentiment, underscored by the Dollar Index's (DXY) upward trajectory. The intricate dance between these fundamental drivers and the underlying technical landscape paints a complex picture, suggesting that while opportunities may arise, a disciplined approach is paramount. This analysis delves into the confluence of factors shaping the Dow's immediate future, examining the technical indicators and macroeconomic undercurrents that are likely to dictate its next move.
- The Dow Jones Industrial Average is currently trading around $45,776, showing weakness across multiple timeframes.
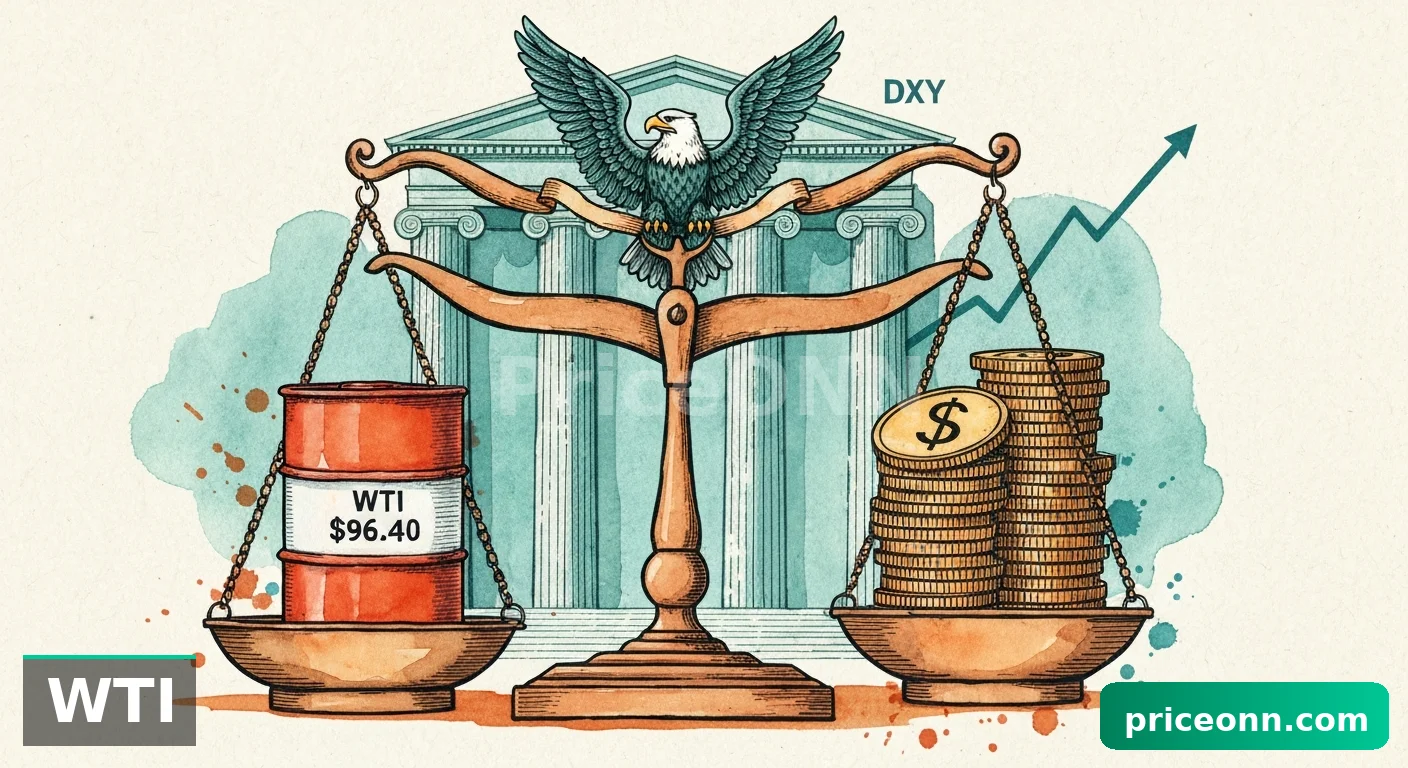
- The latest USD PMI data showed a reading of 52.4, exceeding the forecast of 51.5, supporting a stronger dollar.
- The US Dollar Index (DXY) is firm, hovering near 99.91, which typically exerts downward pressure on indices like the Dow Jones.
- Technical indicators on the 4-hour chart show an ADX of 14.71, signaling a weak trend and potentially choppy market conditions, making decisive directional trades risky.
- Despite short-term weakness, the long-term trend for the Dow Jones remains a subject of debate, with key support levels at $45,771.33 and resistance at $46,426.33.
The Shifting Sands of Economic Data
The release of the latest US Purchasing Managers' Index (PMI) data provided a mixed bag for market participants. The manufacturing PMI, for instance, came in at 52.4, surpassing the forecast of 51.5 and the previous reading of 51.6. This suggests a degree of resilience in the U.S. manufacturing sector, which, in isolation, could be viewed as a positive economic signal. However, the services PMI offered a less optimistic outlook, registering 51.1 against an expected 52 and a prior 51.7. This divergence highlights the uneven nature of economic recovery and adds a layer of complexity for policymakers and investors trying to gauge the overall health of the economy. The manufacturing sector's outperformance, while encouraging, is tempered by the slowdown in services, leaving the broader economic narrative somewhat ambiguous. This ambiguity can contribute to market volatility as traders attempt to decipher the dominant trend.
The implications of these PMI figures extend beyond mere economic indicators; they directly influence market sentiment and the anticipated trajectory of monetary policy. A stronger-than-expected manufacturing PMI can bolster expectations for continued economic expansion, potentially supporting riskier assets. Conversely, a weaker services PMI might raise concerns about underlying demand and future growth, prompting a more cautious stance. In the current environment, where inflation and interest rate expectations remain at the forefront of market discussion, any data that deviates from forecasts is scrutinized for its potential to sway central bank decisions. The Federal Reserve, in particular, will be monitoring such releases closely as it calibrates its approach to monetary tightening or easing.
Dollar Strength: A Headwind for Equities?
Accompanying the mixed economic data has been a notable strengthening of the US Dollar Index (DXY), which has been climbing and is currently hovering near the significant psychological level of 99.91. This upward momentum in the dollar is not occurring in a vacuum; it often correlates inversely with the performance of major equity indices like the Dow Jones Industrial Average. When the dollar strengthens, it can make U.S. exports more expensive for foreign buyers, potentially impacting the earnings of multinational corporations listed on the Dow. Furthermore, a stronger dollar can attract capital away from other markets as investors seek the perceived safety and yield of U.S. assets, thereby reducing liquidity and investment appetite for equities.
The DXY's current position near 99.91 is particularly noteworthy. This level has historically acted as a point of contention, and its sustained push higher could signal a broader risk-aversion trend taking hold in the markets. Investors often flock to the dollar as a safe-haven asset during times of geopolitical uncertainty or economic apprehension. The recent geopolitical tensions, as highlighted by reports of escalating cyber threats and concerns over global energy security, likely contribute to this flight towards dollar strength. This dynamic creates a challenging environment for the Dow Jones, as the broader risk appetite, often reflected in indices like the S&P 500 and Nasdaq, appears to be waning. The correlation is clear: as the dollar strengthens, particularly in an environment of heightened global risk, the pressure on the Dow Jones tends to intensify.
Technical Picture: A Choppy Path Ahead
Turning our attention to the technical charts, the Dow Jones Industrial Average presents a nuanced picture across different timeframes. On the 1-hour chart, the trend is decidedly bearish, with a strong conviction indicated by an 93% power reading. However, the ADX stands at a relatively low 16.57, suggesting a weak trend and potential for ranging or choppy price action in the short term. This means that while the immediate direction might be down, the conviction behind the move isn't particularly strong, making it difficult to rely on sustained momentum.
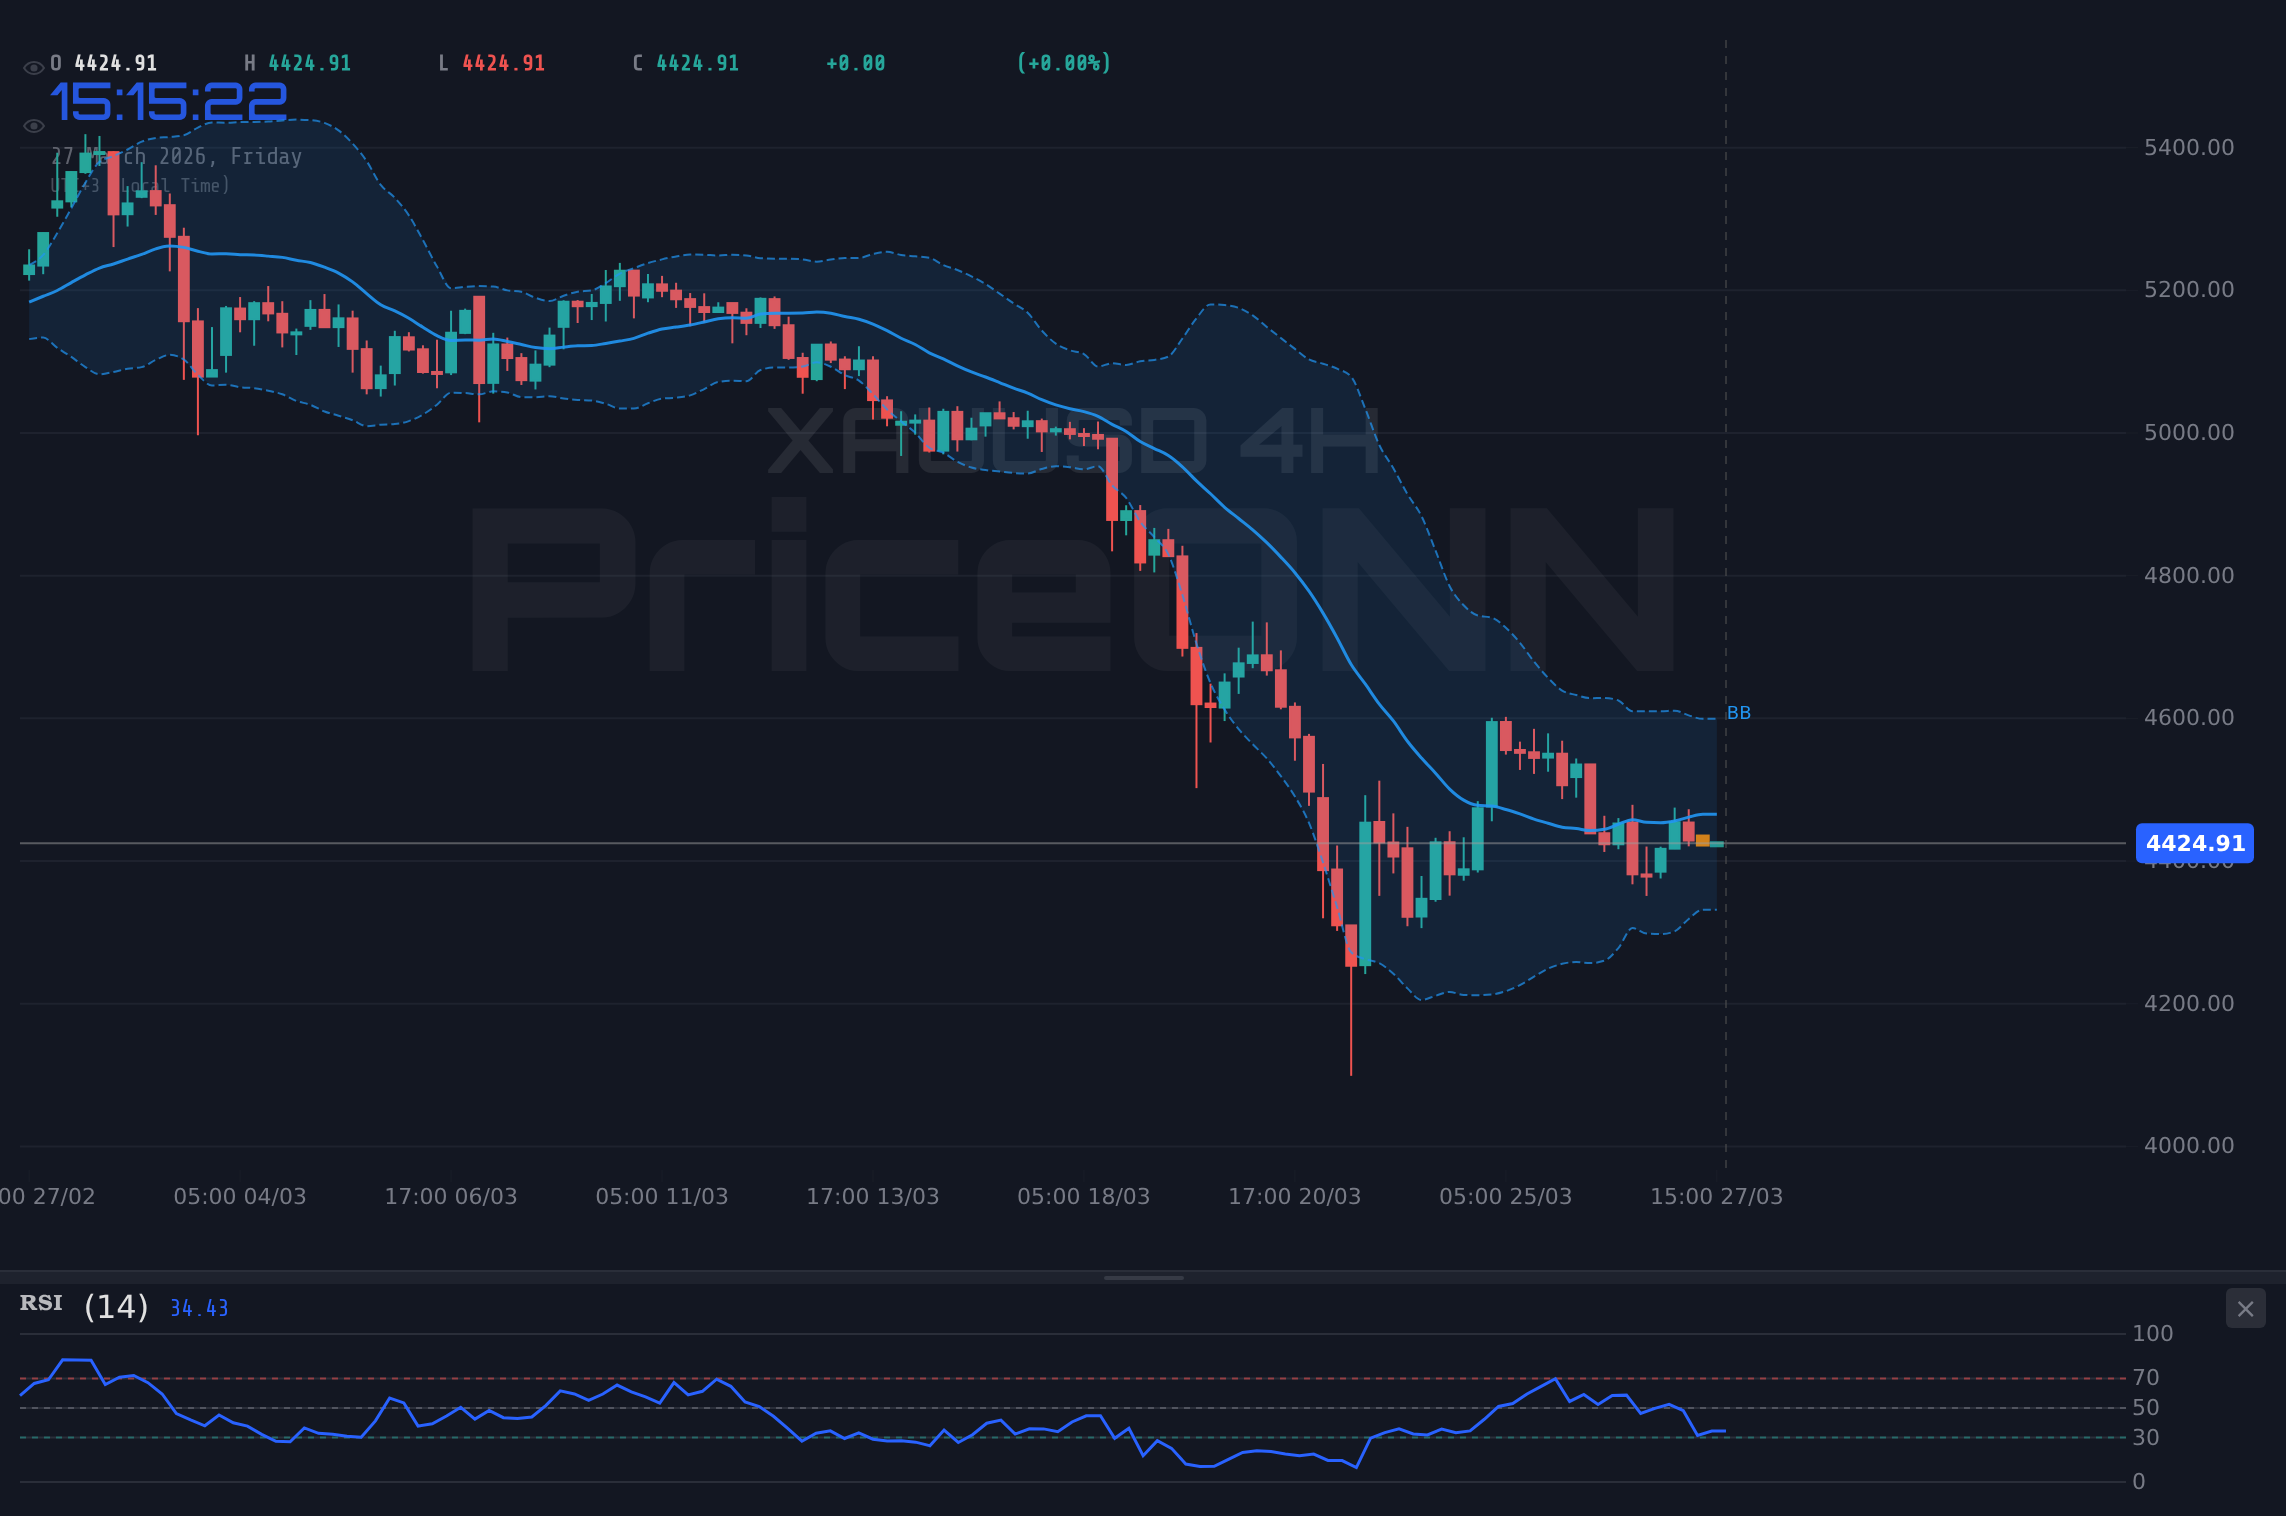
The 4-hour timeframe offers a similar, if not more pronounced, view of the trend's weakness. The trend is also identified as bearish, but the ADX reading here is even lower, at 14.71. This is a critical observation; an ADX below 20 generally signifies a lack of trend strength, indicating that the market is consolidating or trading sideways rather than exhibiting a clear directional move. While the MACD histogram shows negative momentum, and stochastic oscillators are in oversold territory, the low ADX suggests that these signals may not translate into significant price action immediately. This environment is often characterized by false breakouts and reversals, demanding a high degree of patience and risk management from traders.
On the daily chart, the bearish trend is more pronounced, with a power rating of 100%. However, even here, the ADX at 41.42, while indicating a strong trend, is coupled with other indicators that suggest potential shifts or divergences. The RSI(14) is at 31.21, sitting in neutral territory but leaning towards oversold conditions, and the Stochastic indicator is showing a potential bullish crossover (%K > %D). This combination of a strong bearish trend on the ADX alongside conflicting signals from RSI and Stochastic creates a complex scenario. It hints that while the dominant longer-term trend might be down, there could be short-term bounces or periods of consolidation before any definitive continuation.
Navigating the Levels: Support and Resistance
The Dow Jones Industrial Average is currently trading around $45,776. Examining the key support and resistance levels provides crucial context for understanding potential price movements. On the daily chart, the first significant support level is identified at $45,771.33. This level is critically important; a decisive break below it could signal further downside, potentially targeting the next support at $45,507.67. Historically, when major indices test key support levels, especially during periods of dollar strength and risk aversion, a breakdown can accelerate rapidly as stop-loss orders are triggered, leading to a liquidity grab by sellers.
Conversely, resistance levels stand as barriers to any potential upward movement. The immediate resistance is found at $46,426.33. For the bulls to regain any semblance of control, a sustained move and close above this level would be necessary. This would likely require a shift in broader market sentiment, perhaps a pullback in the dollar or positive surprises in upcoming economic data. However, given the current technical setup, particularly the weak trend strength indicated by the ADX on shorter timeframes, such a bullish breakout might face significant hurdles. The path of least resistance, at least in the very short term, appears to be downwards, with the $45,771.33 support acting as the immediate line in the sand.
The Broader Economic Context and Future Outlook
Looking beyond the immediate price action, the Dow Jones operates within a larger macroeconomic framework influenced by central bank policies and geopolitical events. The Federal Reserve's stance on inflation and interest rates remains a dominant theme. While recent data points like the manufacturing PMI might suggest some economic robustness, the services sector's sluggishness, coupled with persistent inflation concerns, keeps the Fed in a delicate balancing act. Market participants are keenly watching for any signals that might indicate a pivot or a continuation of a hawkish stance. The current strength of the dollar, partly driven by these monetary policy expectations and global uncertainties, adds another layer of pressure on U.S. equities.
The geopolitical landscape also plays a crucial role. Escalating tensions, particularly concerning global energy security, can fuel inflation fears and trigger risk-off sentiment, which typically benefits the U.S. dollar at the expense of equities. This dynamic creates a challenging environment for the Dow Jones, as it operates under the dual pressures of potentially tighter monetary policy and increased global instability. The interplay between these factors suggests that the path forward for the index may be characterized by volatility, with significant moves likely to be driven by major economic data releases and geopolitical developments. Traders will need to remain vigilant, closely monitoring the DXY, oil prices, and any official commentary from central banks.
The current technical setup on the Dow Jones, particularly the low ADX readings on shorter timeframes, suggests a high probability of choppy price action and potential false signals. Investors should exercise caution and prioritize risk management, waiting for clearer directional conviction before committing to significant positions.
Scenario Analysis: Charting the Possibilities
Bearish Scenario: Testing the Depths
65% ProbabilityNeutral Scenario: Consolidation Around $45,776
25% ProbabilityBullish Scenario: A Cautious Rebound
10% ProbabilityWhat the Indicators Are Telling Us
The technical indicators on the Dow Jones Industrial Average provide a mixed but predominantly cautious signal. On the daily chart, the RSI(14) is at 31.21, indicating it's approaching oversold territory but still some distance from a clear buy signal. This suggests that while selling pressure might be easing, there isn't yet strong buying conviction. The MACD is trading below its signal line with negative momentum, reinforcing the bearish short-to-medium term outlook. However, the Stochastic oscillator is showing a potential bullish crossover (%K at 40.59, %D at 34.72), suggesting that a short-term bounce could be on the cards, especially if the index holds above the $45,771.33 support.
The ADX on the daily chart is at 41.42, which signifies a strong trend. However, the lower ADX readings on the 1-hour (16.57) and 4-hour (14.71) charts paint a different picture for shorter timeframes. This divergence is key: it implies that while the longer-term trend might be strongly bearish, the immediate market is experiencing a lack of direction and potentially high volatility within a defined range. This is often referred to as a 'choppy' market. Such conditions are challenging for trend-following strategies and increase the risk of whipsaws. Traders should be wary of relying solely on one indicator; confluence across multiple timeframes and indicators is crucial for identifying higher-probability setups.
Bollinger Bands also offer insights. On the daily chart, the price is trading below the middle band, aligning with the bearish trend. However, on the 1-hour chart, the price is above the middle band, indicating some short-term upward pressure or a potential reversal attempt. This discrepancy further underscores the current market's indecisiveness. The key takeaway from the indicators is a need for patience. While the longer-term trend leans bearish, the lack of strong directional momentum on shorter timeframes suggests that any move might be corrective or range-bound until a clearer catalyst emerges. The $45,771.33 support level remains the critical line to watch for a potential downside continuation.
Frequently Asked Questions: DowJones30 Analysis
What happens if the Dow Jones breaks below the $45,771.33 support level?
A break below $45,771.33 on the Dow Jones would invalidate the current neutral scenario and likely trigger a bearish move. The next key downside target would be $45,507.67, with further support at $45,116.33. This scenario is supported by the overall bearish trend signals on longer timeframes and the potential for increased risk aversion.
Should I buy the Dow Jones at current levels of $45,776 given the RSI is nearing oversold territory?
Buying solely based on an RSI near oversold levels at $45,776 is risky due to the weak trend strength (ADX 14.71 on 4H). A more prudent approach would be to wait for confirmation, such as a confirmed bounce off the $45,771.33 support or a breakout above the $46,426.33 resistance. A higher probability setup would emerge after such confirmations.
Is the ADX at 41.42 on the daily chart a sell signal for the Dow Jones?
An ADX of 41.42 on the daily chart indicates a strong trend, which in this case is bearish. However, it doesn't dictate the direction on its own. It confirms that a strong trend is present, but other indicators like RSI and Stochastic need to be considered for entry timing. The conflicting signals on shorter timeframes suggest caution despite the strong daily ADX.
How will the strong US Dollar Index (DXY) near 99.91 affect the Dow Jones this week?
A DXY near 99.91 typically exerts downward pressure on the Dow Jones, making U.S. exports more expensive and potentially driving capital away from equities towards safe-haven dollar assets. This correlation suggests that continued dollar strength could hinder any bullish attempts by the Dow Jones, reinforcing the bearish bias unless other factors intervene.
| Indicator | Value | Signal | Interpretation |
|---|---|---|---|
| RSI (14) | 31.21 | Neutral/Oversold | Approaching oversold, but needs confirmation. |
| MACD Histogram | - | Bearish | Negative momentum persists. |
| Stochastic | K:40.59, D:34.72 | Bullish Crossover | Potential short-term bounce signal. |
| ADX | 41.42 | Strong Trend | Confirms trend strength, but direction needs other indicators. |
| Bollinger Bands | Middle Band | Watching | Daily chart below, 1H above - suggesting range. |
Key Levels
Support Levels
Resistance Levels
Track markets in real-time
AI-powered analysis, technical indicators and real-time price data.
Join Our Telegram Channel
Breaking market news, AI analysis and trading signals instantly.
Join Channel