Nasdaq 100 Retreats to $23,455: Bears Test Support Amidst Strong Dollar
Nasdaq 100 faces selling pressure at $23,455.54, with the DXY surge and risk aversion weighing on tech stocks. Bears eye $23,300 support.
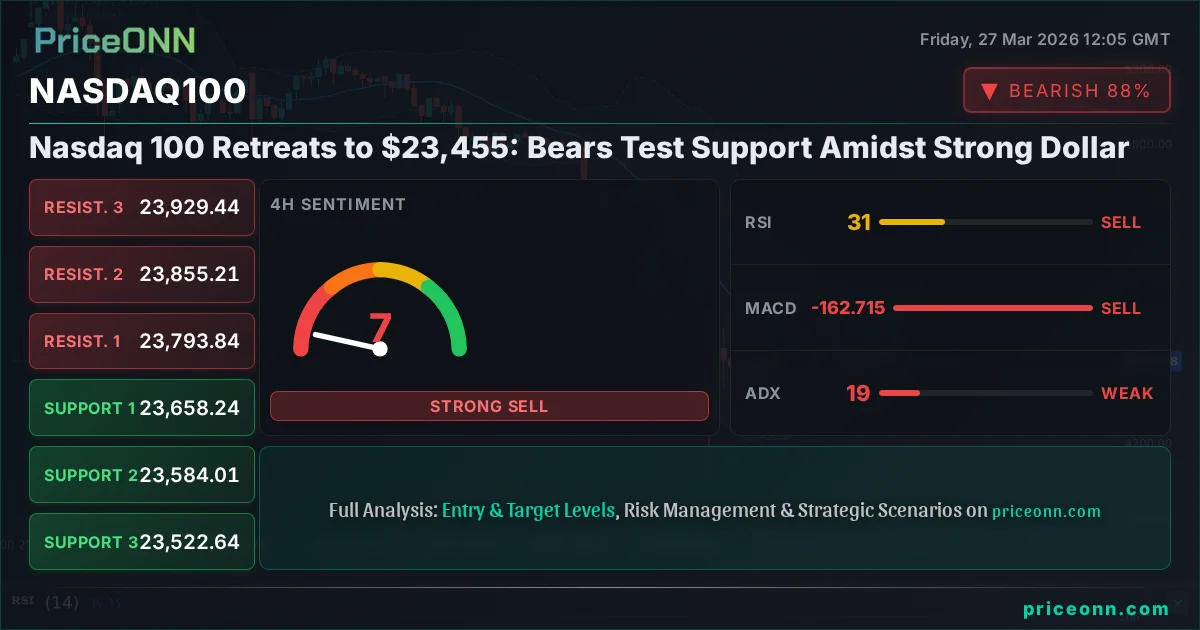
The Nasdaq 100 is currently trading at $23,455.54, a level that has seen significant attention as bears attempt to assert control amidst a confluence of bearish technical signals and a strengthening US Dollar Index (DXY). Today's analysis delves into the intricate technical landscape, exploring the implications of key indicator readings and the critical support levels that traders are watching closely. With the DXY nearing the 99.90 mark, the pressure on risk assets like the Nasdaq 100 is palpable, raising questions about the sustainability of current trends and the potential for further downside.
- The Nasdaq 100 is trading at $23,455.54, showing weakness as the DXY approaches 99.90.
- Critical support for the Nasdaq 100 sits at $23,405.37 (1H) and $23,300 (4H), tested multiple times this week.
- RSI at 30.73 on the daily chart signals oversold conditions, but MACD histogram shows negative momentum, indicating fading bullish pressure.
- The strong DXY at 99.91 is creating headwinds, correlating with the Nasdaq 100's decline, suggesting a risk-off sentiment.
The Technical Tightrope: Navigating Nasdaq 100's Current Predicament
Daily Chart Dynamics: A Shifting Landscape
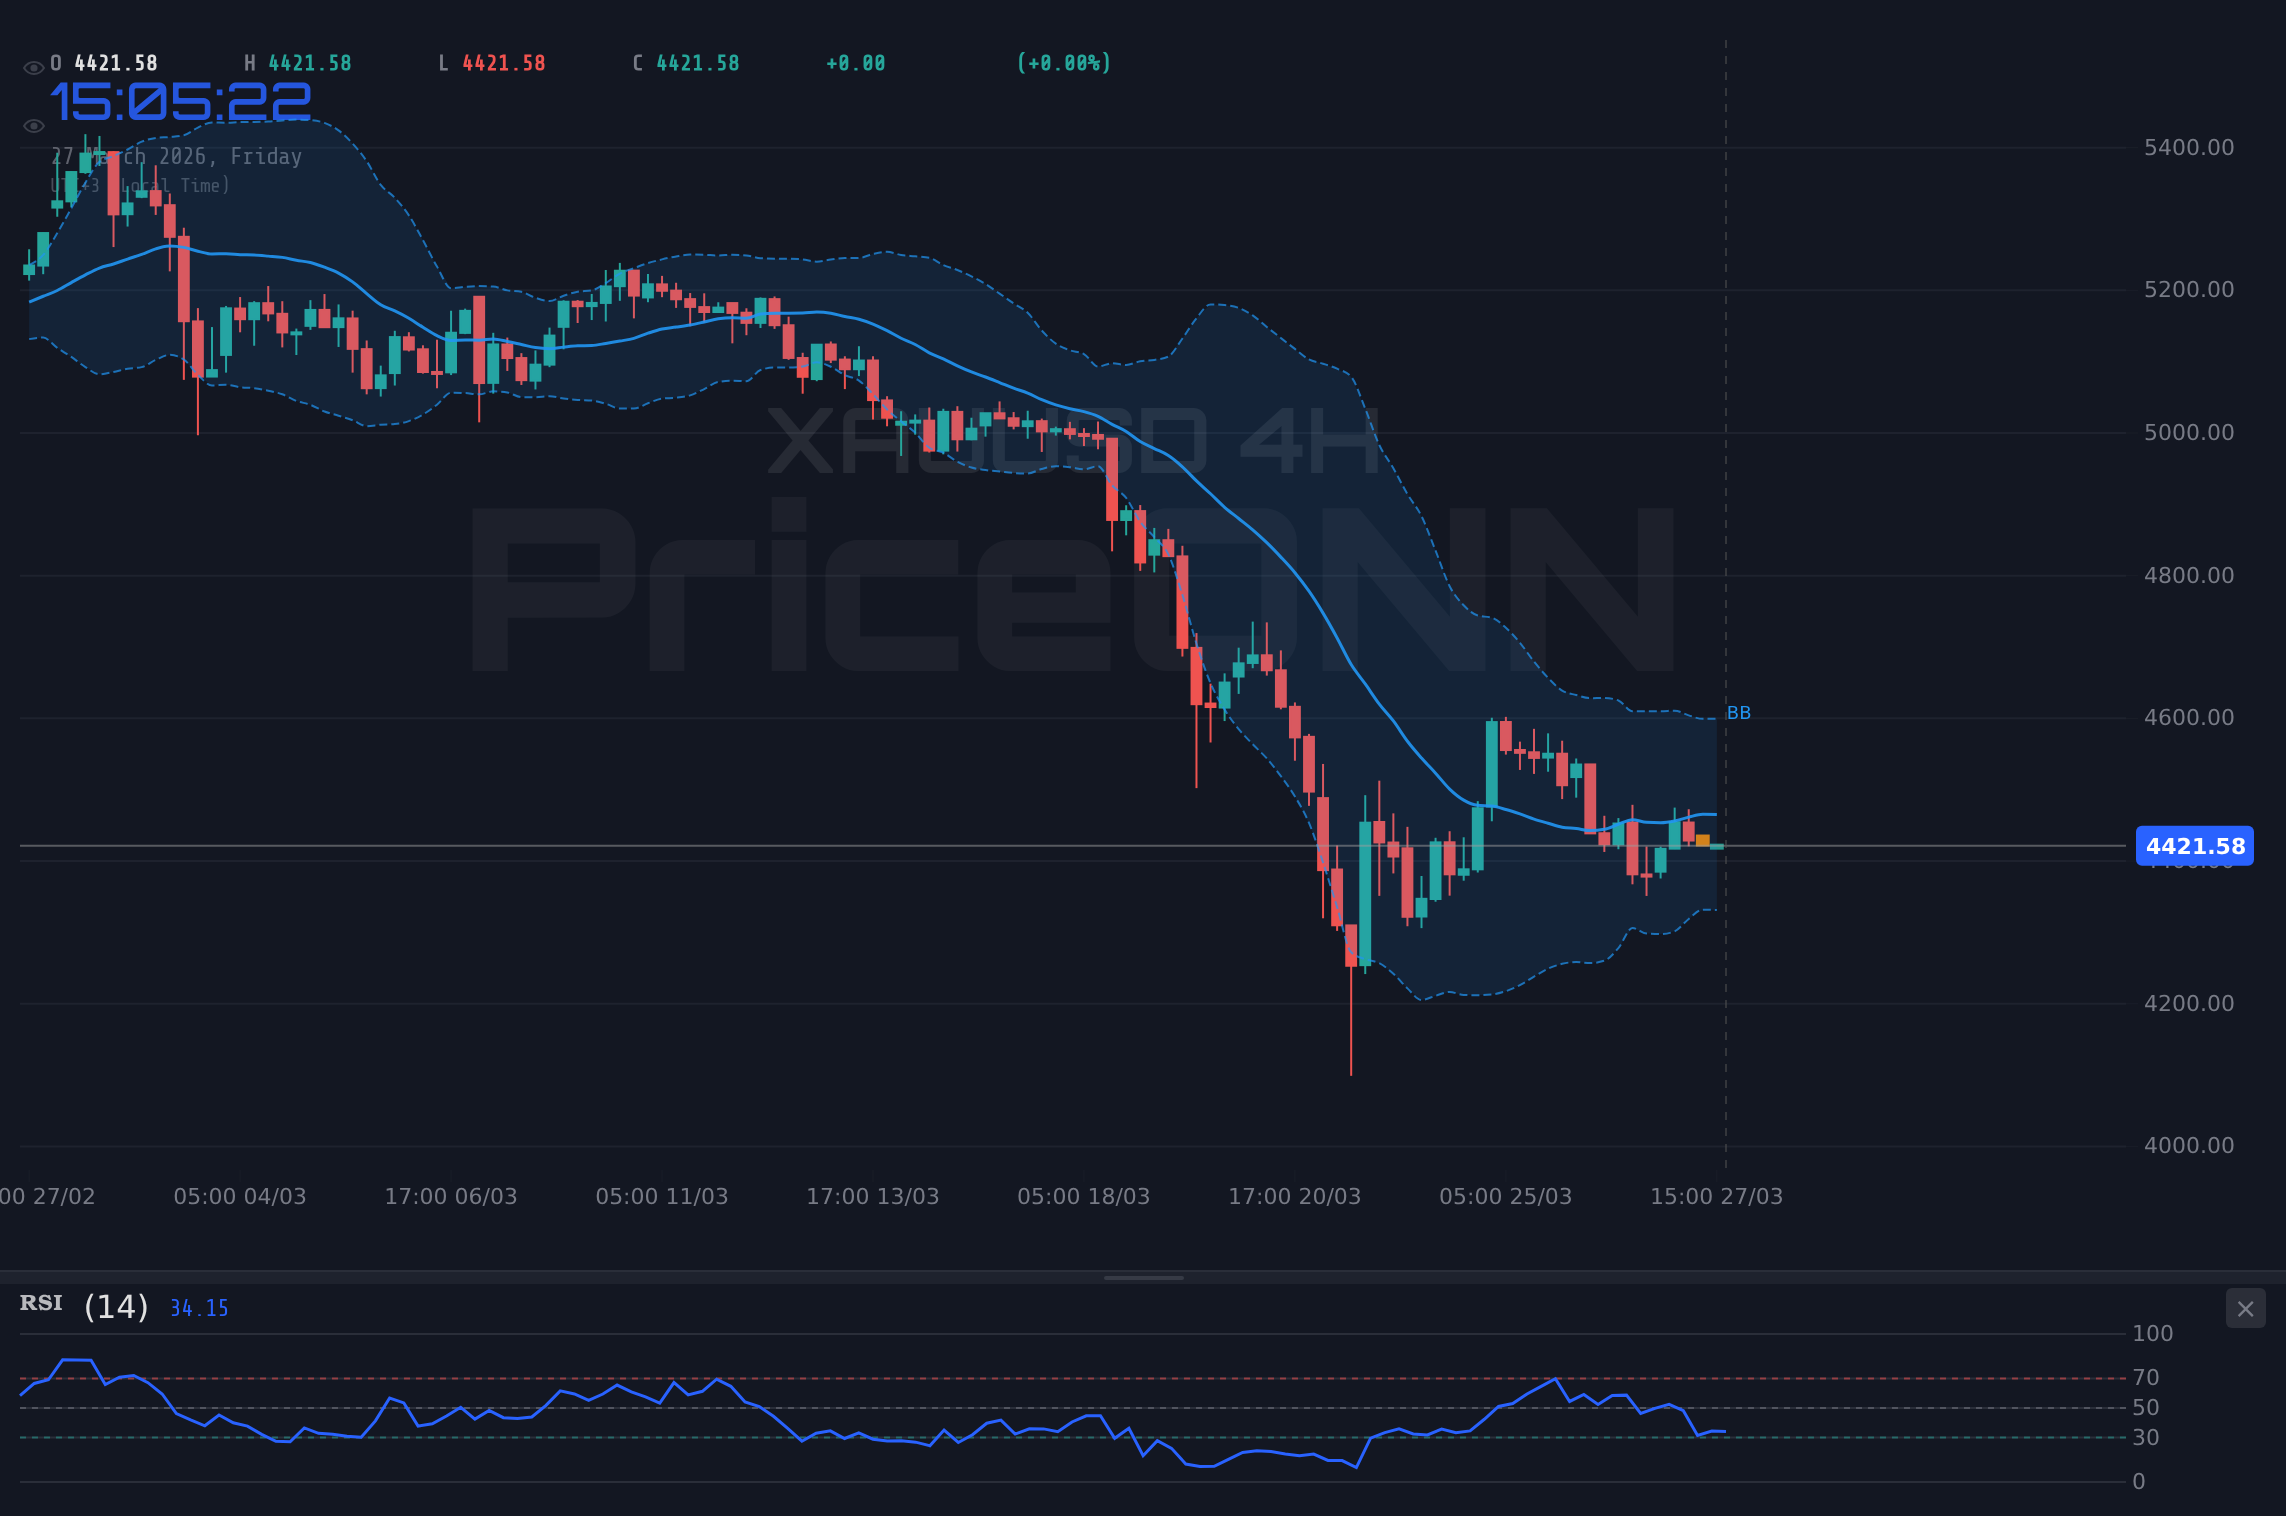
The daily chart presents a concerning picture for the Nasdaq 100, currently priced at $23,455.54. The index has been in a downtrend for some time, with the ADX at a robust 47.25 indicating a strong bearish trend is firmly in place. This is not a fleeting moment of weakness; it’s a sustained downward move that demands attention. The Relative Strength Index (RSI) stands at 30.56, hovering just above oversold territory. While this might tempt some to look for buying opportunities, the MACD histogram, deeply in negative territory, suggests that selling momentum is still strong and has not yet shown signs of reversal. The Bollinger Bands are also widening and positioned below the middle band, a classic sign of increasing bearish pressure. This confluence of indicators on the daily timeframe paints a picture of a market under significant strain, where any rallies are likely to be met with selling pressure as traders position for further declines.Intraday Weakness: 1-Hour and 4-Hour Perspectives
Examining the shorter timeframes, the 1-hour chart reveals a steep downtrend, reinforced by an ADX of 27.52. The RSI at 27.23 here is deeply oversold, suggesting a potential for a short-term bounce. However, the MACD is firmly negative, and the Stochastic oscillator (%K at 8.47, %D at 30.39) is giving a strong sell signal, indicating that downward momentum is still dominant. The Bollinger Bands are hugging the lower band, a signal of extreme bearishness in the short term. On the 4-hour chart, the picture is similarly bearish, with an ADX of 18.66 indicating a weak trend, but this is often a precursor to a more significant move. The RSI is at 31.36, also in oversold territory, but the MACD remains negative. The Stochastic is showing extreme oversold conditions with %K at 13.37 and %D at 14.23, suggesting a potential reversal is brewing. However, without clear bullish confirmation, these oversold readings are often traps, leading to further price erosion. The key takeaway from these shorter timeframes is that while oversold conditions are present, the underlying bearish momentum, particularly evident on the daily chart, remains the dominant force.The Dollar's Dominance: A Correlation Under Scrutiny
The US Dollar Index (DXY) is currently trading at 99.91, showing a strong upward trend on the daily chart with an ADX of 31.98. This strengthening dollar is a significant headwind for risk assets like the Nasdaq 100. Historically, a rising dollar often correlates with falling equity markets, especially for growth-oriented sectors that dominate the Nasdaq 100. Investors tend to seek refuge in the perceived safety of the dollar during periods of global uncertainty, which is precisely what we are seeing now. The DXY’s ascent puts pressure on foreign capital to convert to dollars, thereby reducing liquidity in other markets and increasing the cost of dollar-denominated assets for non-US investors. This correlation is not merely theoretical; it's a powerful driver of market sentiment and price action. As the DXY approaches the psychologically significant 100 level, the pressure on the Nasdaq 100 is likely to intensify, making it difficult for the index to find sustained upward momentum.Geopolitical Undercurrents and Market Sentiment
Recent geopolitical tensions, as reported by sources like Reuters and Bloomberg, are contributing to a broader risk-aversion sentiment across global markets. Escalating conflicts and concerns over energy security, coupled with persistent inflation fears, are driving investors towards safe-haven assets. This 'risk-off' environment directly impacts growth stocks, which are more sensitive to changes in economic outlook and interest rate expectations. The Federal Reserve's recent commentary, suggesting a renewed focus on inflation risks, adds another layer of uncertainty. If the Fed signals a more hawkish stance, it could lead to higher interest rates for longer, further pressuring valuations of growth stocks. This complex interplay of geopolitical risks, inflation concerns, and central bank policy expectations is creating a challenging environment for the Nasdaq 100, making it susceptible to sharp declines whenever negative news emerges.Navigating the Support Structures: Where the Bears Might Pause
The 1-Hour Chart's Immediate Test
On the 1-hour chart, the immediate support level for the Nasdaq 100 is at $23,405.37. This is a critical juncture. A break below this level would signal further immediate weakness, potentially leading to a test of the subsequent support at $23,302.67. The strength of the trend on this timeframe, indicated by the ADX at 27.52, suggests that a break here could be swift. However, the extremely oversold RSI (27.23) and Stochastic readings might offer a temporary reprieve, leading to a short-lived bounce before the downtrend resumes. This level is crucial for intraday traders to monitor, as a decisive break could trigger stop-loss orders and accelerate downside momentum.The 4-Hour Chart's Crucial Defense Line
The 4-hour chart presents a more significant battleground, with the first key support level at $23,302.67. This level has been tested and held previously, making it a psychologically important barrier. Below this, we find further support at $23,273.23, and then a more substantial level at $23,150.20. The ADX at 18.66 on this timeframe suggests a weaker trend, but this can be deceptive in ranging markets or before a significant breakout. The RSI at 31.36 is still in oversold territory, and the Stochastic is showing extreme oversold readings, hinting at a potential reversal. However, the negative MACD momentum cannot be ignored. A sustained close below $23,302.67 on the 4-hour chart would invalidate any near-term bullish hopes and open the door for a deeper correction.Daily Support: The Long-Term Perspective
Looking at the daily chart, the primary support level is $23,150.20. This is a significant level that, if broken convincingly, would signal a much broader bearish trend continuation. Further down, we have support at $22,736.12, and a more distant, critical level at $21,911.37. The daily ADX of 47.25 underscores the strength of the current bearish trend. While the daily RSI is approaching oversold territory, the overall trend strength suggests that this might not be enough to halt the decline. Any bounce from these daily support levels will need to overcome significant resistance, particularly the psychological 23,500-23,600 area, before any sustained recovery can be considered.Market Sentiment and Indicator Confluence
The current market sentiment is heavily influenced by the interplay of technical signals and macroeconomic factors. On the 1-hour chart, the RSI at 27.23 and Stochastic readings suggest extreme oversold conditions, potentially signaling a short-term buying opportunity. However, this is directly contradicted by the MACD histogram, which remains deeply negative, indicating that selling momentum is still dominant. This divergence between oscillators and momentum indicators highlights the choppiness and uncertainty in the market. The ADX at 27.52 confirms a strong trend, but without a clear direction, it simply means the market is moving with conviction in its current, albeit potentially temporary, direction. On the 4-hour timeframe, the RSI (31.36) and Stochastic (13.37/%K, 14.23/%D) also point to oversold conditions, but again, the MACD momentum is negative. The ADX at 18.66 suggests a weaker trend, which could mean the market is consolidating before a larger move, or that the current downtrend lacks conviction. The daily chart presents a similar dilemma: RSI (30.56) is oversold, but the MACD is negative, and the ADX at 47.25 indicates a powerful bearish trend. This conflict between oversold oscillators and persistent negative momentum/trend strength means that traders should exercise extreme caution. A bounce from oversold levels is possible, but the underlying bearish trend suggests any such bounce may be a short-lived opportunity for sellers to re-enter the market at better prices.The Role of Oil Prices and Inflation Expectations
Brent crude oil is trading at $107.97, having seen a significant surge of 4.19%. This rise in oil prices is a double-edged sword for the Nasdaq 100. On one hand, higher energy prices can fuel inflation expectations, potentially leading to more hawkish central bank policies, which is negative for growth stocks. On the other hand, rising oil prices can also signal robust global demand, which could be seen as a positive for the broader economy. However, in the current risk-off environment, the inflationary impact is likely to dominate market sentiment. Persistent high oil prices increase the cost of doing business for many companies and can erode consumer purchasing power, both of which are detrimental to tech stocks. Therefore, the continued strength in oil prices, while indicating demand, is more likely to be interpreted as an inflationary risk, further pressuring the Nasdaq 100.USDJPY and GBPUSD Correlations: A Tale of Two Currencies
The USD/JPY pair is trading at 159.847, showing a clear upward trend with a strong daily ADX of 22.41. This reflects the divergence in monetary policy between the US and Japan, with the Fed perceived as more hawkish than the Bank of Japan. This strength in USD/JPY reinforces the strength of the US dollar. Conversely, GBP/USD is trading at 1.32815, showing a bearish trend with a daily ADX of 29.72. The pound is weakening against the dollar, partly due to domestic economic concerns and perhaps a less hawkish stance from the Bank of England compared to the Fed. The weakness in GBP/USD further corroborates the strength of the DXY. These currency pair movements highlight the global demand for dollars and the relative weakness in other major currencies, collectively reinforcing the headwinds faced by the Nasdaq 100. The strength of USD/JPY, in particular, indicates a potential for carry trades and capital flows away from riskier assets and towards dollar-denominated assets or those yielding higher interest rates.Scenario Planning: Charting Potential Paths Forward
Bearish Scenario: The Descent Continues
65% ProbabilityNeutral Scenario: Consolidation Around Key Levels
25% ProbabilityBullish Scenario: A Technical Bounce
10% ProbabilityThe Road Ahead: What to Watch for
The Nasdaq 100 is currently at a critical juncture, trading at $23,455.54. The technical indicators across multiple timeframes present a mixed but predominantly bearish picture. While oversold conditions on shorter timeframes might suggest a temporary bounce, the strong bearish trend on the daily chart, coupled with a strengthening dollar and broader risk-off sentiment, points towards further downside potential. The key support levels to watch are $23,405.37 on the 1-hour chart and $23,302.67 on the 4-hour chart. A decisive break below these levels would likely trigger a cascade of selling, targeting the daily support at $23,150.20. Traders should remain cautious, paying close attention to the DXY's trajectory and any shifts in Federal Reserve rhetoric. The current environment favors a defensive stance, with opportunities likely arising from short-term bounces or a clear break of key support levels.Frequently Asked Questions: Nasdaq100 Analysis
What happens if Nasdaq 100 breaks below $23,302.67 support?
A break below the $23,302.67 support level on the 4-hour chart would invalidate the neutral scenario and likely trigger a bearish cascade. This would open the door for targets at $23,150.20 and potentially $22,736.12 as the strong daily downtrend reasserts itself.
Is RSI at 30.56 a buy signal for Nasdaq 100 at current levels?
While RSI at 30.56 on the daily chart suggests oversold conditions, it is not a standalone buy signal, especially with negative MACD momentum and a strong ADX of 47.25. A confirmed bullish reversal pattern or a break above key resistance would be needed for a reliable buy signal.
How is the DXY at 99.91 impacting Nasdaq 100's trend analysis?
The DXY's strength at 99.91 is creating significant headwinds for the Nasdaq 100. This inverse correlation suggests that as the dollar strengthens due to risk aversion and potential Fed hawkishness, capital flows out of risk assets like tech stocks, reinforcing the bearish trend analysis for the Nasdaq 100.
How will upcoming economic data affect Nasdaq 100's movement this week?
Upcoming economic data, particularly any indicators suggesting sticky inflation or a more hawkish Fed stance, could exacerbate the current bearish sentiment for the Nasdaq 100. Conversely, softer data could provide temporary relief, but the strong bearish trend would require significant catalysts to reverse.
| Indicator | Value | Signal | Interpretation |
|---|---|---|---|
| RSI (14) | 30.56 | Oversold | Potential for bounce, but trend strength is key. |
| MACD Histogram | -163.05 | Negative | Strong selling momentum persists. |
| Stochastic %K | 23.96 | Oversold | Extreme readings, watch for divergence. |
| ADX | 47.25 | Strong Trend | Bearish trend is firmly established. |
| Bollinger Bands | Price below Middle Band | Bearish | Indicates increased selling pressure. |
Track markets in real-time
AI-powered analysis, technical indicators and real-time price data.
Join Our Telegram Channel
Breaking market news, AI analysis and trading signals instantly.
Join Channel