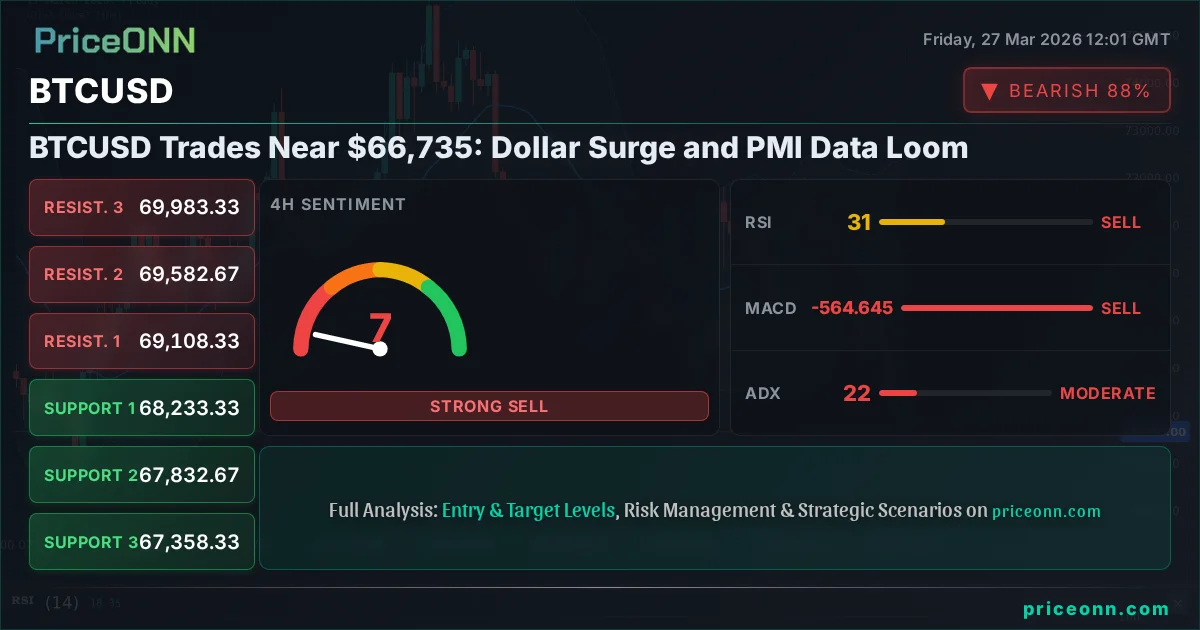
BTCUSD Trades Near $66,735: Dollar Surge and PMI Data Loom
Bitcoin hovers around $66,735 as a strong dollar and upcoming PMI data create market uncertainty. Technicals show a mixed picture.
The cryptocurrency market, led by Bitcoin (BTCUSD), is navigating a complex landscape where a surging US Dollar Index (DXY) and critical economic data releases are casting long shadows. As BTCUSD hovers precariously around the $66,735 mark, investors are scrutinizing every tick, caught between the allure of digital assets and the gravitational pull of a strengthening greenback. This delicate balance is further amplified by the anticipation of key Purchasing Managers' Index (PMI) data releases, which could inject significant volatility into both traditional and crypto markets.
- Bitcoin hovers near $66,735, with RSI at 21.27 signaling oversold conditions on the 1H chart, suggesting potential short-term buying interest.
- The critical support for BTCUSD sits at $65,970, a level that has seen multiple tests this week, with a break below potentially targeting $65,434.
- The MACD histogram on the 1H chart shows negative momentum, indicating bearish pressure persists despite oversold RSI readings.
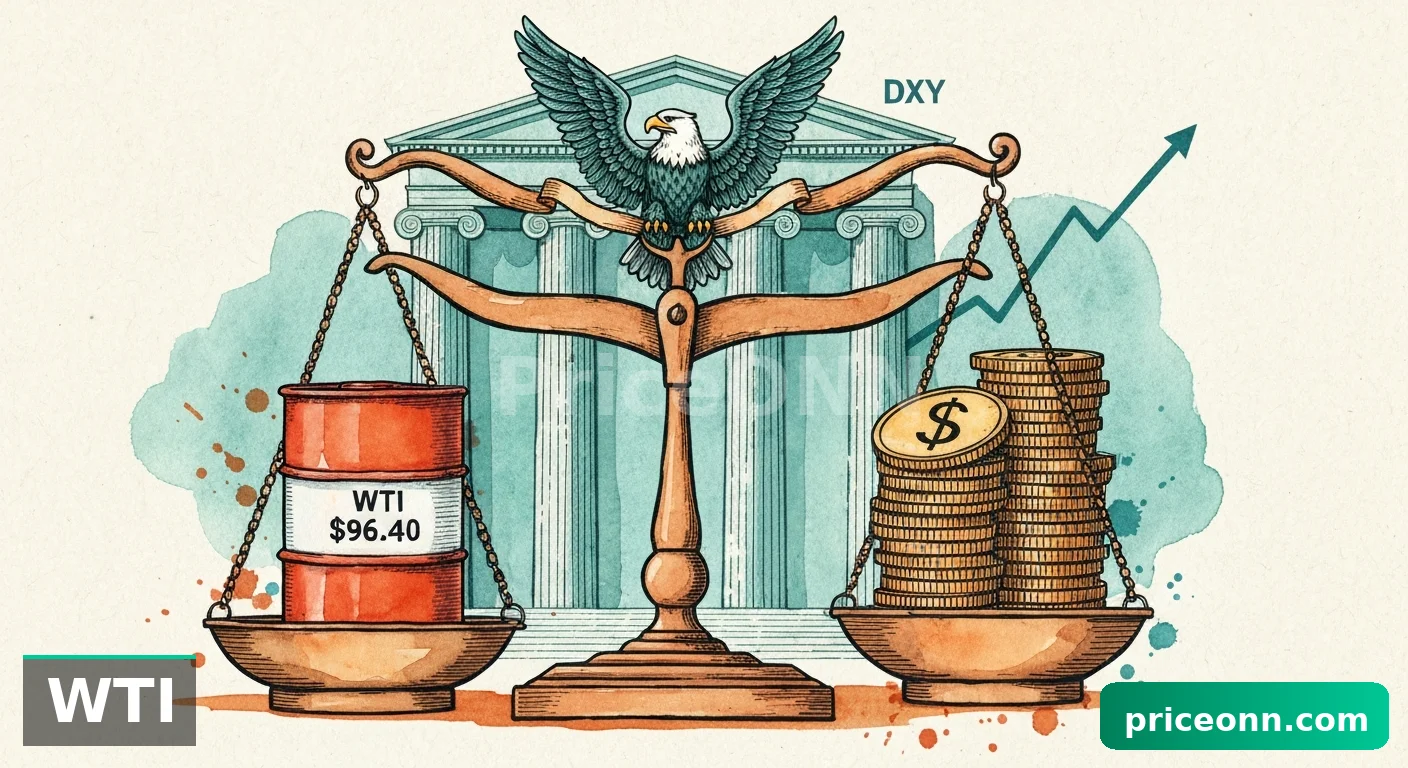
- The DXY's strength, currently at 99.89, is a significant headwind, correlating with broader risk aversion and pressuring BTCUSD.
The recent surge in the US Dollar Index (DXY), now trading around 99.89, is a primary driver of sentiment across global markets, including Bitcoin. Historically, a stronger dollar often correlates with a risk-off environment, where investors tend to move away from speculative assets like cryptocurrencies towards perceived safe havens. This inverse relationship is clearly visible as the DXY pushes higher, creating headwinds for BTCUSD. The current upward trend in the DXY, with its 1H timeframe showing a 95% trend strength and a 72.15 RSI indicating overbought conditions, suggests that dollar strength may persist in the short term, potentially capping any immediate upside for Bitcoin.
Navigating the Dollar's Ascent
The dollar's recent rally is not happening in a vacuum. Comments from Federal Reserve officials hinting at a potential return to a more hawkish stance on inflation, coupled with persistent geopolitical tensions, are bolstering demand for the greenback. The market is pricing in a renewed focus on inflation risks, which could delay anticipated interest rate cuts, further supporting the dollar. This macro backdrop creates a challenging environment for risk assets. For BTCUSD, this means that any upward price action needs to overcome not only market sentiment but also the significant gravitational pull of a strong US dollar. The correlation is stark: as the DXY climbs past key resistance levels, like the 99.78 mark, Bitcoin's ability to hold its ground, let alone advance, becomes increasingly difficult.
Technical Picture: A Mixed Signal for BTCUSD
On the technical front, BTCUSD presents a conflicting narrative across different timeframes. The 1-hour chart, for instance, shows an RSI reading of 21.27, deep in oversold territory, which typically signals a potential for a bounce. However, this is juxtaposed with a negative MACD histogram and a strong downward trend indicated by ADX at 34.26. This suggests that while buyers might step in to provide temporary relief, the underlying momentum remains bearish. The Stochastic Oscillator, with K at 10.87 and D at 22.95, reinforces the oversold condition but also confirms the prevailing downward momentum, as %K remains below %D.
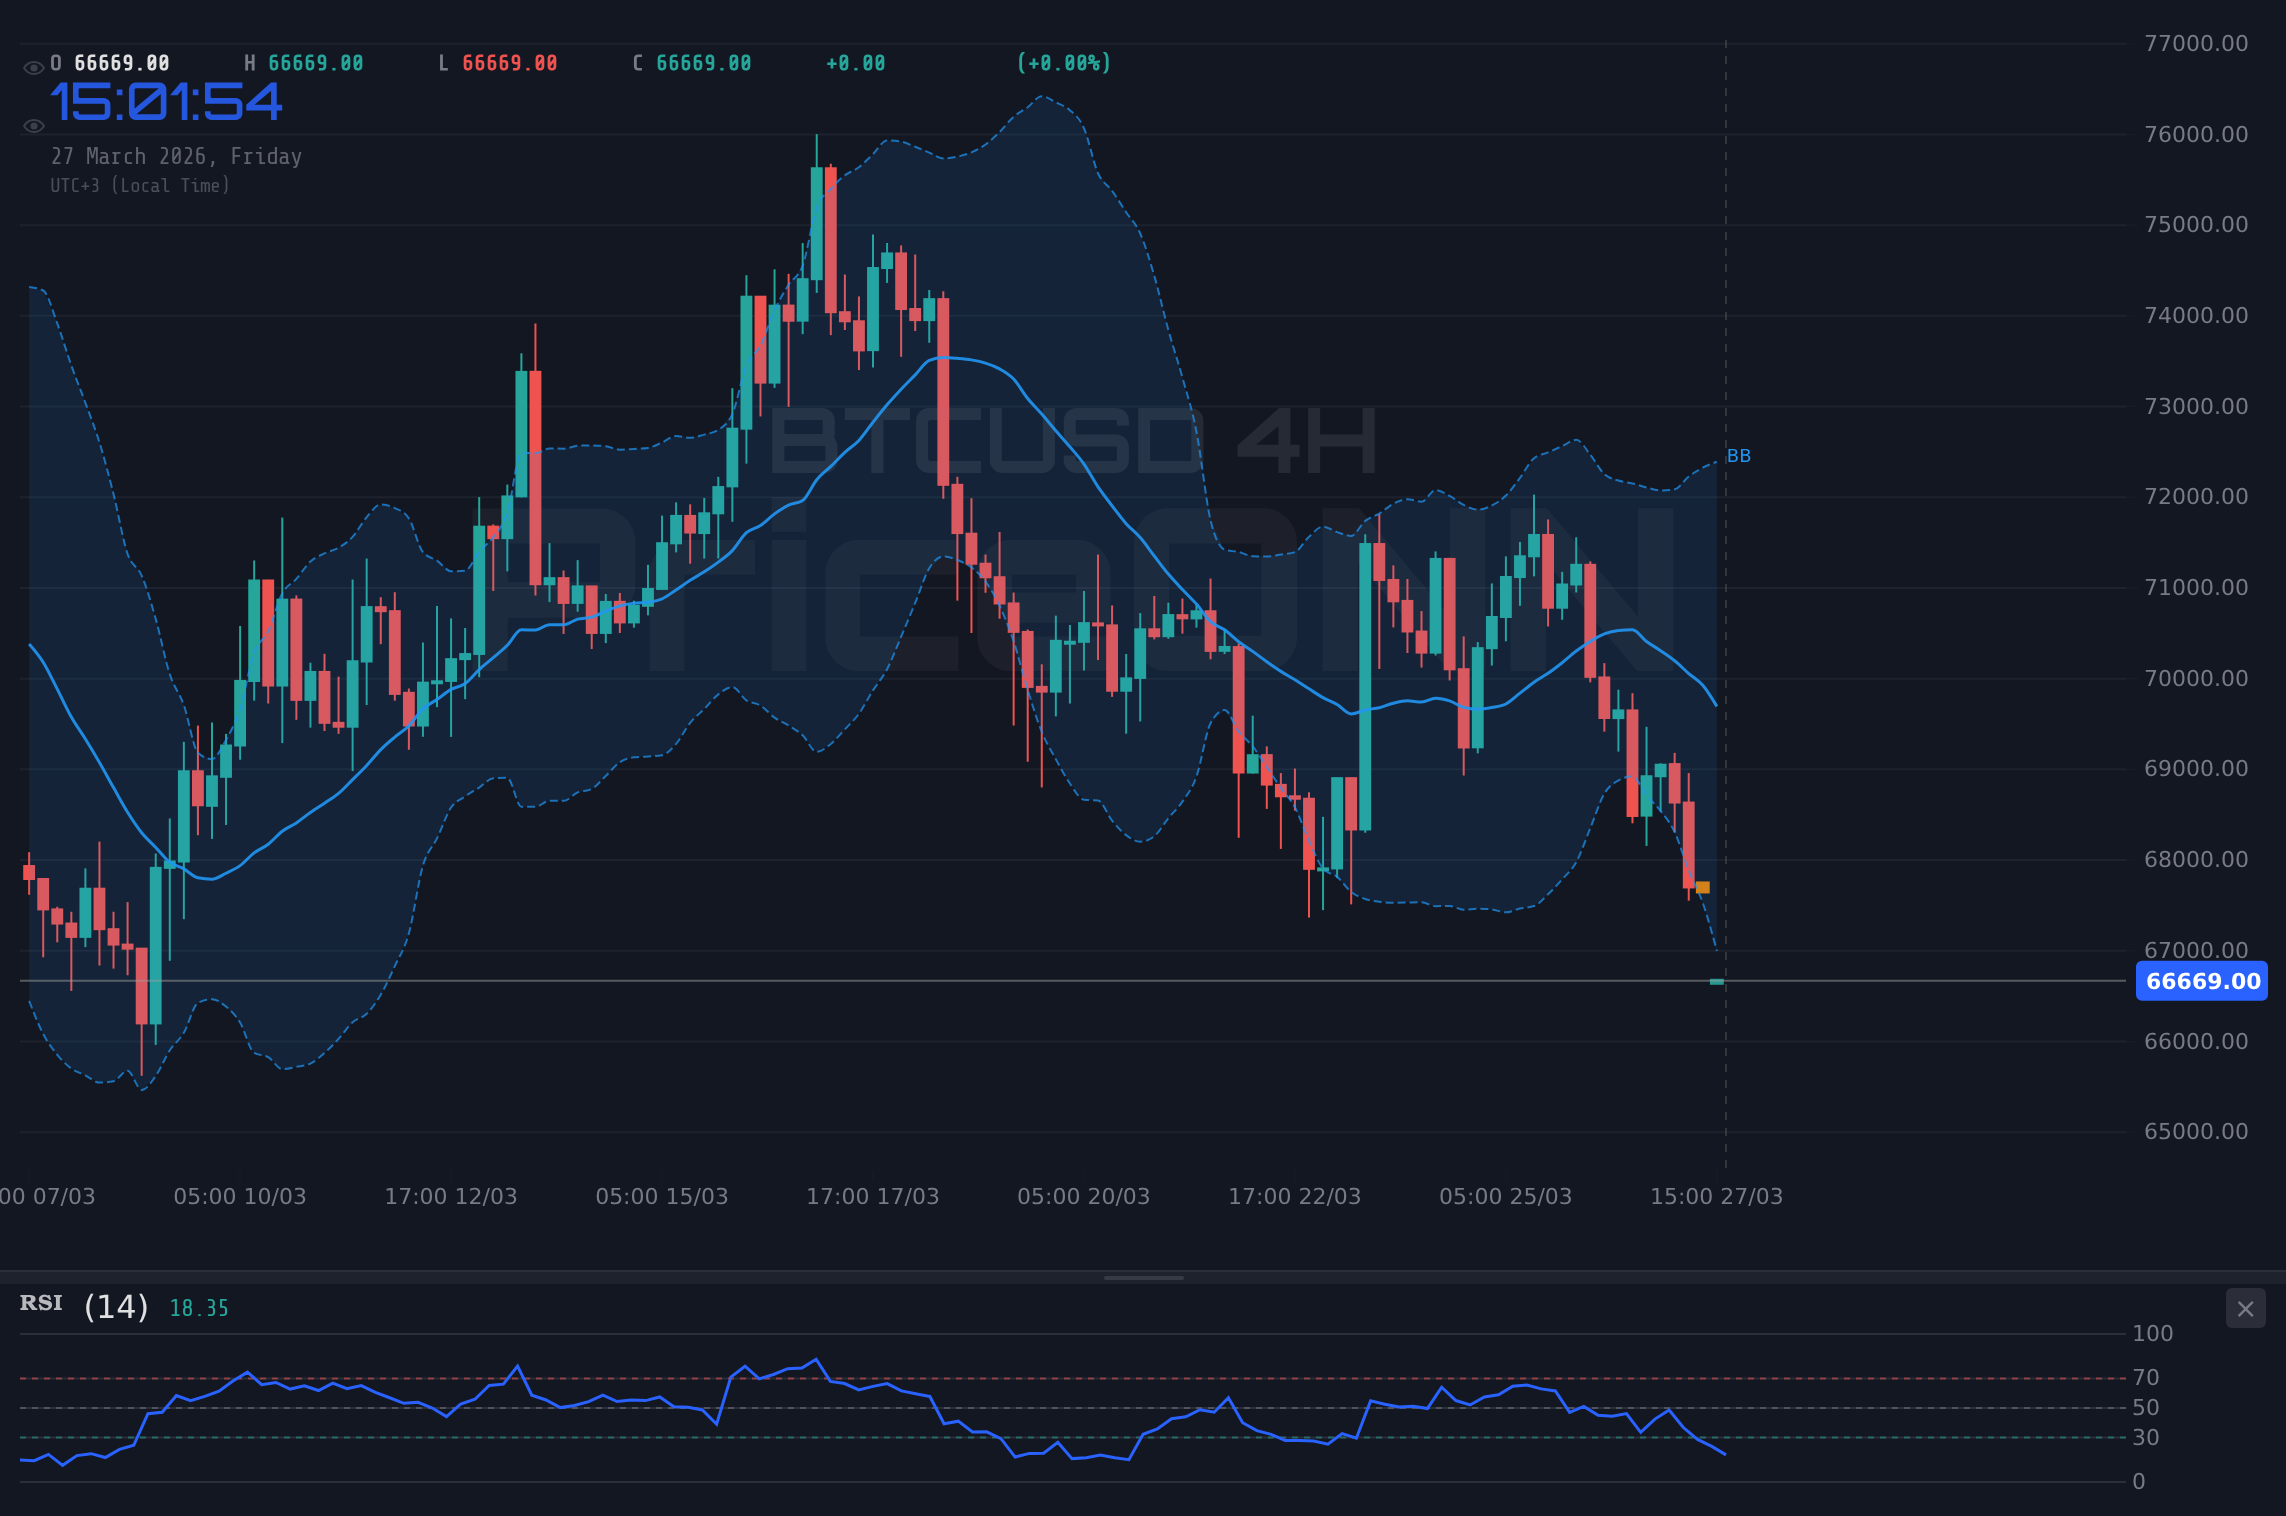
Zooming out to the 4-hour chart, the picture becomes slightly more consolidated, though still favouring caution. The RSI sits at 31.7, still in the neutral-to-oversold zone, while the MACD continues to show negative momentum. The ADX at 21.64 indicates a moderate trend strength, suggesting that the current move has some legs, but it's not yet a runaway trend. The Stochastic Oscillator here also shows oversold conditions, with K (12.97) below D (14.34), aligning with the bearish sentiment. This confluence of indicators across shorter timeframes suggests that immediate upside potential might be limited, and any rallies could face selling pressure as traders look to exit before further declines.
The daily chart paints a picture of a market in a neutral trend (50% strength) but with lingering bearish momentum. The RSI at 41.39 is in the neutral zone, but MACD is firmly negative, and the ADX at 16.92 points to a weak trend. This suggests that while the strong downtrend seen on shorter timeframes might be losing steam, there isn't yet strong conviction for a reversal. The Stochastic Oscillator on the daily chart shows K (23.96) below D (27.11), reinforcing the prevailing weakness. It's this divergence between the oversold signals on shorter timeframes and the persistent bearish momentum that creates a complex trading environment. The key levels to watch on the daily chart are the support at $65,970 and the resistance at $67,412. A sustained move above resistance could signal a shift, while a break below support would confirm the bearish bias.
The Impact of Economic Data: PMI on the Horizon
Looking ahead, the upcoming Purchasing Managers' Index (PMI) data for the US, due soon, will be a critical catalyst. These reports provide a snapshot of the health of the manufacturing and services sectors, offering crucial insights into economic activity and, by extension, inflation pressures. If the PMI figures come in stronger than the forecast of 51.5 for manufacturing and 52 for services, it could reinforce the narrative of a resilient US economy, potentially strengthening the dollar further and putting additional pressure on BTCUSD. Conversely, weaker-than-expected numbers could signal economic cooling, potentially leading to a dollar pullback and offering a reprieve for risk assets.
The market's reaction to these data points will be heavily influenced by the Fed's current stance. With Fed officials increasingly vocal about inflation concerns, any data that suggests persistent price pressures is likely to be interpreted hawkishly, amplifying the dollar's strength. This is a scenario that traders are actively pricing in, as evidenced by the current market dynamics. The interplay between economic data, central bank policy expectations, and geopolitical risks creates a volatile cocktail for cryptocurrencies. Understanding these macro drivers is crucial for interpreting the technical signals correctly, as they often dictate the underlying market sentiment.
Geopolitical Tensions and Risk Appetite
Beyond the immediate economic data, escalating geopolitical tensions continue to play a significant role in shaping market sentiment. Events in the Persian Gulf and rising cyber threats against US infrastructure contribute to a general sense of global uncertainty. This environment naturally favors safe-haven assets, such as the US dollar, and can weigh on more speculative assets like Bitcoin. While the immediate impact of these tensions might not always be directly quantifiable in BTCUSD price action, they form the backdrop against which all trading decisions are made. A sudden escalation or de-escalation of these geopolitical risks could trigger sharp moves in risk appetite, directly impacting Bitcoin.
This heightened geopolitical backdrop also influences energy prices, which in turn can have ripple effects on inflation expectations and central bank policy. For example, the recent spike in Brent crude oil prices to $107.86, driven by geopolitical tensions and China's industrial activity, adds another layer of complexity to the inflation narrative. Higher energy costs can translate into broader inflationary pressures, potentially forcing central banks to maintain a tighter monetary policy for longer. This reinforces the dollar's strength and creates a more challenging environment for risk assets, including BTCUSD.
Trading Scenarios for BTCUSD
Bearish Scenario: Dollar Dominance Continues
65% ProbabilityNeutral Scenario: Range-Bound Consolidation
25% ProbabilityBullish Scenario: Dollar Weakens, Risk-On Returns
10% ProbabilityThe current technical setup, particularly the oversold RSI on shorter timeframes coupled with persistent bearish momentum, suggests that a range-bound consolidation or a further downside move is more probable in the immediate term. The bearish scenario, triggered by a break below the $65,970 support level, appears to have the highest probability, potentially leading to targets at $65,434 and even $64,528. The neutral scenario, where BTCUSD consolidates between $65,970 and $67,412, is also a strong possibility, especially if upcoming economic data provides mixed signals or if geopolitical tensions subside temporarily. The bullish scenario, requiring a decisive break above $67,412 resistance, currently seems less likely given the prevailing dollar strength and negative market sentiment.
What This Means for Traders
For traders, this environment calls for a cautious approach. The confluence of a strong dollar, potential for hawkish central bank rhetoric, and ongoing geopolitical risks creates a volatile backdrop. The oversold conditions on shorter BTCUSD charts might tempt some to enter long positions, but the broader bearish momentum and lack of a clear catalyst for dollar weakness suggest that such entries could be premature. Risk management is paramount. Traders should look for clear confirmation signals before committing to positions. A break below $65,970, confirmed by increased volume and a daily close below this level, would validate the bearish scenario. Conversely, a decisive move and hold above $67,412, especially if accompanied by a weakening DXY, could signal a shift.
The upcoming PMI data will be crucial in determining the short-term direction. A significantly weaker-than-expected report could trigger a dollar sell-off, potentially benefiting BTCUSD and opening the door for a move towards the $67,412 resistance. However, until such a catalyst emerges, the path of least resistance appears to be downwards, or at best, sideways. Traders should pay close attention to the DXY's movement and any shifts in Fed speak, as these macro factors are currently exerting more influence than the oversold technical signals on BTCUSD alone. Patience and disciplined execution of a well-defined trading plan are essential in navigating these choppy waters.
Frequently Asked Questions: BTCUSD Analysis
What happens if BTCUSD breaks below the $65,970 support level?
A break below $65,970, confirmed by increased volume, would likely validate the bearish scenario. This could trigger further selling pressure, potentially targeting $65,434 and then $64,528 as the next significant support levels.
Should I buy BTCUSD at current levels around $66,735 given the oversold RSI?
While the 1H RSI at 21.27 suggests oversold conditions, the overall bearish momentum and strong DXY present significant risks. A cautious approach is advised; look for confirmation like a break above $67,412 or a sustained dollar pullback before considering long positions.
Is the MACD histogram at -2189 a sell signal for BTCUSD on the daily chart?
Yes, a negative MACD histogram on the daily chart, like the current reading, indicates bearish momentum is building. While it doesn't signal an immediate entry, it reinforces the caution needed and suggests that upside potential may be limited until this signal reverses.
How will the upcoming US PMI data affect BTCUSD this week?
Stronger-than-expected PMI data could further boost the US Dollar (currently at 99.89), creating headwinds for BTCUSD. Conversely, weaker data might trigger a dollar pullback, potentially offering a bullish catalyst for Bitcoin, especially if it breaks above the $67,412 resistance.
Technical Outlook Summary
| Indicator | Value | Signal | Interpretation |
|---|---|---|---|
| RSI (14) | 21.27 | Bearish | Oversold on 1H, but overall trend is down |
| MACD Histogram | -2189 | Bearish | Negative momentum persists across timeframes |
| Stochastic | K:10.87, D:22.95 | Bearish | Oversold, but %K below %D confirms downward pressure |
| ADX | 34.26 | Bullish | Strong downward trend strength on 1H |
| Bollinger | Lower Band Break | Bearish | Price trading below lower band on 1H, indicating selling pressure |
Bearish Scenario: Dollar Dominance Continues
65% ProbabilityNeutral Scenario: Range-Bound Consolidation
25% ProbabilityBullish Scenario: Dollar Weakens, Risk-On Returns
10% ProbabilityTrack markets in real-time
AI-powered analysis, technical indicators and real-time price data.
Join Our Telegram Channel
Breaking market news, AI analysis and trading signals instantly.
Join Channel