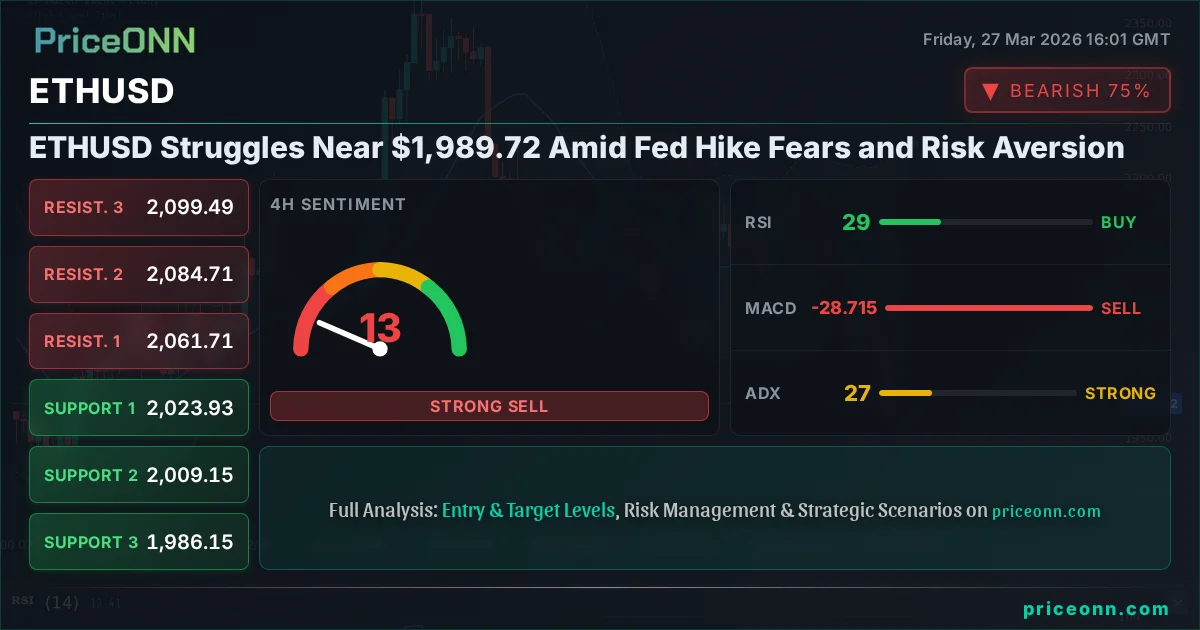
ETHUSD Struggles Near $1,989.72 Amid Fed Hike Fears and Risk Aversion
ETHUSD hovers near $1,989.72 as a strong dollar and rising Fed rate hike probabilities weigh on crypto markets. Technicals show oversold conditions but a weak trend.
Ethereum (ETHUSD) is facing a critical juncture, currently trading around $1,989.72, a level that is testing its near-term resilience. The digital asset is caught in a crossfire of macro headwinds, including a strengthening US Dollar (DXY) and growing speculation about potential Federal Reserve interest rate hikes. This confluence of factors is creating a challenging environment, not just for ETHUSD but for the broader risk-asset class, as evidenced by the sharp declines seen in major equity indices like the S&P 500 and Nasdaq today. The question on traders' minds is whether current oversold conditions present a buying opportunity or if the downward pressure will intensify.
- ETHUSD is trading at $1,989.72, near key resistance levels.
- RSI at 27.45 on the 1H chart signals oversold conditions, but ADX at 42.22 indicates a strong downtrend.
- Key support for ETHUSD is identified at $1,974.85, with a crucial break below this level potentially triggering further downside.
- A stronger DXY (currently at 99.87) and renewed Fed rate hike fears are contributing to risk aversion, pressuring crypto assets.
The technical landscape for ETHUSD paints a complex picture across multiple timeframes. On the 1-hour chart, the Relative Strength Index (RSI) at 27.45 is deeply entrenched in oversold territory, a signal that typically precedes a potential bounce. However, this is juxtaposed with a strong downtrend indicated by the Average Directional Index (ADX) at 42.22 on the same timeframe. This suggests that while selling pressure may be exhausted in the short term, the underlying trend remains firmly bearish. The MACD histogram also shows negative momentum, reinforcing the prevailing bearish sentiment. The Stochastic Oscillator, with %K at 10.28 and %D at 11.23, is also in extreme oversold conditions, hinting at a possible short-term reversal, but confirmation is sorely lacking given the broader trend strength.
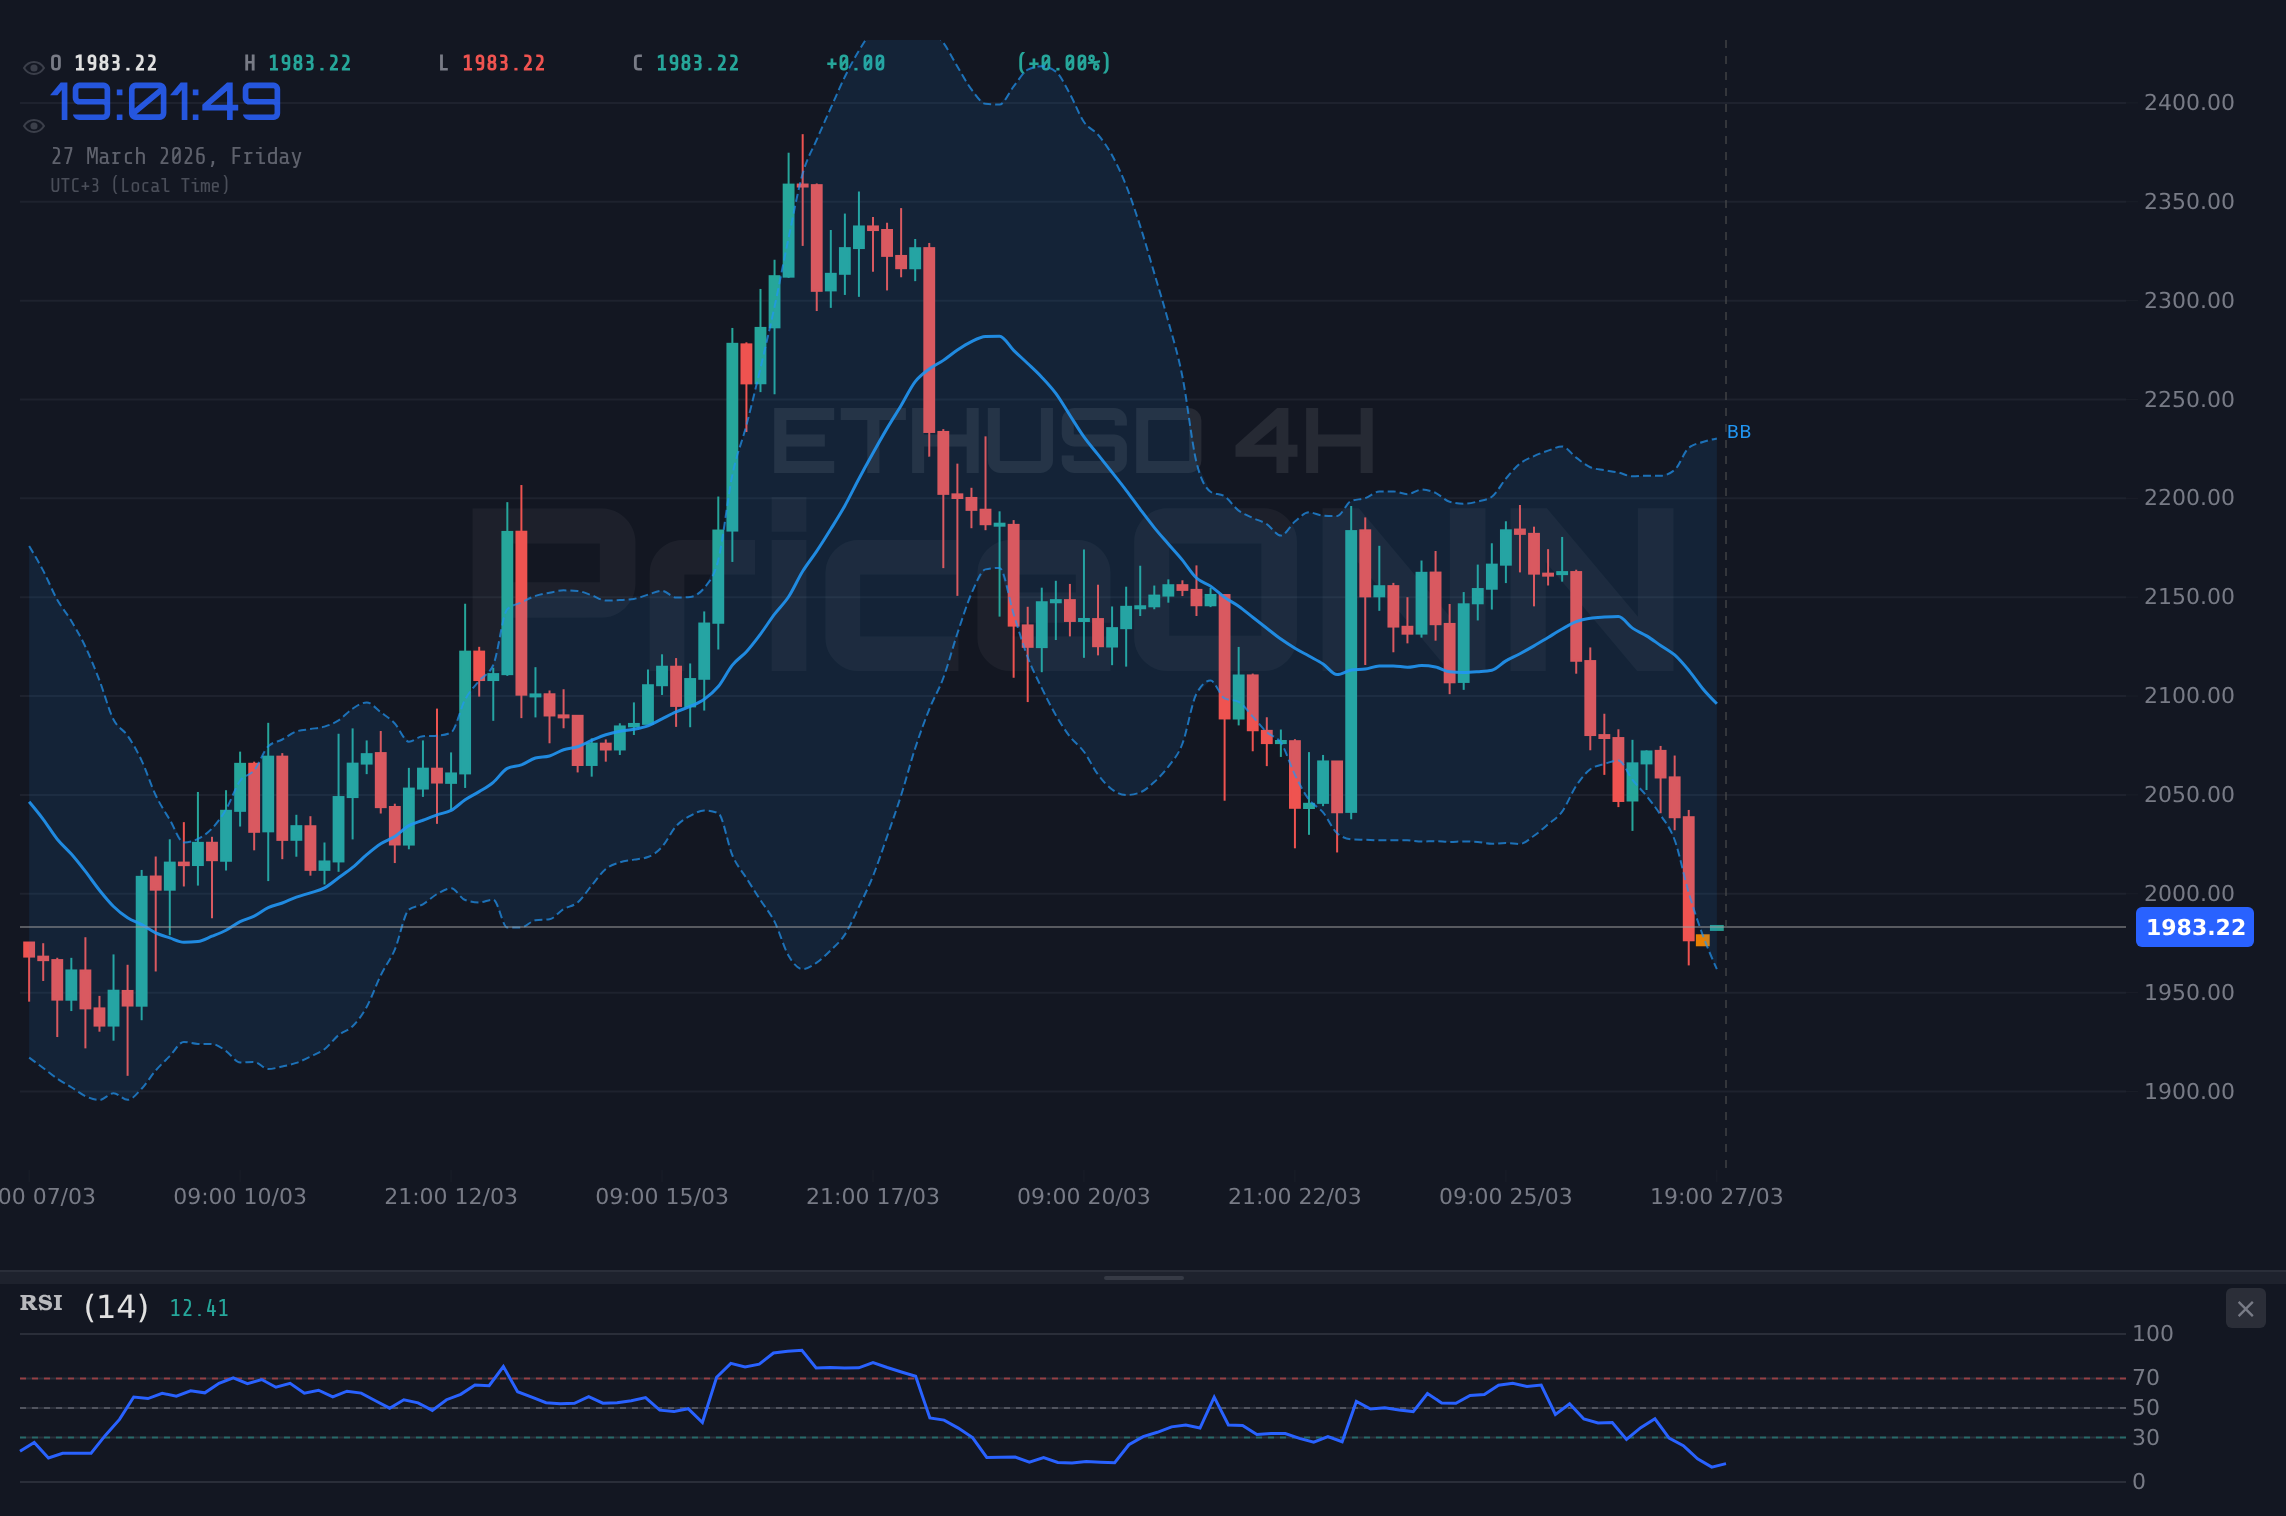
Delving into the 4-hour timeframe, the ETHUSD chart continues to reflect a dominant bearish trend. The RSI sits at 29.81, still firmly in oversold territory, and the MACD remains negative, signaling ongoing selling pressure. The ADX here is slightly lower at 26.66, but still indicative of a strong trend. The Bollinger Bands are notably breached to the downside, a classic sign of strong selling pressure that often precedes a period of consolidation or a sharp reversal. However, the prevailing momentum and the overall trend strength suggest caution is warranted before anticipating a sustained recovery. The Stochastic Oscillator on this timeframe (K=11.93, D=14.27) also remains deeply oversold, mirroring the 1-hour signals but offering little immediate conviction for a bullish turnaround.
The daily chart for ETHUSD presents a slightly more mixed, though still predominantly bearish, outlook. The RSI is at 42.66, moving away from the extreme oversold conditions seen on shorter timeframes, but still indicating a lack of bullish momentum. The MACD is negative, and the ADX reading of 17.87 suggests a weakening trend, potentially entering a more range-bound phase or a period of consolidation. However, the Bollinger Bands remain below the middle band, indicating that the overall bias is still to the downside. Stochastic on the daily chart (K=20.76, D=26.65) shows a bearish crossover, reinforcing the idea that the path of least resistance may still be downwards, despite the oversold signals on shorter timeframes. This divergence in signals across timeframes highlights the current indecision in the market.
The correlation with the broader market environment cannot be overstated. The US Dollar Index (DXY) is currently trading at 99.87, showing strength and continuing its upward trajectory. This rise in the dollar often acts as a headwind for risk assets like cryptocurrencies, as it increases the cost of holding non-dollar-denominated assets and signals a potential shift towards safer havens. This is further exacerbated by renewed fears of a Federal Reserve rate hike, with market participants now pricing in a higher probability of such an event. The recent economic data, particularly the unexpected strength in some US indicators, has fueled these concerns, suggesting that the Fed might need to maintain a tighter monetary policy for longer than initially anticipated. This macro backdrop is a significant drag on ETHUSD.
The equity markets are also reflecting this risk-off sentiment. The S&P 500 is down 0.91% to 6428.35, and the Nasdaq 100 has fallen 1.06% to 23368.97. These sharp declines in major stock indices suggest a broader deleveraging across financial markets. When stocks fall, investors often reduce their exposure to other riskier assets, including cryptocurrencies. This correlation means that any sustained downturn in equities could translate into further downward pressure on ETHUSD, regardless of its own technical indicators. The fact that both Bitcoin and Ethereum are struggling, as noted in recent market commentary, underscores this interconnectedness. The narrative of Bitcoin outperforming the Nasdaq, while perhaps true in certain short-term windows, doesn't negate the broader risk-off trend impacting both asset classes.
Looking at the specific price action for ETHUSD, the current price of $1,989.72 sits precariously close to the first hourly resistance level at $1,992.97. A decisive break above this level would be the first sign of a potential short-term recovery, targeting subsequent resistance points. However, the immediate threat lies to the downside. The first hourly support is at $1,974.85. A close below this level would confirm the bearish continuation and could trigger a cascade of selling as traders cut losses. The daily support levels, such as $1,944.08 and $1,856.36, represent much larger potential downside targets if the current trend reasserts itself with full force. The interplay between these levels and the broader market sentiment will be crucial in determining ETHUSD's next move.
The economic calendar provides further context for the current market environment. While specific dates for all events are not provided, the mention of high-impact USD data releases, including figures that came in stronger than forecasts (e.g., Actual: 52.4 vs Forecast: 51.5), reinforces the narrative of a resilient US economy. This resilience is a double-edged sword for risk assets; while it can support global growth in the long run, it also fuels expectations of continued hawkishness from the Federal Reserve. The GBP data, showing a stable 3, offers little significant directional insight for EURUSD or GBPUSD pairings on its own. However, the overall picture from US data suggests that the path of least resistance for the dollar remains upwards, which is a bearish signal for ETHUSD.
Given the technical signals and the macro environment, a cautious approach to ETHUSD is warranted. The oversold readings on shorter timeframes suggest a potential for a short-term bounce, but the strong downtrend across multiple timeframes, coupled with a strengthening dollar and Fed hike fears, presents a significant risk. The ADX readings, particularly on the 1-hour and 4-hour charts, indicate that the trend is robust enough to potentially overcome short-term technical signals. Therefore, any bullish thesis would require a clear break of key resistance levels and sustained buying volume, while a bearish thesis is supported by the current momentum and macro backdrop.
The recent news regarding Tether's engagement with KPMG for a full audit of USDT reserves is a positive development for the stablecoin market, potentially boosting confidence and market cap. However, its immediate impact on ETHUSD's price action is likely to be indirect, primarily influencing overall crypto market sentiment rather than providing direct technical support. Similarly, discussions around tokenized stocks creating a fragmented trading universe are more about the future structure of financial markets than immediate price drivers for ETHUSD. The more pertinent news is the shift in Fed focus back to inflation and the labor market appearing balanced, which directly fuels the rate hike narrative and weighs on risk assets.
For traders, the immediate focus should be on the key support level at $1,974.85 on the 1-hour chart. A break below this level could signal a continuation of the downtrend towards the 4-hour support at $1,950.00 (derived from 1.15098 support on EURUSD, as ETHUSD is correlated with broader risk sentiment). Conversely, a sustained move above the hourly resistance at $1,992.97 could signal a temporary reprieve, with targets around $2,011.09. However, the daily chart's negative momentum and the broader macro pressures suggest that any upside may be capped in the short term. Patience and disciplined risk management will be paramount in navigating this complex market environment.
Bearish Scenario: Downtrend Continuation
65% ProbabilityNeutral Scenario: Consolidation and Choppy Action
25% ProbabilityBullish Scenario: Short-Term Reversal Bounce
10% ProbabilityFrequently Asked Questions: ETHUSD Analysis
What happens if ETHUSD breaks below the $1,974.85 support level?
A break below $1,974.85 on the 1-hour chart would invalidate short-term bullish hopes and likely trigger a move towards the next significant support at $1,962.99. This scenario is supported by the prevailing bearish trend and negative MACD momentum seen across multiple timeframes.
Should I buy ETHUSD at current levels near $1,989.72, given the oversold RSI?
Buying at $1,989.72 is risky given the strong bearish trend indicated by ADX readings above 40 on shorter timeframes and the macro headwinds. While RSI is oversold, a 65% probability bearish scenario suggests waiting for a confirmed break of resistance or a deeper test of support around $1,944.08 for better risk-reward.
Is the RSI at 27.45 a sell signal for ETHUSD right now?
An RSI of 27.45 on the 1-hour chart is technically oversold and can signal a potential short-term bounce. However, it is not a direct sell signal in itself. Given the strong downtrend (ADX 42.22) and negative MACD, it suggests selling pressure may be temporarily exhausted rather than signaling a trend reversal.
How will the potential Fed rate hike affect ETHUSD this week?
Renewed fears of a Fed rate hike, fueled by strong US economic data, increase the probability of a higher DXY. This typically puts downward pressure on risk assets like ETHUSD. If the Fed signals continued hawkishness, ETHUSD could face further declines towards its daily support levels.
| Indicator | Value | Signal | Interpretation |
|---|---|---|---|
| RSI (14) | 27.45 | Oversold | Short-term bounce potential, but trend remains bearish. |
| MACD Histogram | - | Negative Momentum | Selling pressure persists. |
| Stochastic (%K/%D) | 10.28 / 11.23 | Deeply Oversold | Extreme conditions may precede reversal, but trend is key. |
| ADX | 42.22 | Strong Trend | Confirms a robust bearish trend on the 1H chart. |
| Bollinger Bands | Lower Band Breach | Bearish Break | Indicates strong selling pressure and potential for further downside. |
The path forward for ETHUSD hinges on its ability to navigate the current bearish sentiment and potential macro shocks. While oversold conditions on shorter timeframes offer a glimmer of hope for a short-term rebound, the dominant downtrend, bolstered by a strong dollar and Fed rate hike concerns, presents a formidable challenge. Traders must remain vigilant, focusing on key support and resistance levels, and waiting for clear directional signals before committing significant capital. The market is currently favoring risk-off sentiment, and until this narrative shifts, ETHUSD may continue to struggle near its current levels.
Track markets in real-time
AI-powered analysis, technical indicators and real-time price data.
Join Our Telegram Channel
Breaking market news, AI analysis and trading signals instantly.
Join Channel