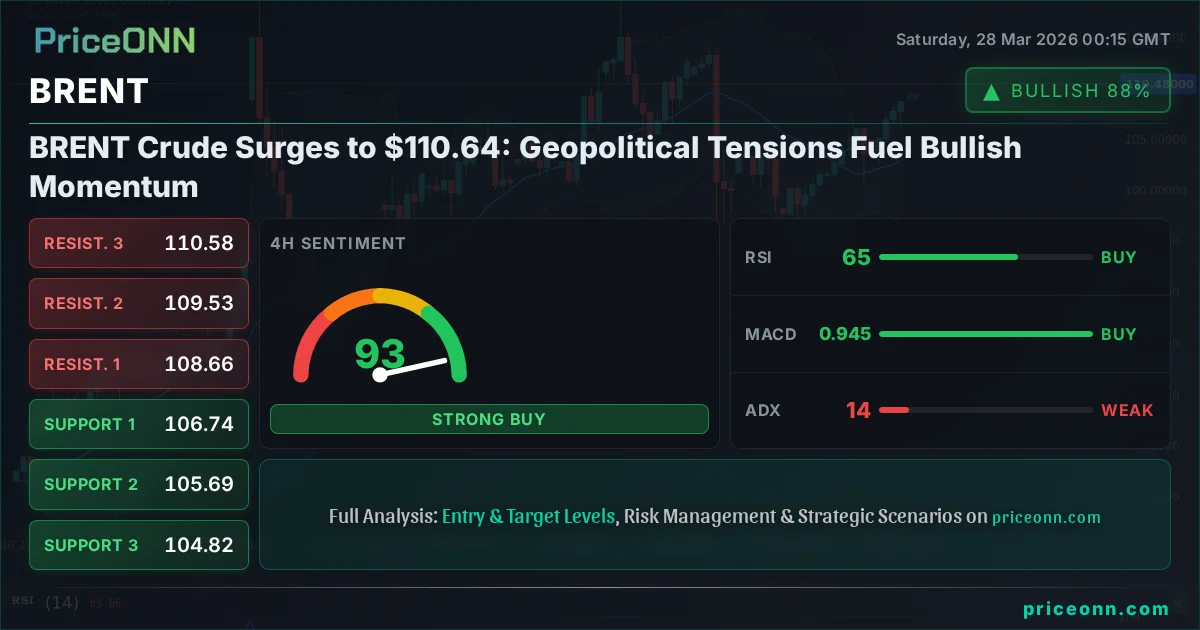
BRENT Crude Surges to $110.64: Geopolitical Tensions Fuel Bullish Momentum
BRENT Crude hit $110.64 with a 6.77% weekly gain amid escalating Middle East tensions. Technicals show strong bullish momentum, but overbought conditions loom.
The geopolitical landscape is once again casting a long shadow over global energy markets, with BRENT Crude experiencing a dramatic surge, breaching the significant $110.64 mark. This powerful upward move, representing a 6.77% gain over the past week, is not merely a reaction to fluctuating supply-demand dynamics but a stark reflection of escalating tensions in the Middle East. As headlines flash with news of potential supply disruptions and heightened regional instability, traders and analysts are recalibrating their positions, pushing crude prices into territory not seen in months. This rally, while impressive, brings with it a host of technical indicators flashing warning signs, suggesting that the path forward for BRENT may be as volatile as the events driving its ascent. Understanding the confluence of these geopolitical pressures and the resulting technical formations is crucial for navigating this complex market environment.
- BRENT Crude closed the week at $110.64, marking a significant 6.77% weekly gain driven by geopolitical tensions.
- On the 1-hour chart, RSI at 79.21 signals overbought conditions, suggesting a potential for pullback.
- The 4-hour chart shows ADX at 14.41, indicating a weak trend and potential choppiness despite the bullish price action.
- Geopolitical risks, particularly in the Middle East, are the primary catalyst, influencing oil prices more than traditional supply-demand factors currently.
The past week has been a whirlwind for energy traders, with BRENT Crude demonstrating remarkable resilience and upward momentum, culminating in a decisive close at $110.64. This price point is not just a number; it represents a significant psychological and technical barrier that has been overcome, driven by a potent cocktail of geopolitical anxieties and a tightening global supply outlook. The narrative driving this surge is multifaceted, but the specter of conflict in the Middle East undeniably plays a starring role. Reports of escalating skirmishes and the potential for broader regional instability have sent shockwaves through the market, immediately translating into fears of supply disruptions. Such fears, even if they do not materialize into actual supply cuts, are often enough to ignite a speculative frenzy, pushing prices higher as market participants price in a risk premium. This risk premium is a crucial element in understanding BRENT's current trajectory, as it adds a layer of complexity beyond simple inventory reports or demand forecasts. The market is essentially pricing in the *possibility* of future supply constraints, a forward-looking mechanism that can often override current fundamental data.
From a technical standpoint, the weekly close at $110.64 on BRENT presents a compelling picture, though one fraught with nuance. The daily chart, for instance, shows a powerful uptrend, with the price firmly above the middle Bollinger Band and the ADX indicator at a robust 62.64, signaling a very strong trend. This suggests that the underlying momentum behind the move is significant and has been building over time. However, zooming into shorter timeframes reveals a more cautious outlook. The 1-hour RSI reading of 79.21 is firmly in overbought territory, a classic signal that the asset may be due for a correction or consolidation. Similarly, the Stochastic Oscillator on the 1-hour chart is also in overbought territory, with the %K line above the %D line, but the overall market structure on this shorter timeframe exhibits a neutral trend (ADX 19.33). This divergence between the strong daily trend and the overbought signals on shorter timeframes is a critical point of analysis. It suggests that while the broader trend remains bullish, the immediate upward push might be losing steam, and a period of consolidation or even a short-term pullback is a distinct possibility before the next significant move.
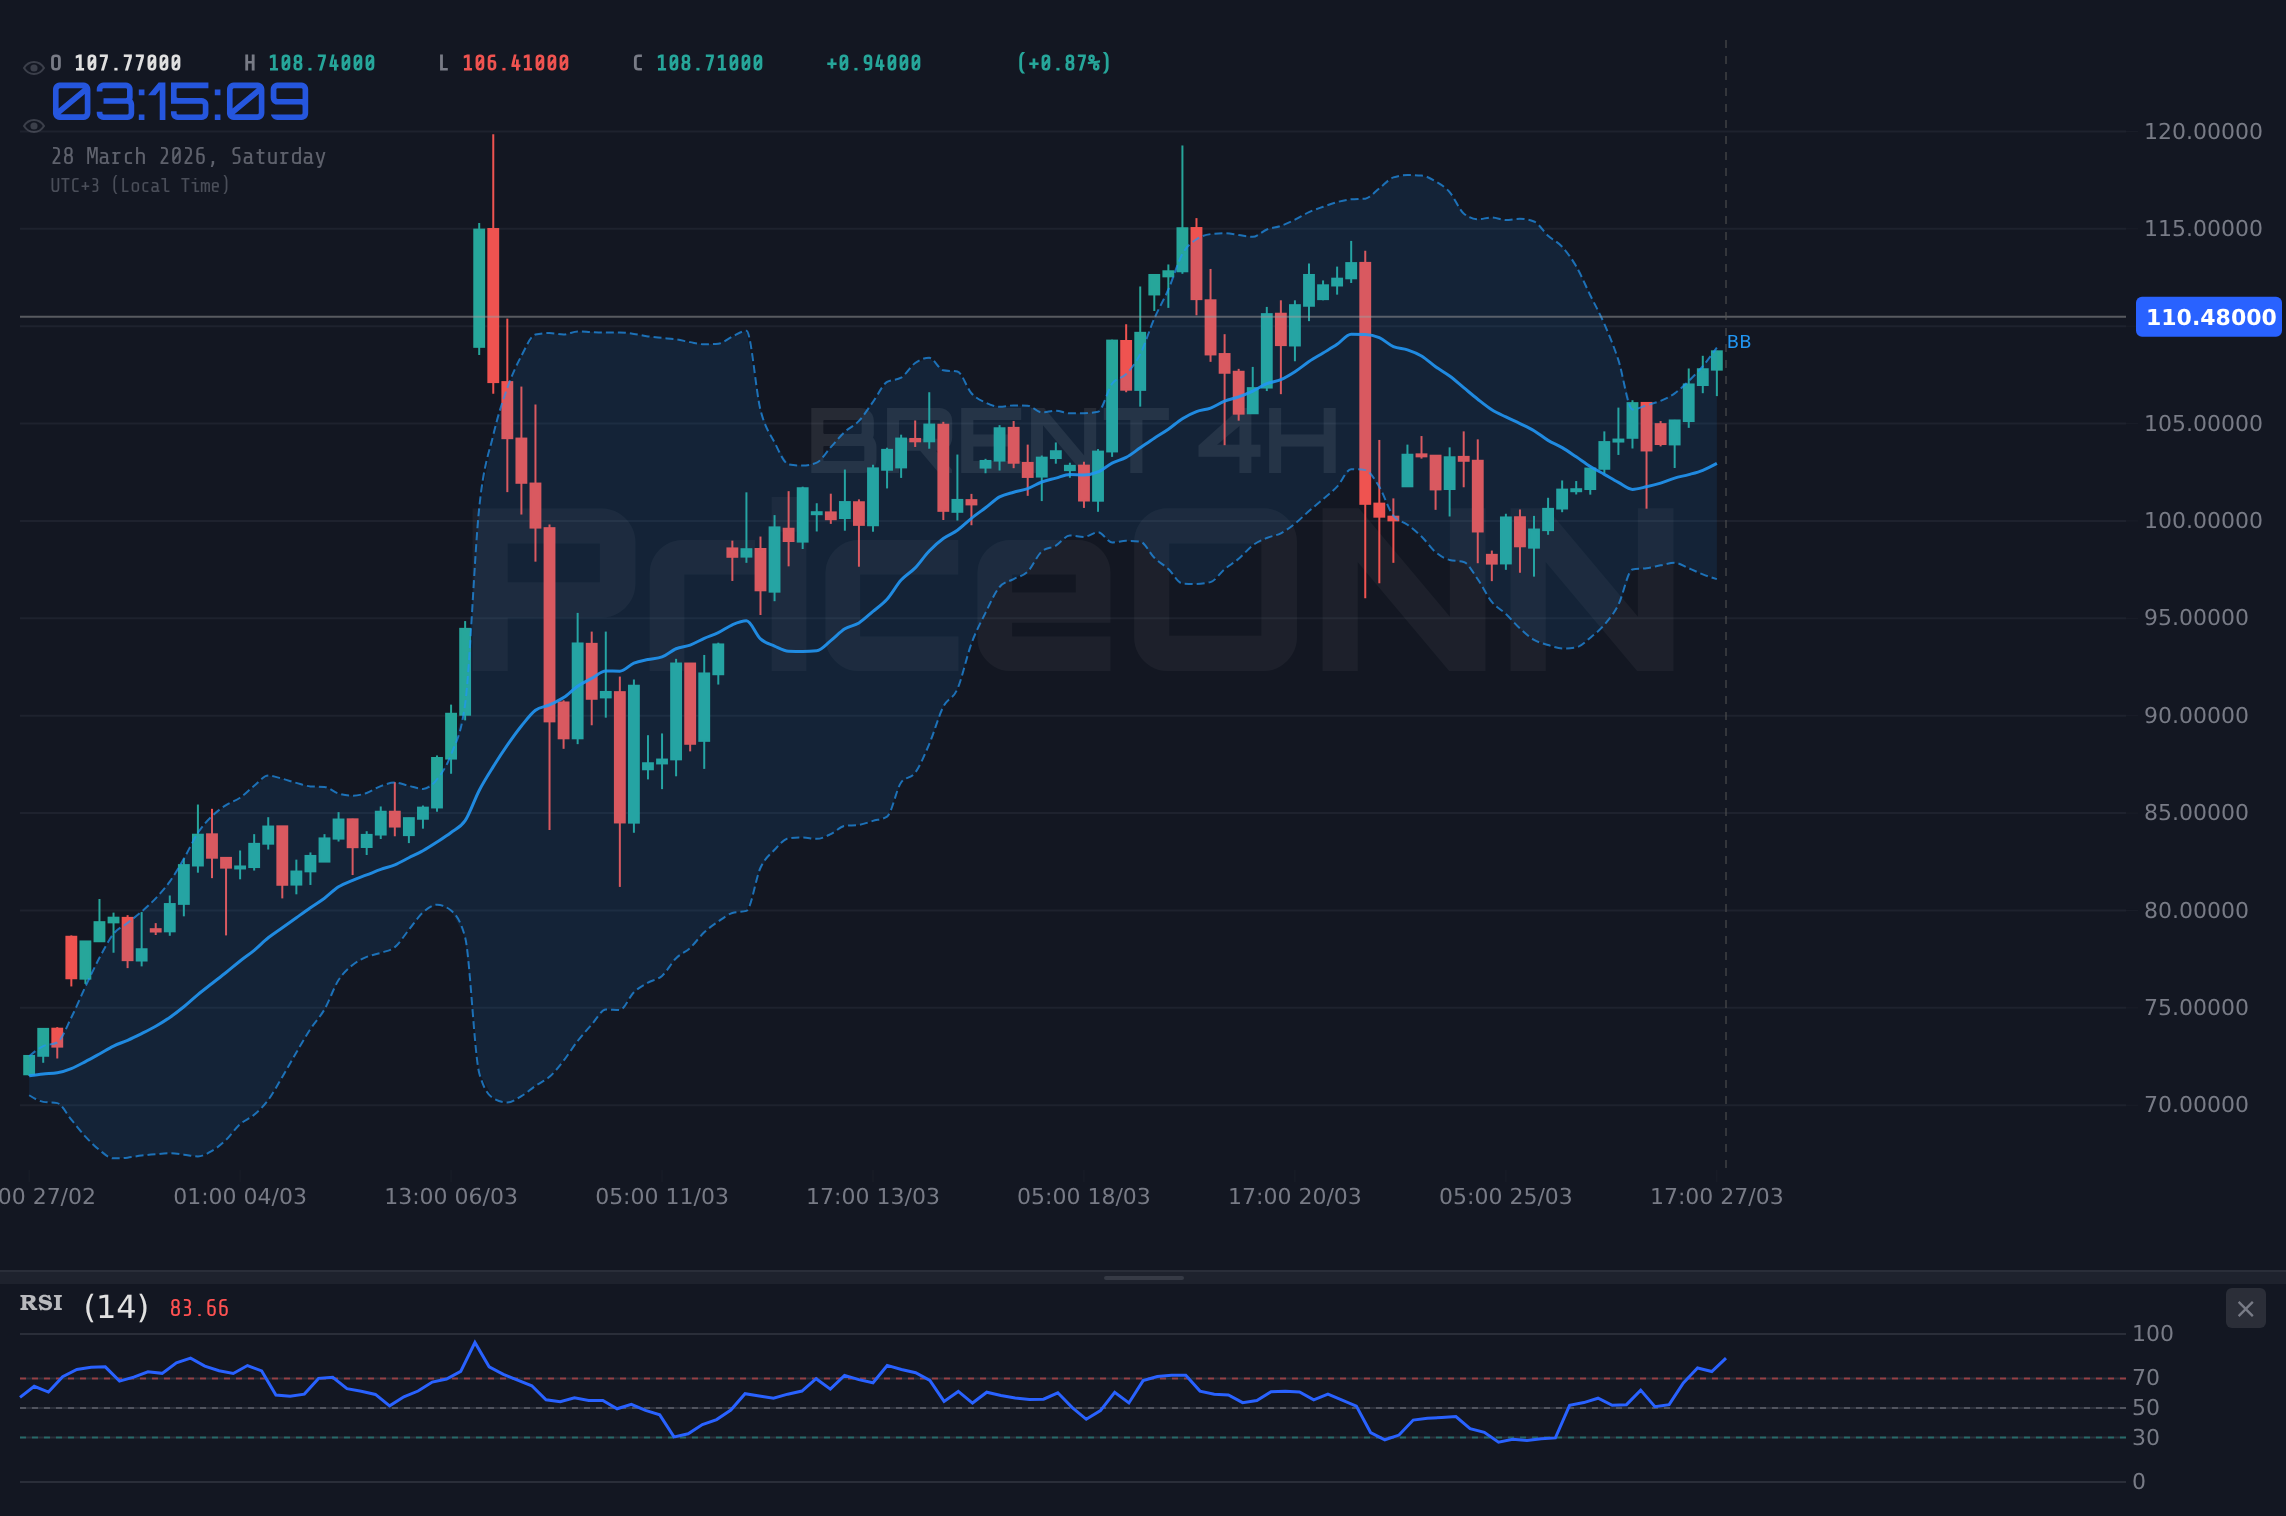
Delving deeper into the technical indicators, the 4-hour chart for BRENT offers a slightly different, yet equally important, perspective. Here, the ADX stands at 14.41, a reading that typically signifies a weak trend or a market that is consolidating rather than trending strongly. This contrasts sharply with the strong trend indicated on the daily chart. This discrepancy highlights the choppiness that can occur even within a dominant trend. While the daily chart might show a clear direction, the 4-hour timeframe suggests that the price action might be characterized by fluctuations and a lack of sustained directional commitment in the short to medium term. The Stochastic Oscillator on this timeframe is also deep in overbought territory (K=93.27, D=82.7), reinforcing the idea that the rapid ascent might be reaching a temporary exhaustion point. The RSI, at 64.95, is also approaching overbought levels, though not as extreme as on the 1-hour chart. This suggests that while the daily trend is strong, the immediate path higher might face headwinds, requiring traders to be more selective and patient.
The current price of $110.64 for BRENT Crude is situated within a context of heightened global risk appetite, or rather, a risk-off sentiment that disproportionately benefits commodities like oil. The Dollar Index (DXY), currently trading at 99.91 and showing a strong upward trend across all analyzed timeframes, plays a crucial role here. Typically, a strengthening dollar puts downward pressure on dollar-denominated commodities like oil, as they become more expensive for holders of other currencies. However, in the current geopolitical climate, the dollar's strength is acting as a safe-haven asset, reflecting global uncertainty. This dynamic creates a complex correlation where both oil prices and the dollar are rising simultaneously, driven by fear and a flight to perceived safety. This unusual correlation means that traditional inverse relationships are temporarily suspended, making market analysis more challenging. Investors are not just looking at supply and demand; they are actively hedging against geopolitical instability, which benefits both oil as a key commodity and the dollar as a global reserve currency.
Furthermore, the performance of major equity indices like the SP500 and Nasdaq 100 adds another layer to this analysis. Both indices have experienced significant downturns, with SP500 at 6357.55 and Nasdaq 100 at 23092.5, both showing substantial daily declines. This broad market selloff is a clear indicator of declining risk appetite among investors. When equities falter, capital often seeks refuge in assets perceived as safer or as inflation hedges, such as gold, US Treasuries, and, in this specific geopolitical context, oil. The surge in BRENT Crude, therefore, can be partly attributed to this flight to safety, as investors rotate out of riskier assets and into commodities that are directly impacted by, and can even influence, the unfolding geopolitical events. This correlation between falling equities and rising oil prices underscores the current market's nervousness and its focus on stability and tangible assets amidst widespread uncertainty.
Looking at the economic calendar, several key events from the past week and upcoming releases provide crucial context for BRENT's price action. The US reported a significant increase in its trade balance deficit, with actual figures at 6.926 versus a forecast of -1.3, indicating a weaker dollar trend that could, in theory, support commodities. However, this was counteracted by other data points. The US Producer Price Index (PPI) came in higher than expected at 0.2, suggesting underlying inflationary pressures that could, in turn, boost oil prices as a hedge against inflation. Upcoming economic data, particularly from the US and the UK, will be critical. For instance, any significant deviations in upcoming employment or inflation figures could either exacerbate the current risk-off sentiment, further bolstering oil prices, or signal a potential shift in central bank policy, which could impact global growth expectations and, consequently, oil demand. The market's reaction to these figures will be closely watched.
The historical context of oil price surges driven by geopolitical events is extensive and provides valuable insights. We have seen similar patterns emerge during previous conflicts in the Middle East, such as the Gulf War or the Iraq War, where oil prices experienced sharp and sustained rallies due to fears of supply disruptions. In those instances, the immediate price reaction was often followed by periods of volatility as the actual impact on supply became clearer and diplomatic efforts intensified or failed. The current situation, while unique in its specifics, shares this fundamental driver: the market's sensitivity to potential supply shocks in a region critical for global energy security. Investors who have weathered such storms before know that while geopolitical risk can propel prices upward rapidly, the sustainability of these gains often depends on the duration and severity of the conflict, as well as the broader macroeconomic backdrop.
For scalpers and day traders, the current BRENT market presents both opportunities and significant risks, especially given the conflicting signals across different timeframes. The strong daily trend suggests that buying pullbacks might be a viable strategy, but the overbought conditions on the 1-hour and 4-hour charts indicate that short-term traders must exercise extreme caution. A breakdown below the immediate support levels, such as $110.09 on the 4-hour chart or even $109.39, could signal a short-term reversal, offering opportunities for bearish trades. Conversely, a sustained break above the immediate resistance at $110.77 could signal a continuation of the intraday bullish momentum. Given the ADX reading of 14.41 on the 4-hour chart, ranging trades within defined support and resistance zones might be more prudent than chasing strong directional moves in the very short term.
Swing traders, operating on a timeframe of days to weeks, will likely be focused on the daily chart's bullish signals, particularly the strong ADX of 62.64. The key will be to identify pullbacks to significant support levels. On the daily chart, the first significant support is identified around $106.34, followed by $100.77. A bounce from these levels, especially if accompanied by bullish confirmation signals like RSI moving out of overbought territory or MACD showing renewed upward momentum, could present a favorable risk-reward setup for long positions. However, the overbought Stochastic on the 1-hour and 4-hour charts suggests that waiting for a clearer consolidation or a minor correction before entering long positions might be a more prudent approach to avoid buying at a temporary peak.
Long-term investors, whose horizons span months or even years, will view the current BRENT price action through the lens of fundamental supply constraints and the ongoing geopolitical narrative. The fact that oil prices are surging despite a generally risk-off environment and a strengthening dollar suggests that the supply-side concerns are currently outweighing broader macroeconomic headwinds. The persistent geopolitical tensions in the Middle East, coupled with potential supply squeezes elsewhere (as indicated by news about Japan considering coal revival due to soaring LNG prices), create a supportive backdrop for sustained higher oil prices. For these investors, the key levels to watch are not just short-term resistances but the longer-term supply/demand fundamentals and the geopolitical trajectory. A sustained break above key long-term resistance levels, coupled with continued geopolitical instability, could signal the beginning of a more prolonged bullish phase.
The correlation analysis further deepens our understanding of the BRENT market's current drivers. The strong upward trend in the DXY (99.91) is unusual in its simultaneous occurrence with rising oil prices, highlighting the dominance of safe-haven flows. Typically, a stronger dollar would suppress oil prices. However, the current geopolitical climate has created a scenario where both are rising, driven by fear. This means that a weakening dollar would likely add further fuel to the BRENT rally, while a continued strengthening of the dollar, if driven by factors other than pure geopolitical fear (e.g., strong US economic data), could eventually start to weigh on oil prices. The inverse correlation with equities (SP500 at 6357.55, Nasdaq 100 at 23092.5) is also noteworthy; the selloff in stocks suggests a broader deleveraging or risk aversion that is paradoxically benefiting oil. This complex interplay requires traders to monitor multiple markets simultaneously.
Considering the technical indicators, the daily chart presents a strong bullish bias, with the ADX at 62.64 indicating a very strong trend. The price is trading above the middle Bollinger Band, suggesting upward momentum. However, the RSI at 69.37 is nearing overbought territory, and the Stochastic oscillator is showing a potential bearish divergence on the 1-hour timeframe. This conflict in signals across different timeframes is key. While the longer-term trend is undeniably bullish, the shorter-term indicators suggest that a period of consolidation or a minor pullback is likely before the trend can resume. This is a classic 'buyable dip' scenario if the support levels hold, but it requires patience and careful risk management, as a failure of these supports could signal a deeper correction.
The recent PriceONN market news highlights the growing concerns surrounding energy prices. Reports indicate that Goldman Sachs has boosted its oil price forecasts, signaling increased confidence in the bullish outlook. This professional forecast, coupled with the ongoing geopolitical narrative, reinforces the upward pressure on BRENT. The news about India slashing fuel taxes and curbing exports amidst a deepening oil crisis also adds to the complexity; while domestic measures aim to ease consumer burden, the export curbs could tighten global supply further. These events are not isolated; they are interconnected pieces of a larger puzzle that point towards a supply-constrained market environment, making the $110.64 price level for BRENT Crude a focal point for both immediate trading and longer-term strategic positioning.
Looking ahead, the market will be intensely focused on any further developments in the Middle East. Any de-escalation of tensions could lead to a rapid unwinding of the geopolitical risk premium, potentially causing a sharp correction in BRENT prices. Conversely, any escalation or confirmation of supply disruptions would likely send prices even higher, potentially testing new resistance levels. Economically, upcoming inflation and central bank policy cues will be vital. If inflation remains stubbornly high, it could support commodity prices, but if central banks signal aggressive tightening, it could dampen growth expectations and oil demand. Traders will be closely watching the $110.64 level as a reference point; a sustained hold above this price could confirm the bullish sentiment, while a failure to do so might signal a shift in momentum.
The current technical setup for BRENT Crude, with its strong daily trend but overbought shorter-term indicators, suggests a market at a critical juncture. While the geopolitical backdrop provides a powerful tailwind, the potential for profit-taking and consolidation cannot be ignored. For those looking to trade this market, patience will be a virtue. Identifying clear entry and exit points based on the confluence of technical levels and evolving geopolitical news will be paramount. The $110.64 price point is more than just a recent high; it is a level that will likely dictate the near-term direction. Whether it becomes a springboard for further gains or a ceiling for a much-needed correction remains the key question as the market digests the latest developments.
The interplay between macroeconomics and geopolitics is rarely as pronounced as it is in today's energy markets. The surge in BRENT Crude to $110.64 is a testament to how global events can override traditional market indicators. While technicals offer valuable insights into potential entry and exit points, it is the fundamental narrative - in this case, geopolitical instability - that is providing the primary impetus for price action. The challenge for traders lies in discerning when the technicals are merely reflecting the underlying fundamental trend and when they are signaling a potential short-term reversal or consolidation. With multiple timeframes offering conflicting signals, a nuanced approach is required, focusing on risk management and waiting for clearer confirmation before committing capital.
For scalpers, the volatility around the $110.64 level offers quick-in, quick-out opportunities, but the risk of being caught on the wrong side of a sudden geopolitical headline is substantial. A tight stop-loss strategy is essential. Swing traders might look for pullbacks towards the daily support levels, such as $106.34, anticipating a continuation of the broader uptrend. Long-term investors, meanwhile, will likely view any significant dips as potential accumulation opportunities, given the fundamental supply tightness and geopolitical risk premium that appear to be supporting prices for the foreseeable future. The key takeaway is that the market is being driven by fear and fundamental supply concerns, making it a challenging but potentially rewarding environment for those who can navigate its complexities.
The price action around $110.64 is critical. If BRENT can consolidate above this level, it suggests that the bullish sentiment is firmly intact and potentially ready to test higher resistance levels. However, failure to hold this price, particularly with a close below the 4-hour support at $110.09, could signal a short-term reversal, opening the door for bears to target lower levels. The ADX on the 4-hour chart at 14.41 suggests that any move below support might not be immediately sharp but could lead to a period of range-bound trading. Conversely, a decisive break above immediate resistance at $110.77, especially on increased volume and positive geopolitical news, could signal the continuation of the rally towards the $111.91 daily resistance target.
The market's reaction to upcoming economic data will also be a significant factor. If inflation figures continue to surprise to the upside, it could reinforce the case for higher oil prices, as oil is often seen as a hedge against rising costs. However, if central banks perceive such inflation as a reason for aggressive monetary tightening, it could dampen global growth prospects, thereby reducing oil demand. This creates a delicate balancing act for policymakers and a complex environment for traders. The current geopolitical premium added to BRENT prices means that any easing of tensions could lead to a swift price correction, even if underlying economic fundamentals remain supportive of higher prices.
The correlation with other markets remains a key theme. The simultaneous rise of the DXY (99.91) and BRENT Crude highlights the unique market conditions driven by safe-haven demand. This decoupling from traditional inverse relationships means that traders cannot rely solely on dollar strength as a bearish indicator for oil. Similarly, the sharp decline in equities (SP500 at 6357.55) provides a backdrop of risk aversion that fuels demand for commodities perceived as tangible assets. Understanding these interconnected movements is essential for forming a comprehensive market view. The unusual strength in both the dollar and oil suggests that fear is the dominant market sentiment, overriding typical economic correlations.
The technical analysis across different timeframes paints a picture of a strong underlying uptrend being challenged by short-term overbought conditions. While the daily chart (ADX 62.64) screams 'strong trend', the 1-hour chart (RSI 79.21, ADX 19.33) warns of potential exhaustion. This suggests that BRENT might be entering a phase of consolidation or a minor pullback before potentially resuming its upward trajectory. For traders, this translates to a need for caution. Entering long positions at current elevated levels carries risk, while shorting against such a strong daily trend is also perilous. The most prudent approach might be to wait for a clearer signal - either a pullback to a significant support level that holds, or a confirmed breakout above immediate resistance on increased volume.
The PriceONN market news from the past week, particularly the mention of Goldman Sachs revising its oil price forecasts upward, adds a layer of institutional validation to the bullish sentiment. This suggests that major players in the market also anticipate higher prices, likely due to the same fundamental drivers - geopolitical risk and supply concerns. This consensus among analysts and institutions can create a self-fulfilling prophecy, further bolstering prices. However, it also means that any negative geopolitical development or unexpected increase in supply could lead to a sharp reversal, as positions are unwound rapidly.
The scenario cards below illustrate the potential paths forward for BRENT Crude. The bullish scenario hinges on continued geopolitical escalation and a break above current resistance, while the bearish scenario anticipates a consolidation or pullback due to overbought conditions and potential de-escalation. The neutral scenario acknowledges the possibility of range-bound trading as the market digests conflicting signals. Each scenario is tied to specific price levels and conditions, providing a framework for traders to navigate the inherent uncertainty.
Bullish Scenario: Geopolitical Escalation Continues
55% ProbabilityNeutral Scenario: Consolidation Around $110.64
30% ProbabilityBearish Scenario: Overbought Conditions Trigger Profit-Taking
15% ProbabilityThe path forward for BRENT Crude appears heavily influenced by geopolitical developments, with technical indicators providing crucial levels for risk management and trade execution. While the daily trend remains strongly bullish, the overbought conditions on shorter timeframes suggest caution is warranted. Market participants will be closely monitoring the $110.64 level as a key pivot point. A sustained hold above this price could signal further upside potential, especially if geopolitical tensions continue to escalate. Conversely, a failure to hold this level, coupled with a de-escalation of regional conflicts, could trigger significant profit-taking and a move towards lower support levels. The unusual correlation with a strengthening dollar and weakening equities underscores the current fear-driven market sentiment, making oil a potential safe-haven asset in the short term.
Ultimately, navigating the BRENT market at these elevated levels requires a keen eye on both the geopolitical headlines and the technical chart patterns. The strong bullish momentum indicated by the daily ADX (62.64) cannot be ignored, but the overbought Stochastic and RSI on shorter timeframes suggest that the immediate path higher may not be a straight line. Traders should be prepared for volatility and potential consolidation around the $110.64 mark. For long-term investors, the fundamental supply concerns and geopolitical risk premium appear to provide a supportive floor, suggesting that any significant dips could be viewed as buying opportunities. However, risk management remains paramount; understanding the invalidation levels for each scenario is crucial before committing capital.
The current market environment for BRENT Crude is a prime example of how geopolitical factors can significantly amplify commodity price movements, often overriding traditional economic indicators. The surge to $110.64 is a clear signal of market anxiety regarding potential supply disruptions in the Middle East. While technical analysis provides levels for entry and exit, the fundamental narrative is currently the dominant force. For traders, this means staying informed about geopolitical developments is as crucial as understanding chart patterns. The unusual market correlations observed - a rising dollar and falling equities alongside rising oil prices - underscore the pervasive fear driving markets. This complex interplay demands a cautious yet opportunistic approach, focusing on risk management and waiting for clear signals amidst the noise.
The strong upward trend on the daily chart, reinforced by an ADX reading of 62.64, suggests that the underlying bullish sentiment for BRENT Crude is robust. However, the overbought conditions indicated by the RSI (79.21 on 1H) and Stochastic oscillators on shorter timeframes cannot be overlooked. This divergence implies that while the long-term trend remains positive, the immediate price action might experience consolidation or a minor pullback. The critical support level to watch is around $110.09 on the 4-hour chart. A hold above this level could pave the way for further upside, potentially targeting resistance at $110.77 and beyond. Failure to maintain this support, however, could trigger a correction towards $109.39 and $108.01. The market's sensitivity to geopolitical news means that any escalation could quickly invalidate consolidation patterns and push prices higher, while de-escalation could lead to a sharp unwinding of the risk premium.
Frequently Asked Questions: BRENT Analysis
What happens if BRENT Crude breaks above the $110.77 resistance level?
A sustained break above $110.77, especially on increased volume and positive geopolitical news, could signal a continuation of the rally towards the $111.91 daily resistance target and potentially higher.
Should I consider buying BRENT at current levels around $110.64 given the RSI at 79.21?
Buying at current levels carries risk due to overbought conditions on shorter timeframes. A pullback to support around $110.09 or $108.01 might offer a better risk-reward entry if it holds.
Is the RSI at 79.21 a definitive sell signal for BRENT Crude right now?
An RSI of 79.21 on the 1-hour chart indicates overbought conditions, suggesting a potential for a short-term pullback or consolidation, but it does not guarantee a reversal against the strong daily trend.
How will escalating Middle East tensions affect BRENT Crude prices this week?
Continued escalation is likely to add further geopolitical risk premium to BRENT prices, potentially pushing them towards $111.91 or higher, as markets price in supply disruption fears.
Track markets in real-time
AI-powered analysis, technical indicators and real-time price data.
Join Our Telegram Channel
Breaking market news, AI analysis and trading signals instantly.
Join Channel