WTI Weekly: Bullish Run Continues Above $101.19 - Technical Outlook
WTI crude oil finished the week strongly, holding above $101.19. Analysis of key technical indicators and levels suggests potential for further upside, but risks remain.
The past week has been a testament to the resilience and upward momentum in WTI crude oil, closing firmly above the critical $101.19 mark. This bullish surge, driven by a confluence of geopolitical tensions and tightening supply expectations, has captured the attention of traders and analysts alike. As we transition into a new trading week, the technical landscape presents a compelling picture, with indicators suggesting a continuation of the upward trend, albeit with nascent signs of caution emerging. Understanding the nuances of WTI's price action, key support and resistance levels, and the underlying market sentiment is paramount for navigating the potential opportunities and risks ahead. This analysis delves into the intricate details of WTI's recent performance, offering a comprehensive outlook for the coming days.
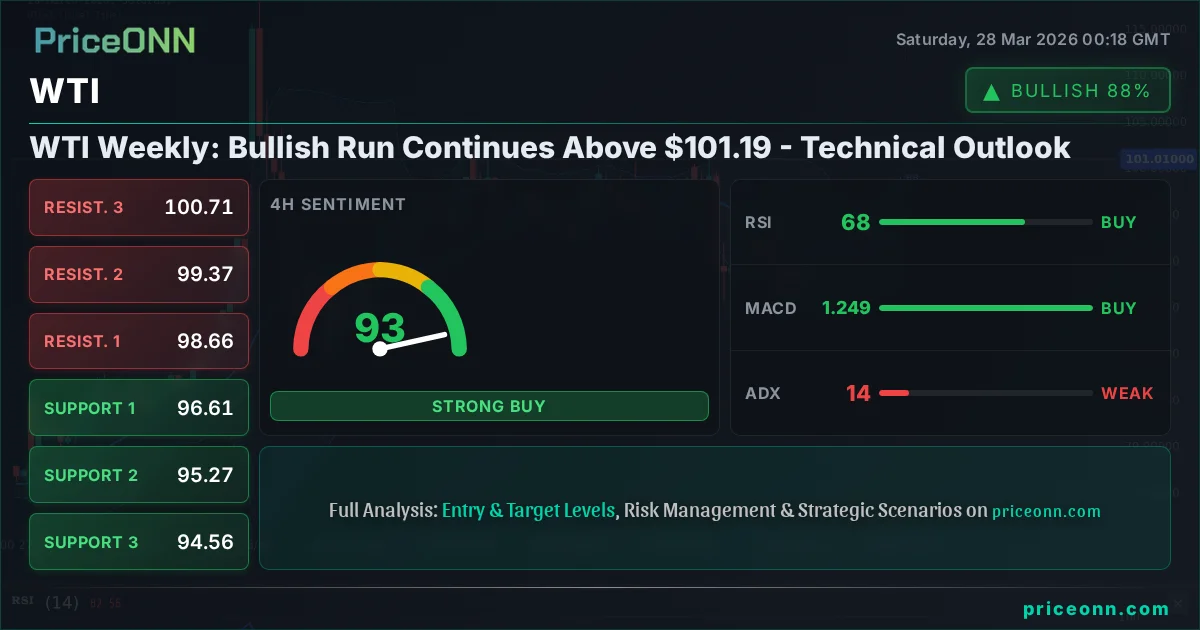
- WTI crude oil finished the week trading at $101.19, marking a significant bullish close above key psychological levels.
- The daily chart shows a strong uptrend, supported by an ADX reading of 57.34, indicating robust directional momentum.
- Key resistance is identified at $110.77, while crucial support lies at $97.16, forming the boundaries for the next move.
- Geopolitical factors, particularly Middle East tensions and supply concerns, continue to heavily influence WTI's price correlation with broader market sentiment.
Navigating the Bullish Momentum: WTI's Ascent Past $101.19
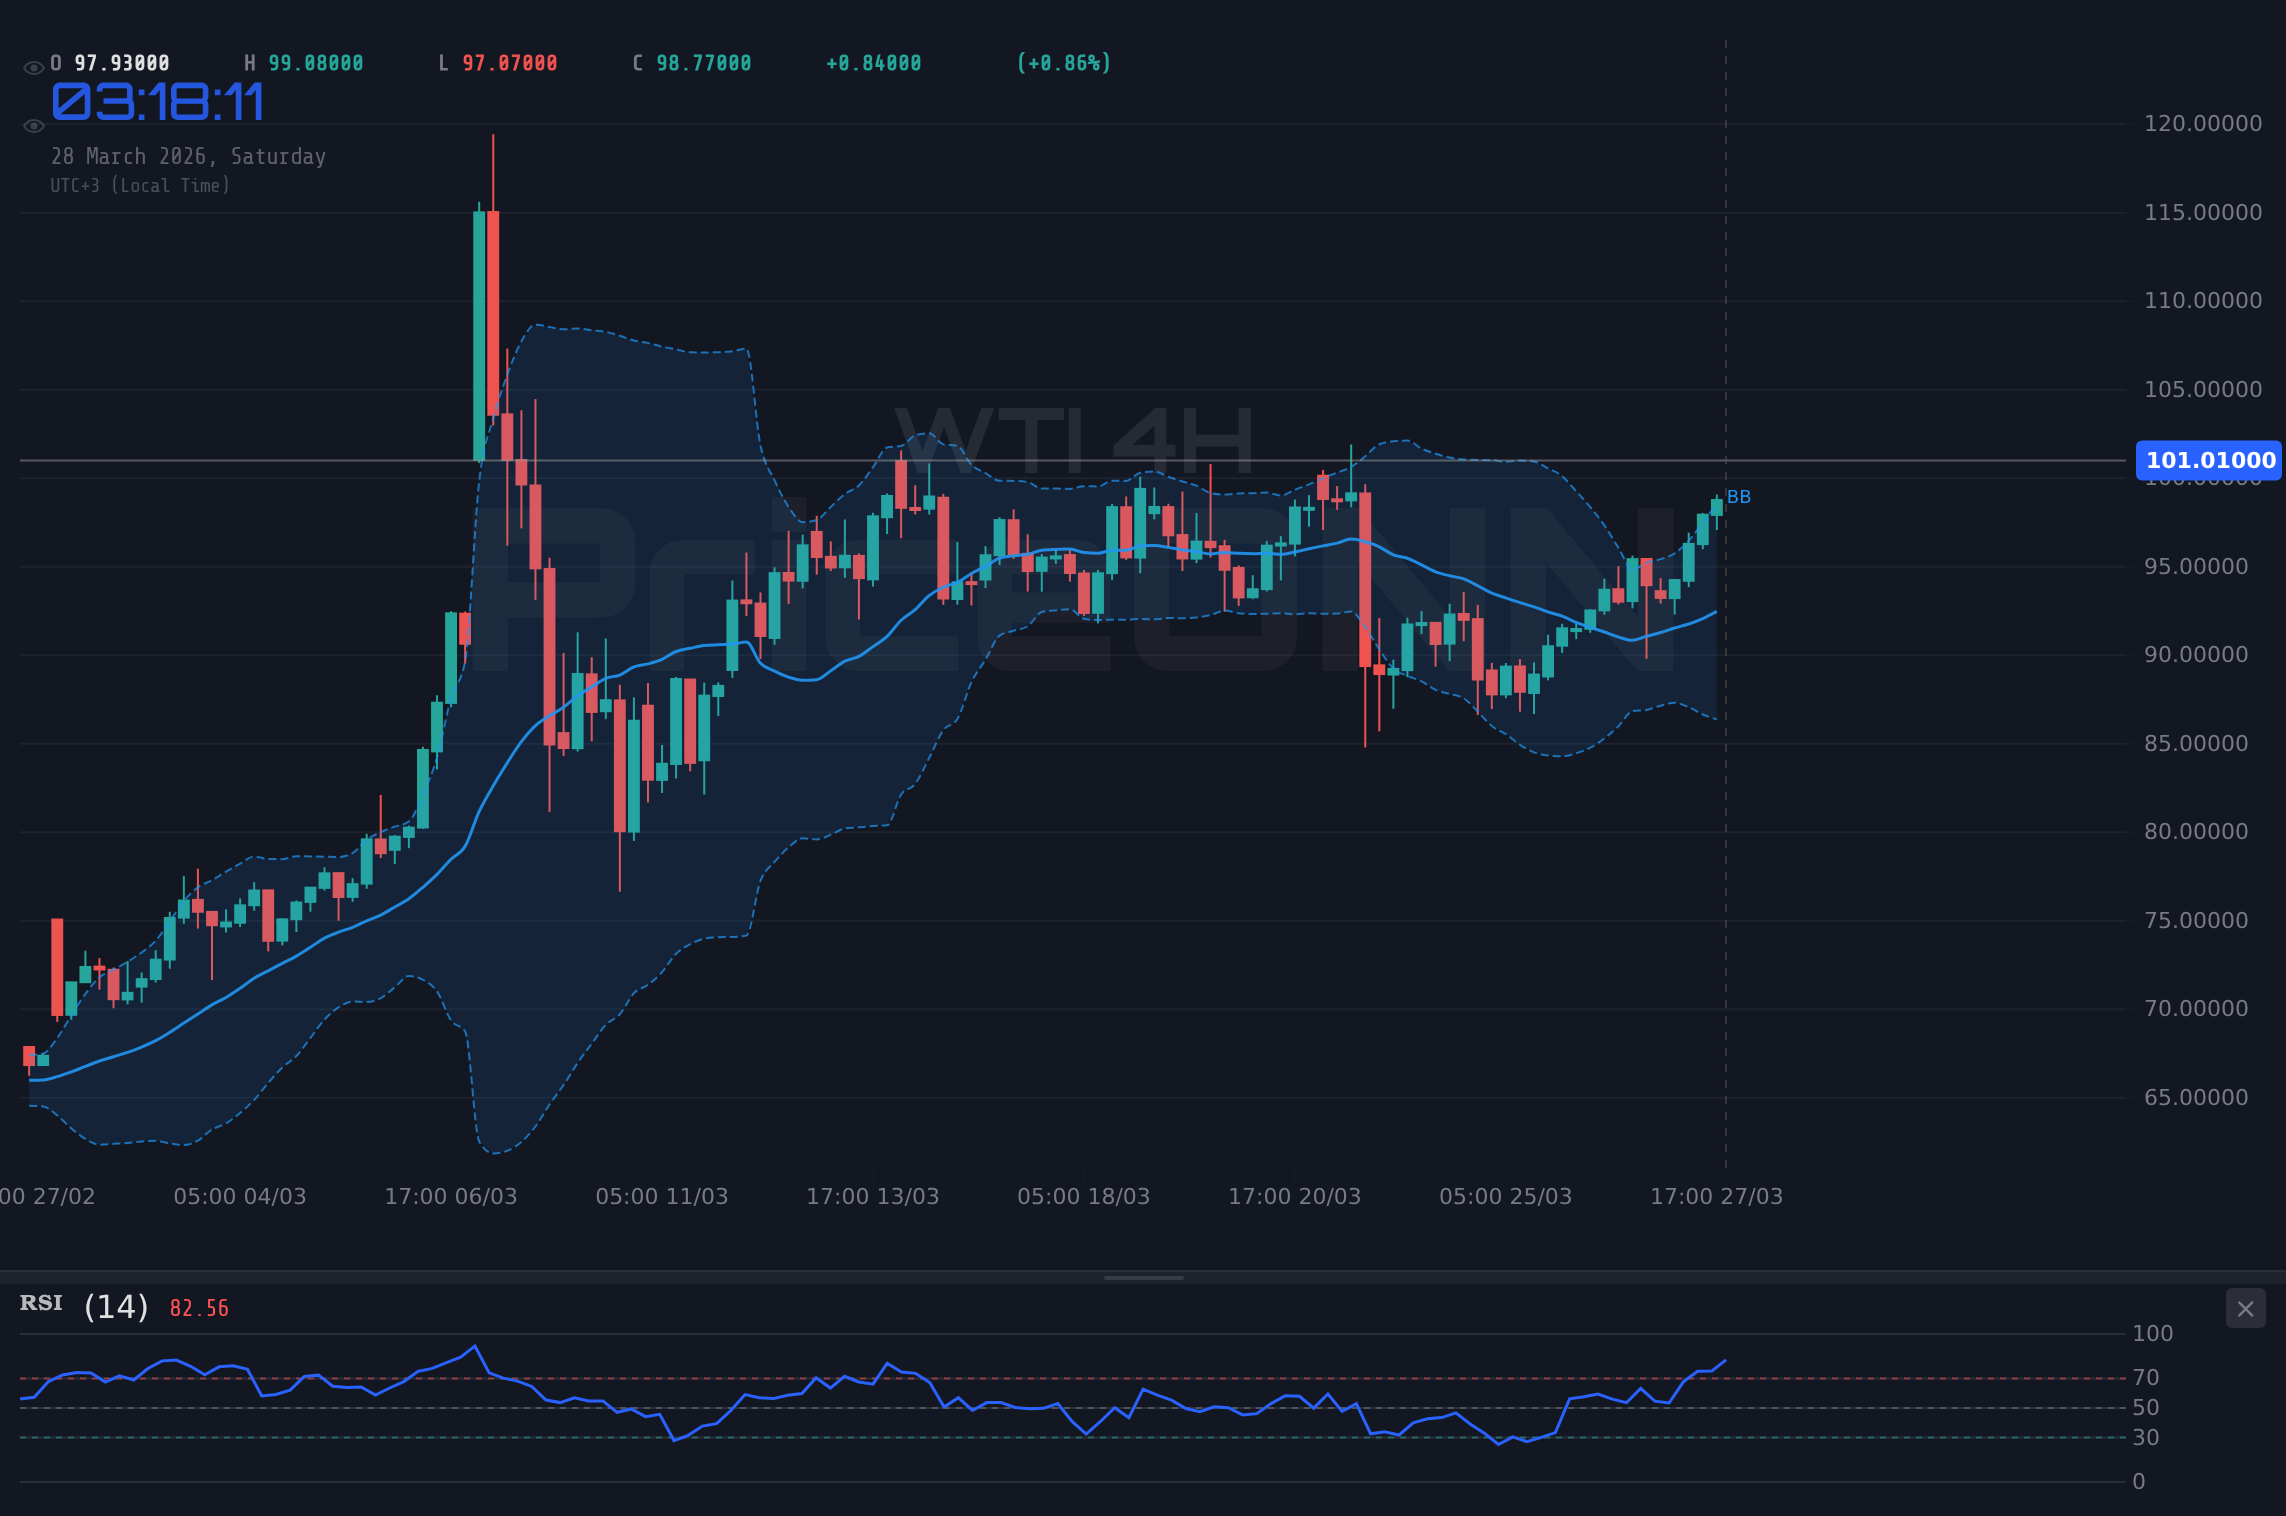
The narrative surrounding WTI crude oil this past week has been overwhelmingly bullish, culminating in a strong close just north of $101.19. This level, which has served as a significant psychological and technical barrier, has now been decisively breached, signaling a potential continuation of the upward trajectory. The daily chart paints a picture of robust strength, with the Average Directional Index (ADX) standing at an impressive 57.34. This reading is not merely a number; it signifies a powerful and committed trend, suggesting that the current move has substantial legs. For traders, this ADX value implies that the market is not experiencing a mere fluctuation but a sustained directional push, making it crucial to align strategies with this prevailing trend. The sheer force indicated by such a high ADX reading suggests that any counter-trend moves might be short-lived corrections rather than reversals, at least until broader market conditions or fundamental catalysts shift dramatically. The price action itself, with WTI carving out higher highs and higher lows throughout the week, reinforces this interpretation of a healthy, ongoing uptrend.
Further bolstering the bullish case is the confluence of technical signals across various timeframes. On the 1-hour chart, despite the overall trend's strength, the ADX at 29.58 indicates a strong, albeit more granular, uptrend. This suggests that even within shorter trading sessions, the directional bias remains to the upside. The Relative Strength Index (RSI) at 80.96 on the same timeframe, while signaling overbought conditions, often tends to stay elevated in strong trending markets. This is not a bearish divergence in itself but rather a confirmation of strong buying pressure. Similarly, the Stochastic Oscillator, with %K at 89.82 and %D at 92.83, hovers in overbought territory, hinting at a potential for a short-term pullback or consolidation. However, in the context of the dominant daily uptrend, these shorter-term overbought signals are more likely to lead to temporary pauses rather than significant reversals. The Bollinger Bands on the 1-hour chart are also trading above the middle band, indicating bullish sentiment, and the MACD is showing positive momentum, further aligning with the prevailing upward bias. It's this multi-timeframe alignment, particularly the dominance of the daily trend, that provides a strong foundation for a bullish outlook.
The Significance of $101.19 and Key Levels to Watch
The $101.19 level is more than just a price point; it represents a critical psychological and technical juncture that WTI has now overcome. Historically, breaking such significant levels often attracts further buying interest as traders and algorithms react to the shift in market structure. Looking at the immediate technical landscape, the data provides clear delineations for potential price action. On the 4-hour chart, which often bridges the gap between intraday fluctuations and the daily trend, we see a strong uptrend confirmed by an ADX of 14.38, suggesting a somewhat less aggressive but still present upward move. However, the daily timeframe is where the true conviction lies, with an ADX of 57.34 painting a picture of a very strong trend. This dominance of the daily trend cannot be overstated. It suggests that while shorter timeframes might exhibit pullbacks, the overarching market sentiment is strongly in favor of higher prices.
Crucially, the provided data outlines specific support and resistance levels that will dictate the short-to-medium term direction. On the downside, the first significant support is identified at $97.16. A decisive break below this level would challenge the prevailing bullish narrative and could signal a deeper correction. Further down, $94.56 and $92.30 serve as subsequent support zones, areas where buyers might step in more aggressively if the price were to decline substantially. Conversely, on the upside, resistance levels are key indicators of where the rally might face headwinds. The immediate resistance is noted at $106.34, followed by more significant hurdles at $109.05 and $110.77. These resistance points are not arbitrary; they often represent areas where profit-taking might occur or where selling pressure could intensify. The battle between these support and resistance levels will define the trading range and potential breakout scenarios in the coming days and weeks. The ability of WTI to hold above $101.19 and push towards these resistance levels will be closely watched.
Geopolitical Undercurrents and Inflationary Pressures
The robust performance of WTI crude oil cannot be divorced from the prevailing geopolitical landscape and its implications for inflation. The Middle East remains a focal point, with ongoing tensions acting as a persistent background risk premium for oil prices. News reports from the past week, such as those highlighting Japan's contemplation of coal revival amidst soaring LNG prices and India's fuel tax cuts amid an oil crisis, underscore the global impact of energy market volatility. While these specific events might not directly involve WTI, they paint a broader picture of supply chain sensitivities and the strategic importance of energy security. The fact that crude oil prices have surged past $100 a barrel, as noted in market commentary, is a direct consequence of these geopolitical escalations and the underlying fear of supply disruptions. This fear premium is a powerful driver in commodity markets, often overshadowing purely technical considerations in the short to medium term. Traders are constantly assessing the probability of further conflict escalation, which could undoubtedly send WTI prices higher, and conversely, any signs of de-escalation could trigger sharp profit-taking.
Furthermore, the correlation between oil prices and inflation expectations remains a critical factor for central banks and market participants. High oil prices directly contribute to inflation by increasing transportation and energy costs across the board. This can create a challenging environment for policymakers, who are tasked with balancing economic growth with price stability. If inflation remains persistently high, partly due to elevated energy costs, central banks might be forced to adopt more hawkish monetary policies. This, in turn, could strengthen the US Dollar (DXY), which is currently showing a strong upward trend with a daily reading of 61.71. A stronger dollar typically puts downward pressure on dollar-denominated commodities like WTI. However, the current market dynamic appears to be a tug-of-war: geopolitical risks are pushing oil prices higher, while the prospect of tighter monetary policy and a stronger dollar are acting as a potential brake. The interplay between these forces will be crucial in determining WTI's path. The current ADX of 57.34 on the daily chart suggests that the bullish trend in WTI is currently overriding the potential headwinds from a strengthening dollar and inflation concerns, but this balance is delicate.
The recent price action in other energy markets also provides context. Brent crude, trading around $110.64, has seen a significant daily jump of 6.77%, mirroring WTI's upward move. This broad-based strength in the energy sector underscores the widespread impact of supply-side concerns. The fact that both WTI and Brent are exhibiting strong bullish trends, with daily ADX readings of 57.34 and 62.64 respectively, suggests a systemic factor driving the energy complex higher. This is not isolated to one type of crude but reflects a broader market sentiment driven by scarcity fears and geopolitical risk. The RSI readings on the daily charts for both WTI (67.27) and Brent (69.37) show strong upward momentum but are not yet in extreme overbought territory, suggesting room for further price appreciation before a significant correction might be warranted. However, the shorter-term RSI readings on the 1-hour charts (80.96 for WTI, 79.21 for Brent) are indeed in overbought territory, hinting at potential for short-term consolidation or pullbacks as traders assess the next moves.
Technical Indicators: Decoding the Signals
Delving deeper into the technical indicators, we find a predominantly bullish picture, especially when viewed through the lens of the daily timeframe. The ADX, as repeatedly mentioned, is the star player here, with a daily reading of 57.34 signifying a powerful trend. This is not a market for the faint-hearted or those looking for quick reversals; it's a trend-following environment. On the 1-hour chart, the ADX at 29.58 confirms this directional strength, while the RSI at 80.96 and Stochastic hovering in overbought zones (K=89.82, D=92.83) suggest that the market might be getting slightly extended in the short term. This doesn't negate the trend but indicates that a pause or minor pullback is plausible before the uptrend resumes. Traders often look for such brief consolidations to enter positions on the side of the prevailing trend, rather than chasing the price higher into overextended territory.
The MACD indicator offers further confirmation. On the daily chart, the MACD histogram is currently negative, but the MACD line is above the signal line, indicating that while momentum has been building, it's still in a phase of upward acceleration. On the 1-hour chart, the MACD is clearly positive, with the MACD line above the signal line and the histogram in positive territory, reinforcing the short-term bullish bias. The Bollinger Bands on the daily chart are positioned above the middle band, suggesting that the price is trading in the upper half of its recent range, consistent with an uptrend. On the 1-hour chart, the bands are also above the middle band, indicating bullish sentiment. However, the price is trading near the upper band, which, combined with the high RSI and Stochastic readings, warrants attention for potential short-term consolidation. The Stochastic oscillator's readings on the 1-hour chart (K=89.82, D=92.83) are particularly noteworthy, suggesting that this timeframe may be ripe for a temporary pullback as the oscillator cools off from extreme levels.
It's essential to interpret these indicators in concert. The daily trend strength (ADX 57.34) is the most dominant signal. While shorter-term indicators like the 1-hour RSI (80.96) and Stochastic (K=89.82, D=92.83) are flashing overbought warnings, they are occurring within the context of a powerful, established trend. This often means that instead of immediate reversals, we might see consolidation periods where the price drifts sideways or experiences shallow pullbacks before the main trend resumes. A trader looking to enter on the long side might wait for such a consolidation to complete and for the shorter-term indicators to reset slightly, offering a more favorable risk-reward entry point. The overall signal across timeframes, weighted by the strength of the daily trend, remains bullish, but tactical patience might be rewarded for entry timing.
| Indicator | Value | Signal | Interpretation |
|---|---|---|---|
| RSI (14) | 80.96 (1H) | Overbought | Short-term exhaustion possible, but trend strength is key. |
| MACD Histogram | Positive (1H) | Bullish Momentum | Continues to support upward price action. |
| Stochastic | K=89.82, D=92.83 (1H) | Overbought | Suggests potential for short-term pullback or consolidation. |
| ADX | 57.34 (1D) | Strong Trend | Confirms a powerful and sustained directional move. |
| Bollinger Bands | Above Middle Band (1H) | Bullish | Price action is in the upper half, indicating bullish sentiment. |
Correlations and Broader Market Context
Understanding WTI's performance requires looking beyond its own price action and considering its correlations with other major markets. The US Dollar Index (DXY) is a primary influence. With the DXY exhibiting a strong upward trend on the daily chart (ADX 31.98, RSI 61.71), and currently trading around 99.91, it typically exerts downward pressure on commodities like WTI. However, the current market environment appears to be one where geopolitical risk and supply concerns are temporarily overriding the dollar's strength. This is a critical observation: normally, a rising dollar would be a significant headwind for oil. The fact that WTI is advancing strongly despite this suggests the underlying bullish drivers for oil are exceptionally powerful. The narrative is currently one of 'risk-on' for oil driven by supply fears, even as the dollar strengthens, potentially signaling 'risk-off' in other asset classes. This divergence is something to monitor closely.
The performance of equity indices like the S&P 500 and Nasdaq adds another layer to this complex picture. Both indices have seen significant declines this week, with the S&P 500 trading around 6357.55 and Nasdaq at 23092.5, both showing substantial daily drops. This indicates a broader 'risk-off' sentiment in the equity markets. Typically, a decline in equities, driven by fear and a move away from riskier assets, would correlate with a fall in oil prices as demand expectations dim. However, the current situation sees oil prices soaring while equities are plummeting. This unusual correlation suggests that the specific supply-side risks in the energy market are currently the dominant factor, creating a 'flight to safety' within commodities themselves, particularly oil, rather than a broad-based selloff across all risk assets. This decoupling is a key market dynamic to understand; it implies that the drivers for oil are more potent than the general risk aversion seen in equities. The strong upward trend in WTI (ADX 57.34) is actively defying the broader risk-off sentiment visible in stock markets.
The energy complex itself is showing remarkable strength. Brent crude, trading near $110.64, has also experienced a significant surge, reinforcing the bullish sentiment across the oil market. This synchronized movement between WTI and Brent suggests that the underlying factors impacting crude oil supply and demand are systemic and widespread. The daily ADX readings for both benchmarks are indicative of strong trends, highlighting that this is not an isolated phenomenon but a sector-wide move. The RSI levels on the daily charts, while elevated, still show room for further upside before reaching extreme overbought territory, supporting the idea that the rally could continue. However, the shorter-term indicators on the 1-hour charts for both benchmarks are showing overbought conditions. This suggests that while the overall trend remains bullish, short-term traders might anticipate some consolidation or minor pullbacks before the next leg higher. The market is essentially pricing in supply risks with significant force, pushing oil prices higher even as other risk assets face selling pressure.
WTI's current bullish surge is occurring despite a strengthening US Dollar (DXY at 99.91) and a significant sell-off in equity markets (S&P 500 at 6357.55). This divergence highlights the overriding influence of geopolitical supply risks in the energy sector, creating a unique 'risk-on' environment for oil amidst broader 'risk-off' sentiment.
Trading Scenarios and Probabilities
Given the strong bullish trend confirmed by daily technicals, but with short-term overbought signals and conflicting broader market signals, several scenarios warrant consideration. The probabilities assigned reflect the current technical picture, the strength of the daily trend, and the potential impact of short-term indicator readings. The dominant daily trend suggests a higher probability for bullish outcomes, but the short-term overbought conditions and broader market risk aversion temper this slightly, making the neutral scenario a significant consideration for consolidation.
Bearish Reversal Scenario: Profit-Taking and Trend Failure
15% ProbabilityConsolidation Scenario: Choppy Action Above $101.19
40% ProbabilityBullish Continuation Scenario: Trend Resumes
45% ProbabilityThe bullish scenario, while carrying the highest probability at 45%, is contingent on WTI holding its ground above the $101.19 level and potentially consolidating briefly to digest recent gains. This consolidation phase would allow shorter-term indicators to reset, potentially offering a more attractive entry point before the trend reasserts itself. The key here is the hold of $101.19 as new support. If this level is defended, the path of least resistance would likely lead towards the first resistance at $106.34, and potentially higher towards $109.05. The invalidation for this bullish thesis remains the break and hold below the more significant support at $97.16, which would signal a more substantial trend change.
The neutral scenario, with a 40% probability, acknowledges the possibility of choppier price action in the near term. Given the short-term overbought signals on the 1-hour chart and the conflicting broader market sentiment, a period of consolidation between $101.19 and $106.34 is quite plausible. In this range-bound environment, traders might look for opportunities to buy near the lower end of the range and sell near the upper end, assuming the overall trend remains intact. The breakout from this range, either upwards or downwards, would then dictate the next significant move. The trigger for this scenario is simply the continuation of price action within these boundaries, while invalidation would occur on a clear break outside of them.
The bearish scenario, while carrying the lowest probability at 15%, cannot be entirely dismissed, especially if geopolitical tensions ease unexpectedly or if broader market risk aversion intensifies dramatically. A decisive close below the $97.16 support level would be the primary trigger for this scenario. This would suggest that the bullish trend has failed and that a deeper correction is underway, potentially targeting $94.56 and even $92.30. While current indicators do not strongly support this outcome, a significant shift in news flow or a major macroeconomic event could catalyze such a move. It serves as a crucial reminder of the inherent risks in any market and the importance of risk management, even in strong trends.
Looking Ahead: Key Events and Potential Catalysts
As we look towards the upcoming week, several factors will be critical in shaping the price of WTI crude oil. The ongoing geopolitical situation in the Middle East remains the most significant wildcard. Any escalation or de-escalation in regional tensions could lead to sharp price movements. Traders will be closely monitoring news headlines for developments that could impact oil supply routes or production levels. The market's reaction to these headlines will likely be swift and pronounced, potentially overriding technical signals in the short term.
From a macroeconomic perspective, the focus will remain on inflation data and central bank policy expectations. Given the current high oil prices, persistent inflation remains a concern for central banks like the Federal Reserve. Upcoming economic data releases, particularly those related to inflation and employment (though none are marked as high-impact for the immediate weekend/next few days from the provided calendar), will be scrutinized for clues about future monetary policy. If inflation data continues to surprise to the upside, it could lead to expectations of tighter monetary policy, potentially strengthening the US Dollar and acting as a headwind for oil prices. Conversely, signs of cooling inflation might allow central banks to adopt a more dovish stance, which could weaken the dollar and provide further support for WTI. The correlation between WTI and the DXY will be particularly important to watch in this context.
Technical levels will continue to play a crucial role. The ability of WTI to hold above the $101.19 level as new support will be key. A sustained hold above this price point would reinforce the bullish outlook and pave the way for testing resistance levels at $106.34 and beyond. Conversely, a failure to hold $101.19, followed by a breach of the stronger support at $97.16, would signal a significant shift in momentum and potentially the end of the current uptrend. The interplay between fundamental catalysts and technical price action will ultimately determine WTI's direction in the coming week.
Frequently Asked Questions: WTI Analysis
What happens if WTI breaks below $97.16 support?
A decisive break below the $97.16 support level would invalidate the current bullish trend and likely trigger a bearish scenario. This could lead to a rapid sell-off targeting $94.56, and potentially further down to $92.30 as market sentiment shifts significantly.
Should I consider buying WTI at current levels near $101.19 given the overbought RSI?
While the daily trend is strongly bullish, the 1-hour RSI at 80.96 and Stochastic in overbought territory suggest caution for immediate entries. A patient approach might involve waiting for a brief consolidation or pullback to offer a better risk-reward entry, ideally holding above $101.19.
Is the daily ADX of 57.34 a reliable signal for a continued WTI uptrend?
Yes, an ADX reading of 57.34 on the daily chart is exceptionally strong and indicates a powerful, committed trend. While short-term indicators may show overbought conditions, this high ADX value suggests the trend has significant momentum and is likely to continue unless major catalysts emerge.
How will the geopolitical situation in the Middle East affect WTI prices this week?
Geopolitical tensions in the Middle East are currently the primary driver of WTI's bullish momentum, adding a risk premium to prices. Any escalation could push WTI significantly higher, while signs of de-escalation might trigger sharp profit-taking, creating volatility.
Track markets in real-time
AI-powered analysis, technical indicators and real-time price data.
Join Our Telegram Channel
Breaking market news, AI analysis and trading signals instantly.
Join Channel