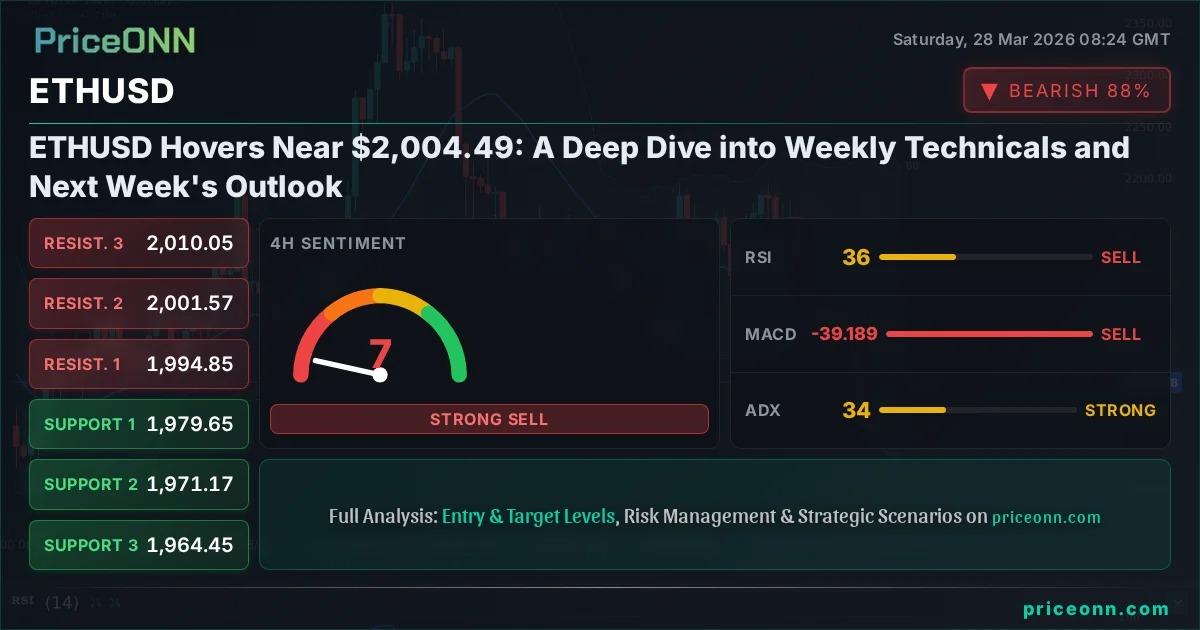
ETHUSD Hovers Near $2,004.49: A Deep Dive into Weekly Technicals and Next Week's Outlook
ETHUSD trading around $2,004.49 as traders eye key levels. Explore technicals, scenarios, and what to watch next week.
The cryptocurrency market, particularly Ethereum (ETHUSD), has been in a state of cautious consolidation, with ETHUSD currently trading around the $2,004.49 mark. This price point sits precariously between significant technical levels, reflecting a market that is neither fully bullish nor bearish but rather in a holding pattern. The past week has been characterized by indecision, with price action oscillating within a defined range, leaving traders and investors alike scrutinizing charts for clues about the next significant move. The current stalemate suggests that market participants are awaiting a catalyst, whether it be a macroeconomic shift, a regulatory development, or a technical breakout, to dictate the next directional impulse. Understanding the nuances of these technical indicators and the broader market correlations is crucial for navigating this period of uncertainty.
- ETHUSD is currently trading around $2,004.49, reflecting a neutral market sentiment.
- Critical support for ETHUSD is observed at $1,979.65 on the 4H chart, while resistance looms at $2,010.05.
- The RSI at 49.34 on the 1H chart indicates a neutral momentum, with a slight downward eğilim.
- The ADX at 29.84 suggests a strong trend is present, but the conflicting signals across timeframes point to potential chop.
- Correlation analysis shows ETHUSD's sensitivity to DXY movements and broader risk sentiment in equity markets.
Navigating the Choppy Waters: ETHUSD Around $2,004.49
The past week has presented a rather subdued picture for Ethereum (ETHUSD), with the digital asset largely trading sideways around the $2,004.49 level. This period of consolidation, while perhaps frustrating for those seeking rapid gains, is a critical phase for market analysis. It allows us to examine the underlying technical structures without the noise of extreme volatility. On the 1-hour timeframe, ETHUSD shows a neutral trend with a power of 50%, supported by an RSI of 44.27. This reading suggests that momentum is neither strongly bullish nor bearish, hovering in a zone that could precede a significant directional shift. However, the MACD on this timeframe is showing positive momentum, and Stochastic indicators are flashing a bullish signal (%K above %D), creating a mixed technical landscape. This internal conflict within the 1-hour indicators highlights the indecision plaguing the immediate price action.
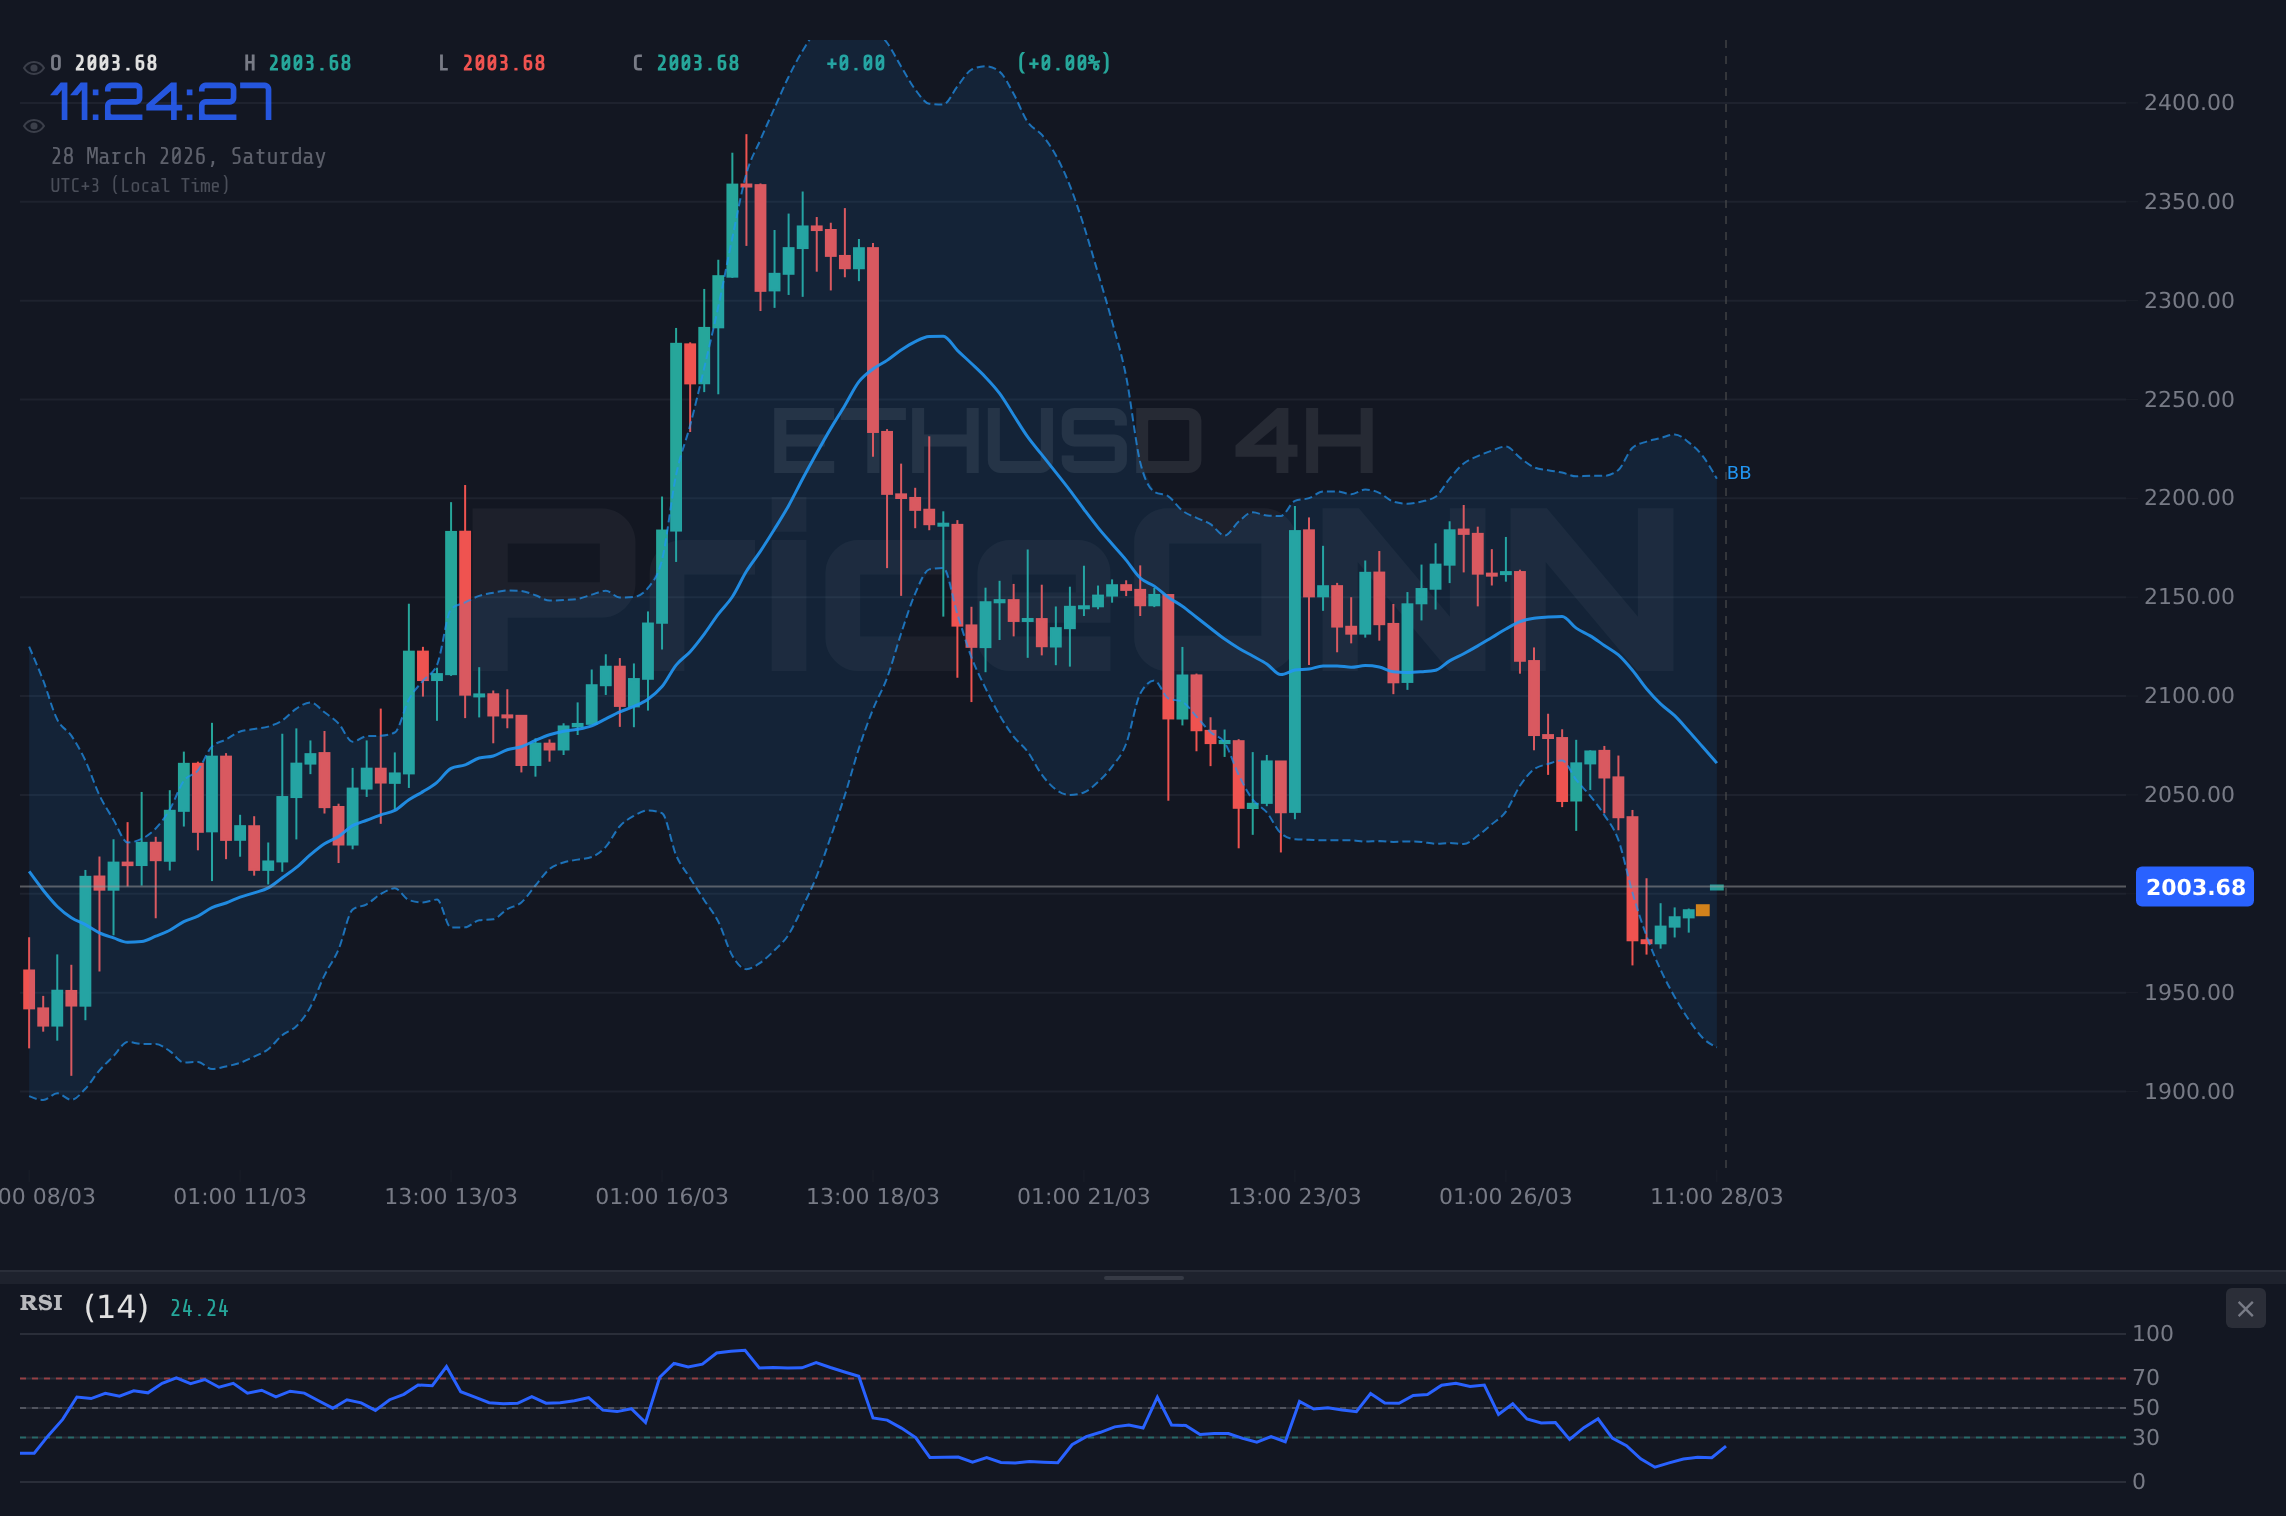
Diving deeper into the 4-hour chart, the trend shifts to a more defined bearish posture, with a power of 87%. Here, the RSI sits at 36.06, indicating a move towards oversold territory, which could suggest a potential bounce is on the horizon. The MACD, however, remains in negative territory, printing below its signal line, which reinforces the bearish momentum on this timeframe. Bollinger Bands on the 4-hour chart are also positioned below the middle band, further supporting the bearish inclination. Yet, the Stochastic oscillator here is showing a bullish signal with %K crossing above %D, adding another layer of contradiction. The ADX reading of 34.28 on the 4H chart is particularly noteworthy, signifying a strong trend is in play. The conflict between the direction suggested by the ADX and the mixed signals from RSI, MACD, and Stochastic across different timeframes is the crux of the current trading dilemma for ETHUSD.
The daily timeframe paints yet another picture, leaning towards a neutral stance with 50% trend power. The RSI at 43.79 suggests a downward eğilim, but it is far from oversold conditions, leaving room for further downside. MACD momentum is negative, and the histogram is below the signal line, aligning with a bearish outlook. Bollinger Bands are also below the middle band, indicating bearish pressure. However, the Stochastic oscillator is showing a bearish signal (%K below %D), and the ADX is at a relatively weak 17.68, suggesting a lack of a strong trend. This divergence across timeframes - bullish signals on the 1H, bearish on the 4H, and neutral/weakening on the daily - creates a complex trading environment. For scalpers, the 1H chart might offer short-term opportunities, while swing traders and long-term investors must contend with the conflicting signals and the potential for whipsaws. The overarching narrative is one of a market at a crossroads, waiting for a definitive catalyst.
Correlation Analysis: The Dollar's Shadow and Equity Market Tremors
In today's interconnected financial markets, understanding the correlation between different asset classes is paramount, especially for a volatile asset like ETHUSD. The US Dollar Index (DXY), currently trading around 99.91, acts as a significant barometer for risk appetite and, consequently, for cryptocurrencies. A strengthening DXY, as seen with its recent upward move, typically exerts downward pressure on risk assets, including Ethereum. When the dollar gains strength, it often implies a 'risk-off' sentiment in the market, where investors flock to perceived safe-haven assets, pulling capital away from more speculative investments like crypto. The DXY’s current position near the 100 level is a psychological and technical barrier, and its movement from here will be closely watched.
The performance of major equity indices, such as the S&P 500 (SP500) and the Nasdaq 100 (Nasdaq), also provides crucial context. With the SP500 currently at 6357.55 and the Nasdaq at 23092.5, both showing significant daily declines, it's clear that risk aversion is a dominant theme. These indices have experienced sharp pullbacks, indicating a broader market sell-off. Historically, when major equity indices experience sharp drops, capital tends to flow out of riskier assets like cryptocurrencies. ETHUSD, despite its potential for decoupling, often follows the broader risk sentiment reflected in these indices. The sharp negative change in both indices suggests that any upward move in ETHUSD might face significant headwinds unless there's a reversal in the broader market sentiment. This inverse correlation between risk assets and the dollar index, coupled with the general equity market downturn, creates a challenging environment for ETHUSD.
Furthermore, the price of oil, with Brent crude trading at $110.64 and WTI at $101.19, serves as an indicator of inflation expectations and geopolitical tensions. The significant daily gains in both oil benchmarks signal rising inflationary pressures and potential supply disruptions. Elevated oil prices can indirectly impact ETHUSD in several ways. Firstly, they can fuel inflation concerns, which might lead central banks to adopt more hawkish monetary policies, potentially strengthening the dollar and pressuring risk assets. Secondly, higher energy costs can dampen consumer spending and business investment, leading to slower economic growth, which is generally negative for speculative assets. The current surge in oil prices adds another layer of complexity, suggesting that the market is pricing in geopolitical risks and inflationary pressures, which could further dampen risk appetite and indirectly weigh on ETHUSD.
The Technical Crossroads: Deconstructing ETHUSD's Indicator Ensemble
Delving into the specific technical indicators for ETHUSD reveals a complex and often contradictory picture, underscoring the current market indecision. On the 1-hour chart, the Relative Strength Index (RSI) is positioned at 44.27. This reading is firmly in neutral territory, suggesting neither an overbought nor oversold condition. However, the downward eğilim in the RSI from higher levels indicates that bearish momentum is subtly building in the short term. Complementing this, the MACD is exhibiting positive momentum, with the MACD line above the signal line, which typically signals an upward bias. Yet, the Stochastic oscillator presents a conflicting view, with the %K line at 80.26 and the %D line at 68.39, indicating an overbought condition and a potential for a downturn. This divergence between the MACD and Stochastic on the 1H chart is a classic sign of a market struggling to establish a clear direction.
Moving to the 4-hour timeframe, the technical signals become more bearish. The RSI stands at 36.06, moving closer to oversold territory. While this could signal a potential buying opportunity for short-term traders anticipating a bounce, it also confirms the prevailing downward pressure. The MACD histogram is negative, and the MACD line is below the signal line, reinforcing the bearish sentiment. The Bollinger Bands are hugging the lower band, suggesting that price action is experiencing significant downside pressure. However, the Stochastic oscillator here shows a bullish divergence, with %K at 23.83 and %D at 13.29, crossing upwards. This creates a significant conflict: the MACD and Bollinger Bands point to further weakness, while the Stochastic hints at a potential reversal. This is precisely the kind of scenario where traders must exercise caution and wait for confirmation, as false signals can lead to significant losses.
On the daily chart, the ETHUSD presents a picture of weak trend strength with an ADX reading of just 17.68. This low ADX value indicates a lack of a strong directional trend, suggesting that the price action might be consolidating or moving sideways. The RSI is at 43.79, continuing the theme of neutral to slightly bearish momentum. The MACD remains negative, with the histogram below the signal line, reinforcing the longer-term bearish bias. The Bollinger Bands are situated below the middle band, indicating that the price is trading in the lower half of its recent range. The Stochastic oscillator confirms a bearish signal, with %K at 12.88 and %D at 24.75, suggesting that the market is moving towards oversold conditions. The conflicting signals across these timeframes - bullish short-term MACD and Stochastic on 1H, bearish MACD and Bollinger on 4H, and a weak trend on the daily - make it difficult to establish a high-conviction trade setup. For scalpers, the 1H chart's conflicting signals might offer fleeting opportunities, but the risk of whipsaws is substantial. Swing traders and long-term investors will likely need to see a clearer picture emerge, perhaps with a decisive break above resistance or a confirmed test of key support levels.
Historical Context: Lessons from Past Consolidations
Examining historical price action for Ethereum, particularly during periods of consolidation around significant psychological levels like $2,000, offers valuable insights. We've seen similar patterns emerge in late 2024 and early 2025, where ETHUSD spent considerable time trading within narrow ranges. For instance, after a sharp rally in Q4 2024, ETHUSD entered a multi-week consolidation phase between $1,800 and $2,100. During that period, technical indicators often flashed conflicting signals, much like we observe today. RSI readings would hover around the 50 level, MACD would show brief bullish or bearish crossovers that quickly reversed, and Stochastic oscillators would frequently oscillate between overbought and oversold zones without leading to sustained moves. The ADX typically remained subdued, confirming the lack of a strong trend.
What often preceded the eventual breakout from these consolidation phases was a period of extreme indicator divergence or a significant macroeconomic event. For example, in early 2025, a confluence of dovish Fed commentary and a sudden surge in institutional inflows led to a decisive break above the $2,100 resistance, propelling ETHUSD towards higher levels. Conversely, a hawkish pivot from the Fed or a significant regulatory crackdown could trigger a breakdown below support levels, often accompanied by a sharp increase in volume and a surge in the ADX, indicating the start of a new, strong trend. The key lesson from these historical patterns is that consolidation phases are often periods of building energy. The longer the range, the more explosive the subsequent move tends to be. Therefore, while the current price action around $2,004.49 might seem stagnant, it is a crucial period for preparation, waiting for the market to reveal its next intended direction.
The Trader's Compass: Strategies for Every Market Participant
Navigating ETHUSD's current choppy market requires a tailored approach depending on your trading style and time horizon. For **scalpers**, the 1-hour chart's conflicting signals present opportunities, albeit with heightened risk. A scalper might look for quick entries based on Stochastic crossovers near the extremes, targeting small, rapid gains before the trend potentially reverses. For example, a Stochastic %K crossing above %D near the $1,976 support could be a trigger for a short-term long scalp, aiming for the $2,005 resistance. However, the low ADX on this timeframe means these moves can be easily reversed, necessitating tight stop-losses just below the entry point.
For **swing traders**, the 4-hour timeframe offers a slightly clearer, though still challenging, perspective. The bearish bias here, coupled with the oversold Stochastic signal, might entice some to look for a potential bounce. A swing trader might wait for confirmation, such as a break above the 4H middle Bollinger Band or a sustained move above the $2,005 resistance level, before considering a long position. The invalidation for such a trade would likely be a close back below the $1,979 support. Conversely, if the bearish momentum continues and price breaks below $1,979, swing traders might look to short ETHUSD, targeting the next support level at $1,964. The key here is patience and waiting for the price action to confirm the direction before committing significant capital.
For **long-term investors**, the current price action around $2,004.49 is less about short-term trading signals and more about strategic positioning. The daily chart's weak trend strength and the neutral RSI suggest that ETHUSD might be in a larger accumulation or distribution phase. Investors might view this period as an opportunity to gradually build positions if they believe in Ethereum's long-term fundamentals, dollar-cost averaging into the market. They would be less concerned with intraday fluctuations and more focused on the potential for ETHUSD to break out above the established resistance levels ($2,010 and beyond) or to hold key support zones ($1,979, $1,964) over the coming months. The ultimate goal for long-term investors is to acquire assets at favorable prices during periods of consolidation, anticipating future growth driven by network upgrades and broader adoption.
The Week Ahead: Key Catalysts and Levels to Monitor
Looking ahead, several factors could influence ETHUSD's price trajectory. Geopolitically, the ongoing tensions in the Middle East, which have driven gold and oil prices higher, continue to create an atmosphere of global uncertainty. This 'risk-off' sentiment generally weighs on cryptocurrencies, making any upward moves in ETHUSD more challenging. The strength of the US Dollar, currently hovering near the 100 mark on the DXY, remains a critical factor. A sustained rise in the DXY could further pressure ETHUSD, while any sign of dollar weakness might provide a tailwind. On the macroeconomic front, upcoming economic data releases, particularly those related to inflation and employment in the US, will be closely watched. Any data that deviates significantly from expectations could trigger volatility across markets, including crypto.
From a technical standpoint, the $2,004.49 level for ETHUSD is a critical pivot. The immediate resistance sits around the $2,005.45 mark on the 1-hour chart, followed by the more significant $2,010.05 level identified on the 4-hour chart. A decisive break and sustained hold above $2,010 would be a strong bullish signal, potentially opening the path towards the $2,020 and $2,050 levels. Conversely, support is currently being tested around $1,990.87 on the 1H chart. Below this, the key support zone lies between $1,979.65 and $1,964.45 on the 4H chart. A breakdown below this critical support cluster could signal a further decline, potentially targeting the $1,939 support level on the daily chart. Traders will be closely monitoring volume during any attempted breakouts or breakdowns, as confirmation through increased trading activity is essential.
The trading signals across different timeframes for ETHUSD remain mixed, making it imperative to wait for confirmation before entering positions. The 1-hour chart shows some bullish indicators, but these are contradicted by the more dominant bearish signals on the 4-hour and daily charts. The ADX readings suggest a strong trend is present, but its direction is unclear due to the conflicting signals. This suggests that the market is in a tug-of-war, and the next significant move will likely be driven by external factors or a clear technical breakout. For those looking to trade, focusing on risk management, using tight stop-losses, and waiting for high-probability setups - such as a confirmed break of a key level with supporting volume - will be crucial in navigating the current choppy conditions.
Bearish Scenario: The Downside Risk
65% ProbabilityNeutral Scenario: Range-Bound Trading
25% ProbabilityBullish Scenario: The Upside Breakout
10% ProbabilityFrequently Asked Questions: ETHUSD Analysis
What happens if ETHUSD breaks below the $1,979.65 support level?
A break below $1,979.65 on the 4-hour chart would invalidate the neutral outlook and likely trigger a move towards the next significant support at $1,964.45. This scenario gains probability if broader market risk aversion continues, pressuring ETHUSD further.
Should I buy ETHUSD at current levels around $2,004.49 given the mixed signals?
Buying at current levels carries significant risk due to conflicting technical signals across timeframes. A more prudent approach would be to wait for confirmation, such as a clear break above $2,010.05 or a confirmed bounce from the $1,979 support zone, ideally with increased volume.
Is the RSI at 44.27 a sell signal for ETHUSD right now?
An RSI of 44.27 on the 1-hour chart is not a direct sell signal; it indicates neutral momentum with a slight downward eğilim. While it doesn't signal strong buying pressure, it also doesn't confirm a bearish trend on its own, especially with conflicting MACD signals.
How will the ongoing Middle East tensions affect ETHUSD this week?
Escalating Middle East tensions contribute to global risk aversion, which generally pressures risk assets like ETHUSD. This could dampen any bullish sentiment and increase the likelihood of ETHUSD testing lower support levels if the geopolitical situation deteriorates further.
Technical Outlook Summary
| Indicator | Value | Signal | Interpretation |
|---|---|---|---|
| RSI (14) - 1H | 44.27 | Neutral | Suggests neutral momentum, slight downward eğilim. |
| MACD - 1H | Positive | Bullish Signal | MACD line above signal line, indicating positive momentum. |
| Stochastic - 1H | K:80.26, D:68.39 | Bearish Signal (Overbought) | %K above %D, but in overbought zone, signaling potential reversal. |
| ADX - 1H | 40.32 | Strong Trend (Down) | Indicates a strong downtrend is currently in play on the 1H chart. |
| RSI (14) - 4H | 36.06 | Oversold Tendency | Moving towards oversold territory, potential for bounce. |
| MACD - 4H | Negative | Bearish Signal | MACD line below signal line, reinforcing bearish momentum. |
| Stochastic - 4H | K:23.83, D:13.29 | Bullish Signal (Oversold) | %K above %D, crossing up from oversold zone. |
| ADX - 4H | 34.28 | Strong Trend (Up) | Indicates a strong uptrend is present, conflicting with other indicators. |
Key Levels
Track markets in real-time
AI-powered analysis, technical indicators and real-time price data.
Join Our Telegram Channel
Breaking market news, AI analysis and trading signals instantly.
Join Channel