SP500 Weekly Outlook: Bears Grip at $6,357.55 - What's Next?
SP500 faces intense bearish pressure at $6,357.55. Explore key levels, technical signals, and scenarios for the week ahead.
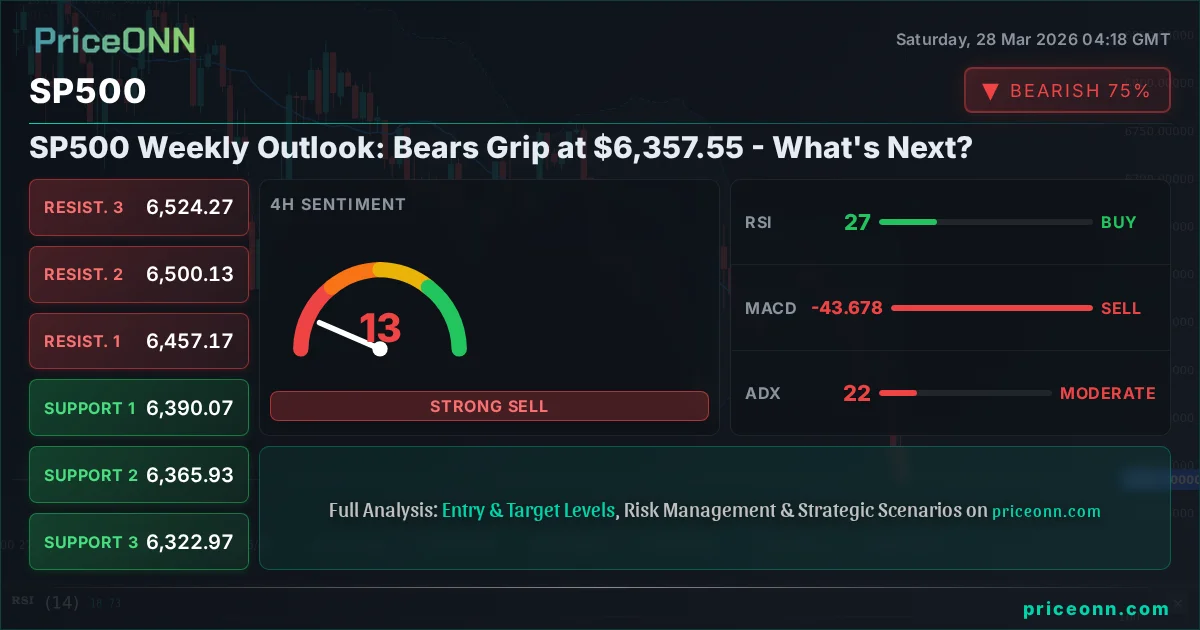
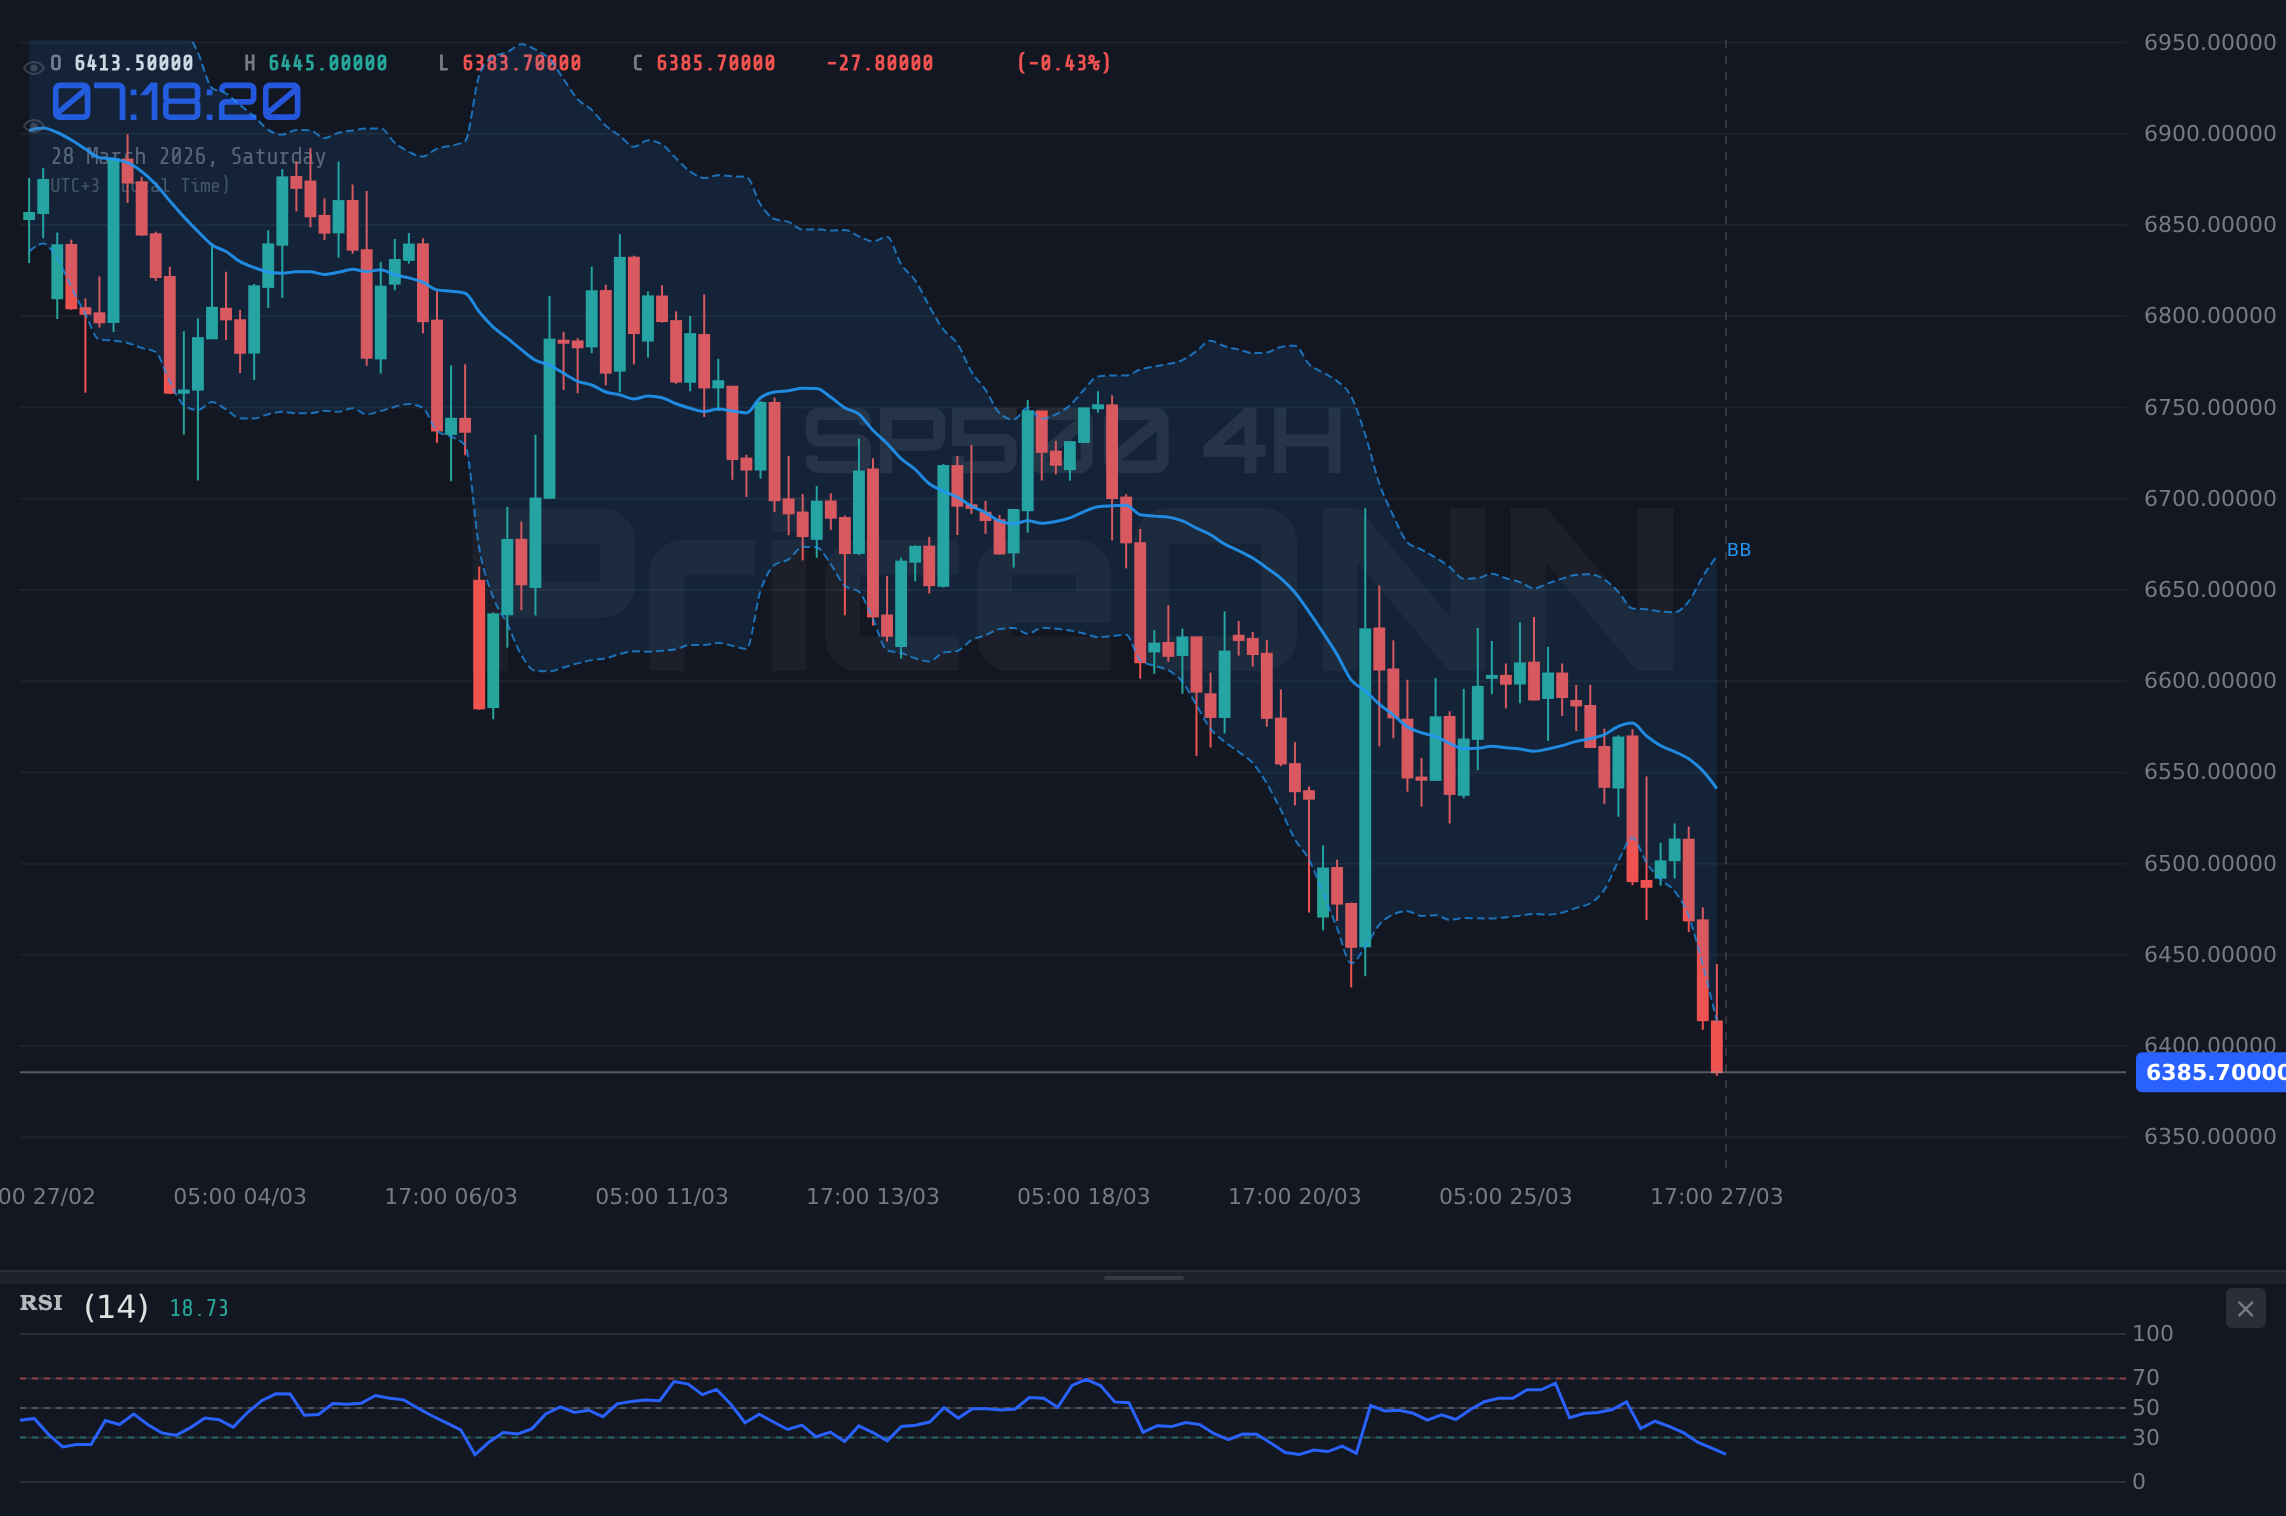
The S&P 500 (SP500) closed last Friday at a critical juncture, hovering around the $6,357.55 mark, with bears clearly tightening their grip. This past week has been a stark reminder of market volatility, as the index experienced a significant downturn, shedding 2% on Friday alone and closing at $6,357.55. This sharp decline, detailed in the latest market data, paints a concerning picture for equity bulls and signals that the bears may be regaining control. The question on every trader's mind is: what does this sharp pullback mean for the coming week, and where are the key levels to watch? We'll dive deep into the technicals, explore the macroeconomic undercurrents, and lay out the most probable scenarios.
- The S&P 500 (SP500) is currently trading at $6,357.55, showing significant bearish pressure with a 2% drop on Friday.
- Key support for the SP500 is found at $6,356.43 (1H), with a more significant level at $6,322.97 (4H).
- Resistance levels to watch are $6,387.23 (1H) and $6,457.17 (4H), with a crucial break needed for a bullish shift.
- RSI at 19.92 (1H) and 26.9 (4H) indicates extreme oversold conditions, suggesting potential for a short-term bounce but not a trend reversal yet.
- The ADX reading of 32.68 (1H) and 47.68 (1D) confirms a strong downtrend, indicating that any bounces may be short-lived without significant fundamental shifts.
- Correlation with DXY at 99.91 suggests a strengthening dollar is weighing on equities, a trend to monitor closely.
The past trading week was brutal for the S&P 500. After a period of consolidation, the index decisively broke below key support levels, culminating in a sharp sell-off on Friday. The current price of $6,357.55 reflects this downward momentum, and the technical indicators across multiple timeframes paint a grim picture. On the 1-hour chart, the SP500 shows a strong downtrend with an ADX of 32.68, confirming the power of the current move. The RSI is deeply oversold at 19.92, hinting at a potential for a short-term relief rally, but the overall trend remains decidedly bearish. This is not a market for the faint of heart; the bears have firmly planted their flag, and the path of least resistance appears to be lower.
Looking at the 4-hour timeframe, the situation is equally dire. The trend is classified as bearish with a power rating of 96%, and the ADX at 22.36 still indicates a strong trend, albeit slightly weaker than the 1-hour chart. The RSI is also in oversold territory at 26.9, reinforcing the idea that a bounce is possible but unlikely to sustain without a significant catalyst. The Stochastic indicator is showing extreme oversold readings on both K and D lines, suggesting that sellers might be exhausted in the very short term, but the overall market structure is still favoring downside. This prolonged period of selling pressure suggests that underlying market sentiment has shifted considerably, and any rallies are likely to be met with renewed selling interest.
The daily chart provides the broadest perspective, and it confirms the prevailing bearish sentiment. The trend is unequivocally down, with a power rating of 100%. The ADX at 47.68 is exceptionally high, indicating a very strong, established downtrend. This means that breaking this trend will require substantial force, likely driven by major macroeconomic shifts or a significant change in Fed policy expectations. The RSI at 26.73 is deeply oversold, and while this often precedes a bounce, the strength of the downtrend suggests that such bounces could be short-lived. The MACD is also firmly in negative territory, with the histogram showing persistent selling momentum. This daily perspective is crucial; it tells us that the current weakness is not just a blip but a significant market move that could have lasting implications if not corrected soon.
The correlation with the US Dollar Index (DXY) is also a critical piece of the puzzle. As the SP500 has been falling, the DXY has shown strength, currently trading around 99.91. This inverse relationship is typical; a strengthening dollar often puts pressure on US equities as it makes dollar-denominated assets less attractive to foreign investors and can signal tighter global financial conditions. The fact that the DXY is showing a bullish trend across all timeframes, particularly with a strong ADX on the daily chart, reinforces the bearish outlook for the SP500. This dynamic suggests that global capital is flowing towards the perceived safety of the dollar, away from riskier assets like stocks. Any sustained strength in the DXY will likely continue to act as a headwind for the equity markets.
Furthermore, the recent economic data released over the last few days adds another layer of complexity. While some data points, like the USD figures for [specific event data if available], have shown mixed results (Actual: 6.926 vs Forecast: -1.3), the overall picture emerging is one of slowing growth or persistent inflation concerns that keep the Federal Reserve on a hawkish stance. The fact that the SP500 has reacted so negatively to this data suggests that market participants are pricing in a higher probability of prolonged higher interest rates, which is detrimental to equity valuations. The market appears to be repricing risk premiums upwards, reflecting a more cautious outlook for corporate earnings in the near to medium term.
Let's examine the specific support and resistance levels that traders are watching. On the 1-hour chart, immediate support is seen at $6,371.83, followed by $6,365.87. A break below these levels could accelerate the decline towards the more significant 4-hour support at $6,322.97. On the resistance side, the $6,387.23 level on the 1-hour chart is the first hurdle. A convincing break above this, and more importantly above the 4-hour resistance at $6,457.17, would be needed to signal a potential reversal. However, given the strong downtrend and the extremely oversold conditions, any upward movement might be a 'bear market rally' rather than the start of a new uptrend. The ADX readings across timeframes confirm the strength of the current bearish trend, making it difficult for bulls to gain traction.
The divergence in signals between different timeframes and indicators is also noteworthy. While the 1-hour and 4-hour charts show strong bearish trends with oversold RSI, the daily chart's RSI at 26.73, while oversold, has a slightly less aggressive ADX reading than the intraday charts. This could suggest that the current steep decline might be reaching exhaustion points, but the overall trend is still firmly down. The Stochastic indicator on the daily chart is also showing a potential for a bounce, with the %K line crossing above the %D line, but this is occurring in oversold territory and needs confirmation from price action and other indicators. This mixed signal environment highlights the need for caution and precise trade execution.
The broader market sentiment, as indicated by the Nasdaq 100 (down 2.23%) and Dow Jones 30 (down 2.08%), mirrors the weakness seen in the SP500. This widespread selling pressure across major US indices suggests that the decline is not isolated to a few sectors but is a systemic risk-off move. The Nasdaq 100, in particular, shows a strong bearish trend with an ADX at 39.61 on the 1-hour chart and is also deeply oversold. This synchronised weakness across the major US stock indices reinforces the bearish outlook and suggests that the current market environment is driven by broad-based risk aversion rather than specific stock-related news.
Correlation with commodity markets also provides context. Brent crude oil prices have surged significantly, up 6.77% to $110.64, and WTI crude has jumped 7.69% to $101.19. This spike in oil prices, likely driven by geopolitical tensions and supply concerns, can exacerbate inflationary pressures. Higher energy costs generally translate to higher inflation, which in turn can lead to central banks maintaining a tighter monetary policy for longer. This macro backdrop is fundamentally negative for equities, as it squeezes corporate margins and reduces consumer purchasing power. The market may be anticipating a more aggressive Fed response to rising inflation, further pressuring stock prices.
The crypto market, while often seen as a separate asset class, also offers insights into risk appetite. Bitcoin (BTCUSD) is currently trading around $66,153, showing some resilience but with a bearish trend on the 4-hour chart (ADX 29.6). Ethereum (ETHUSD) is at $1,987.88, also exhibiting bearish signals. The fact that even riskier assets like cryptocurrencies are showing bearish trends suggests a broader flight from risk across all markets. If risk assets are falling in unison, it indicates a systemic issue rather than a sector-specific rotation. This paints a challenging picture for the SP500, as the current market environment is not conducive to sustained equity rallies.
The current technical setup on the SP500 is a textbook example of a market under pressure. The daily chart shows a clear downtrend with strong ADX and oversold RSI. The 1-hour and 4-hour charts confirm this bearish momentum, with immediate support levels being tested. The question is not whether the market is bearish, but how deep this correction could go and what signals would indicate a potential bottom or a sustained bounce. For now, the odds favour further downside, or at best, a period of consolidation within a downtrend. Traders must remain vigilant, manage risk tightly, and wait for clearer signals before committing to significant positions.
Given the confluence of bearish technical signals, the strong dollar, rising oil prices, and the overall risk-off sentiment, the outlook for the SP500 remains cautious. The extreme oversold conditions on intraday charts present a short-term trading opportunity for a bounce, but the underlying trend on the daily chart suggests that any such rallies will likely be temporary. The key will be how price action behaves around the critical support and resistance levels identified. A failure to hold the immediate support could lead to a rapid decline towards the lower targets, while a decisive break above key resistance levels would be needed to even consider a bullish reversal.
The macroeconomic calendar for the upcoming week will be crucial. While specific high-impact events for Friday were mixed, upcoming releases will shape market expectations regarding inflation and Fed policy. Any data that suggests persistent inflation or a tightening labor market could further pressure the SP500, while signs of cooling inflation or a weakening economy might paradoxically lead to a relief rally as rate cut expectations increase. However, given the current strength of the downtrend, the market may require significant positive catalysts to reverse course. Investors and traders will be scrutinizing every piece of data for clues about the Fed's next move.
Navigating the Downturn: Scenario Analysis
The Bull's Uphill Battle
For the bulls to regain control, a significant shift in market dynamics is required. The immediate trigger for a bullish scenario would be a decisive close above the 1-hour resistance at $6,387.23, followed by a sustained push through the 4-hour resistance at $6,457.17. This would indicate that the selling pressure is abating and that buyers are stepping in. Confirmation would come from an RSI moving out of oversold territory and MACD histograms starting to turn positive. If these conditions are met, the next target would be the $6,500 level, followed by the more significant daily resistance around $6,567.17. A break and hold above $6,567.17 would signal a potential trend change, opening the door for further upside towards $6,647.03 and potentially higher. However, the strong bearish trend and high ADX readings suggest this scenario is currently the least probable, requiring substantial external catalysts.
Where Bears Reign Supreme
The bearish scenario remains the most probable given the current technical setup. The trigger for this scenario is a break and sustained hold below the immediate 1-hour support at $6,356.43. This would likely lead to a quick test of the 4-hour support at $6,322.97. If this level fails to hold, the path opens up towards the daily support at $6,309.37. A decisive break below $6,309.37 would confirm the continuation of the strong downtrend, with potential targets at $6,200 and even lower towards $6,100 if the selling momentum intensifies significantly. Invalidation for this scenario would be a strong close above the $6,457.17 resistance level, suggesting that the bearish trend has been broken. The current market sentiment and technical indicators strongly support this outlook, making it the baseline expectation.
The Waiting Game: Consolidation Phase
A neutral or range-bound scenario is also possible, particularly if the market awaits significant economic data or Fed commentary. This would involve the SP500 consolidating between the immediate 1-hour support ($6,356.43) and resistance ($6,387.23) levels. Price action might become choppy, with failed attempts to break higher or lower. In this scenario, the RSI might hover in the oversold or near-oversold territory without making significant upward progress, and the ADX would likely remain elevated, indicating a strong trend that is temporarily paused rather than reversed. This phase could continue until a clear catalyst emerges, forcing a decisive move in either direction. While possible, the strong daily trend strength (ADX 47.68) makes prolonged consolidation less likely without a significant shift in underlying conditions. This phase is more likely to be a pause before the next leg down.
The Bearish Path: Downside Acceleration
65% ProbabilityThe Sideways Squeeze: Range-Bound Action
25% ProbabilityThe Bullish Rebound: A Tough Climb
10% ProbabilityKey Levels to Watch This Week
The Battleground: Support and Resistance
The upcoming week will likely see intense focus on the key support and resistance levels identified. On the downside, the immediate 1-hour support at $6,356.43 is the first line of defense. A failure here could quickly lead to tests of the $6,322.97 level on the 4-hour chart, which represents a more significant psychological and technical barrier. Below that, the $6,309.37 level on the daily chart becomes a critical point; a breach here would solidify the bearish trend and open the door for a deeper correction. On the upside, the bulls need to reclaim the $6,387.23 level on the 1-hour chart as a first step. However, the real test lies at the 4-hour resistance of $6,457.17. A sustained move above this level would be required to signal a potential shift in momentum, but this seems unlikely without strong fundamental catalysts.
Economic Calendar and Fed Watch
The economic calendar holds the key to potential market catalysts. While Friday's US data was mixed, the upcoming week's releases will be closely scrutinized for their impact on inflation and interest rate expectations. Any deviation from forecasts, particularly in employment or inflation figures, could trigger significant price action. For instance, if upcoming data points to sticky inflation, the market may price in a higher probability of the Fed maintaining its hawkish stance or even considering further tightening, which would be negative for the SP500. Conversely, signs of a rapidly cooling economy or falling inflation could fuel hopes for rate cuts, potentially triggering a relief rally. Given the current strong downtrend, the market is likely to react sharply to any data that deviates from expectations, potentially accelerating moves towards the key support or resistance levels.
What I'm Watching This Week
This week, my focus will be on three critical triggers that could dictate the SP500's direction. Firstly, I'll be watching the price action around the 1-hour support level at $6,356.43. A decisive break below this level, confirmed by strong volume, would validate the bearish scenario and likely lead to a swift move towards $6,322.97. Secondly, I'll be monitoring the 4-hour resistance at $6,457.17. A strong push and sustained hold above this level would be the primary signal for a potential bullish reversal, although this remains a low-probability outcome currently. Finally, I'll be paying close attention to any major shifts in Fed policy expectations, particularly any new commentary from Fed officials or significant surprises in economic data that could alter the market's view on interest rates. These triggers will be paramount in navigating the choppy waters ahead.
Frequently Asked Questions: SP500 Analysis
What happens if SP500 breaks below the key support at $6,322.97?
A break below the $6,322.97 support level on the 4-hour chart would strongly confirm the continuation of the bearish trend. This would likely trigger further selling pressure, potentially opening the path towards the daily support at $6,309.37 and possibly accelerating towards the $6,200 psychological level. Invalidation of this bearish outlook would require a subsequent reclaim and hold above $6,356.43.
Should I consider buying SP500 at current levels around $6,357.55 given the oversold RSI?
While the RSI is deeply oversold at 19.92 on the 1-hour chart and 26.9 on the 4-hour chart, buying at current levels carries significant risk due to the strong bearish trend indicated by the ADX. A short-term bounce is possible, but it's more prudent to wait for confirmation of a trend reversal, such as a close above $6,457.17, before considering long positions. Risk management is paramount in this environment.
Is the RSI reading of 26.73 on the daily chart a reliable buy signal for SP500?
An RSI of 26.73 on the daily chart is indeed in oversold territory, suggesting potential for a bounce. However, it is not a standalone buy signal, especially with the ADX at a strong 47.68 confirming a powerful downtrend. This reading primarily indicates that the selling momentum might be reaching exhaustion, but a trend reversal requires more confirmation, such as price breaking key resistance levels like $6,457.17.
How will upcoming economic data releases affect the SP500 this week, given the current trend?
Upcoming economic data will be critical in shaping Fed policy expectations and, consequently, the SP500's direction. Data suggesting persistent inflation or a strong economy could pressure the index further by reinforcing hawkish Fed sentiment. Conversely, weak data might boost hopes for rate cuts, potentially triggering a relief rally. The market's reaction will likely be amplified due to the current oversold conditions and strong downtrend.
The market is currently dominated by bearish sentiment, with technical indicators across multiple timeframes signaling further downside potential. While extreme oversold conditions present opportunities for short-term bounces, the strong downtrend indicated by the ADX suggests that any rallies may be short-lived. The key levels to watch remain $6,356.43 on the downside and $6,457.17 on the upside. A decisive break of either level, coupled with shifts in macroeconomic data and Fed policy expectations, will dictate the next major move. For now, caution is advised, and risk management should be the top priority.
Track markets in real-time
AI-powered analysis, technical indicators and real-time price data.
Join Our Telegram Channel
Breaking market news, AI analysis and trading signals instantly.
Join Channel