XAGUSD Weekly: Silver Holds $69.74 Amid Geopolitical Jitters, Key Levels Watched
Silver at $69.74 shows mixed signals. Geopolitical tensions support prices, but a strong dollar and mixed technicals create uncertainty. Key levels at $68.59 and $71.68 are critical for next week's direction.
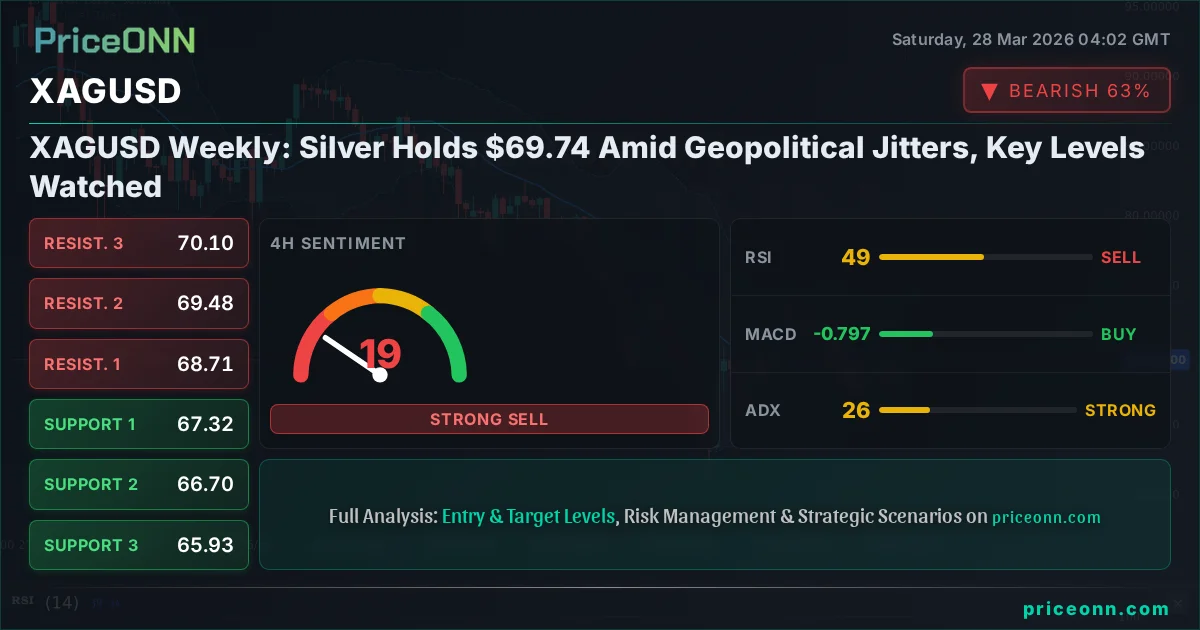
The silver market, currently trading at exactly $69.74, finds itself at a critical juncture as we close out another volatile week. Geopolitical tremors continue to provide a baseline of support for precious metals, yet the persistent strength of the US Dollar and conflicting technical indicators paint a complex picture for traders. Understanding the interplay between these forces is paramount for navigating the choppy waters ahead. This week's analysis delves into the nuanced signals from the charts and the broader market context, aiming to provide clarity on where XAGUSD might be headed.
- RSI at 53.19 on the 1H chart indicates neutral momentum with a slight upward bias, while the 4H RSI at 49.03 suggests a subtle downward lean, highlighting intraday vs. short-term divergence.
- Critical support for XAGUSD sits at $68.59, a level that has been tested on the 1H chart; a break below this could target $67.32 on the 4H chart.
- The ADX reading of 19.81 on the 1H timeframe suggests a weak trend, indicating potential for sideways movement or a breakout, contrasting with the stronger trend signals on longer timeframes.
- The US Dollar Index (DXY) is currently at 99.91, its strength putting underlying pressure on dollar-denominated assets like silver, especially as it hovers near the 100 mark.
Navigating the Crosscurrents: Technicals and Geopolitics
The price action in XAGUSD this past week has been a masterclass in market indecision, oscillating around the $69.74 mark. On the hourly chart, the Relative Strength Index (RSI) hovers at 53.19, suggesting a neutral stance but with a slight inclination towards bullish momentum. This often signifies that while buyers are present, they aren't fully in control. However, when we shift to the 4-hour timeframe, the RSI dips to 49.03, inching closer to the oversold territory and hinting at a potential weakening of upward pressure. This divergence between timeframes is a classic sign that the market is struggling to find a clear direction. The Average Directional Index (ADX) on the hourly chart, reading 19.81, reinforces this notion of a weak trend. An ADX below 20 typically indicates a range-bound market or the very early stages of a new trend, meaning the current price action might be more noise than signal until a clearer directional move emerges. This is precisely where careful observation and adherence to key levels become crucial for any trader aiming to capitalize on silver's movements.
The broader economic landscape also plays a significant role. The US Dollar Index (DXY) is currently trading at 99.91, a level that historically exerts downward pressure on commodities priced in dollars, including silver. A strong dollar makes silver more expensive for holders of other currencies, potentially dampening demand. This inverse correlation is a fundamental aspect of precious metal trading. Furthermore, the significant daily gains seen in Brent crude oil, now at $110.64, and WTI at $101.19, signal rising inflation expectations and heightened geopolitical risk. While rising oil prices can sometimes correlate with precious metals as inflation hedges, the dominant factor currently appears to be the dollar's strength and the broader risk sentiment reflected in equity markets. Understanding these macro drivers is key to interpreting the short-term technical signals.
Hourly Chart: A Battle for Momentum
Delving deeper into the hourly chart, the $69.74 price point is nestled between immediate support at $69.62 and resistance at $70.65. The MACD indicator shows positive momentum, with the MACD line above the signal line, suggesting that short-term buying pressure has been present. However, this is tempered by the Stochastic Oscillator, where the %K line (60.59) is below the %D line (62.92), indicating a potential bearish crossover and a warning of waning momentum. This conflict between MACD's positive signal and Stochastic's bearish hint is precisely why relying on a single indicator is perilous. The Bollinger Bands are trading above the middle band, aligning with the MACD's positive bias, but the overall weak trend indicated by the ADX (19.81) suggests that any upward move might lack conviction. Traders watching the hourly chart will be keenly observing the $70.65 resistance level; a decisive break above this, especially with increasing volume, could signal a short-term rally. Conversely, a failure to overcome this level and a subsequent dip below the $69.62 support could initiate a move towards the next key hourly support at $69.05.
The overall signal on the 1H chart leans towards 'BUY' with 6 buy signals against 2 sell signals, but the nuances of the Stochastic and ADX indicators suggest caution. It's a market where short-term traders might find opportunities in quick scalps, but longer-term players should be wary of prematurely committing to a direction based solely on hourly fluctuations. The price being above the 1H middle Bollinger Band offers a slight bullish bias, but the weak ADX means this could easily reverse if broader market sentiment shifts. We need to see sustained price action above key resistance levels to confirm a bullish continuation, and conversely, a clear break below support to confirm a bearish move. The current state is one of watchful waiting, with immediate price action being the key determinant.
4-Hour Chart: A Trend in Transition?
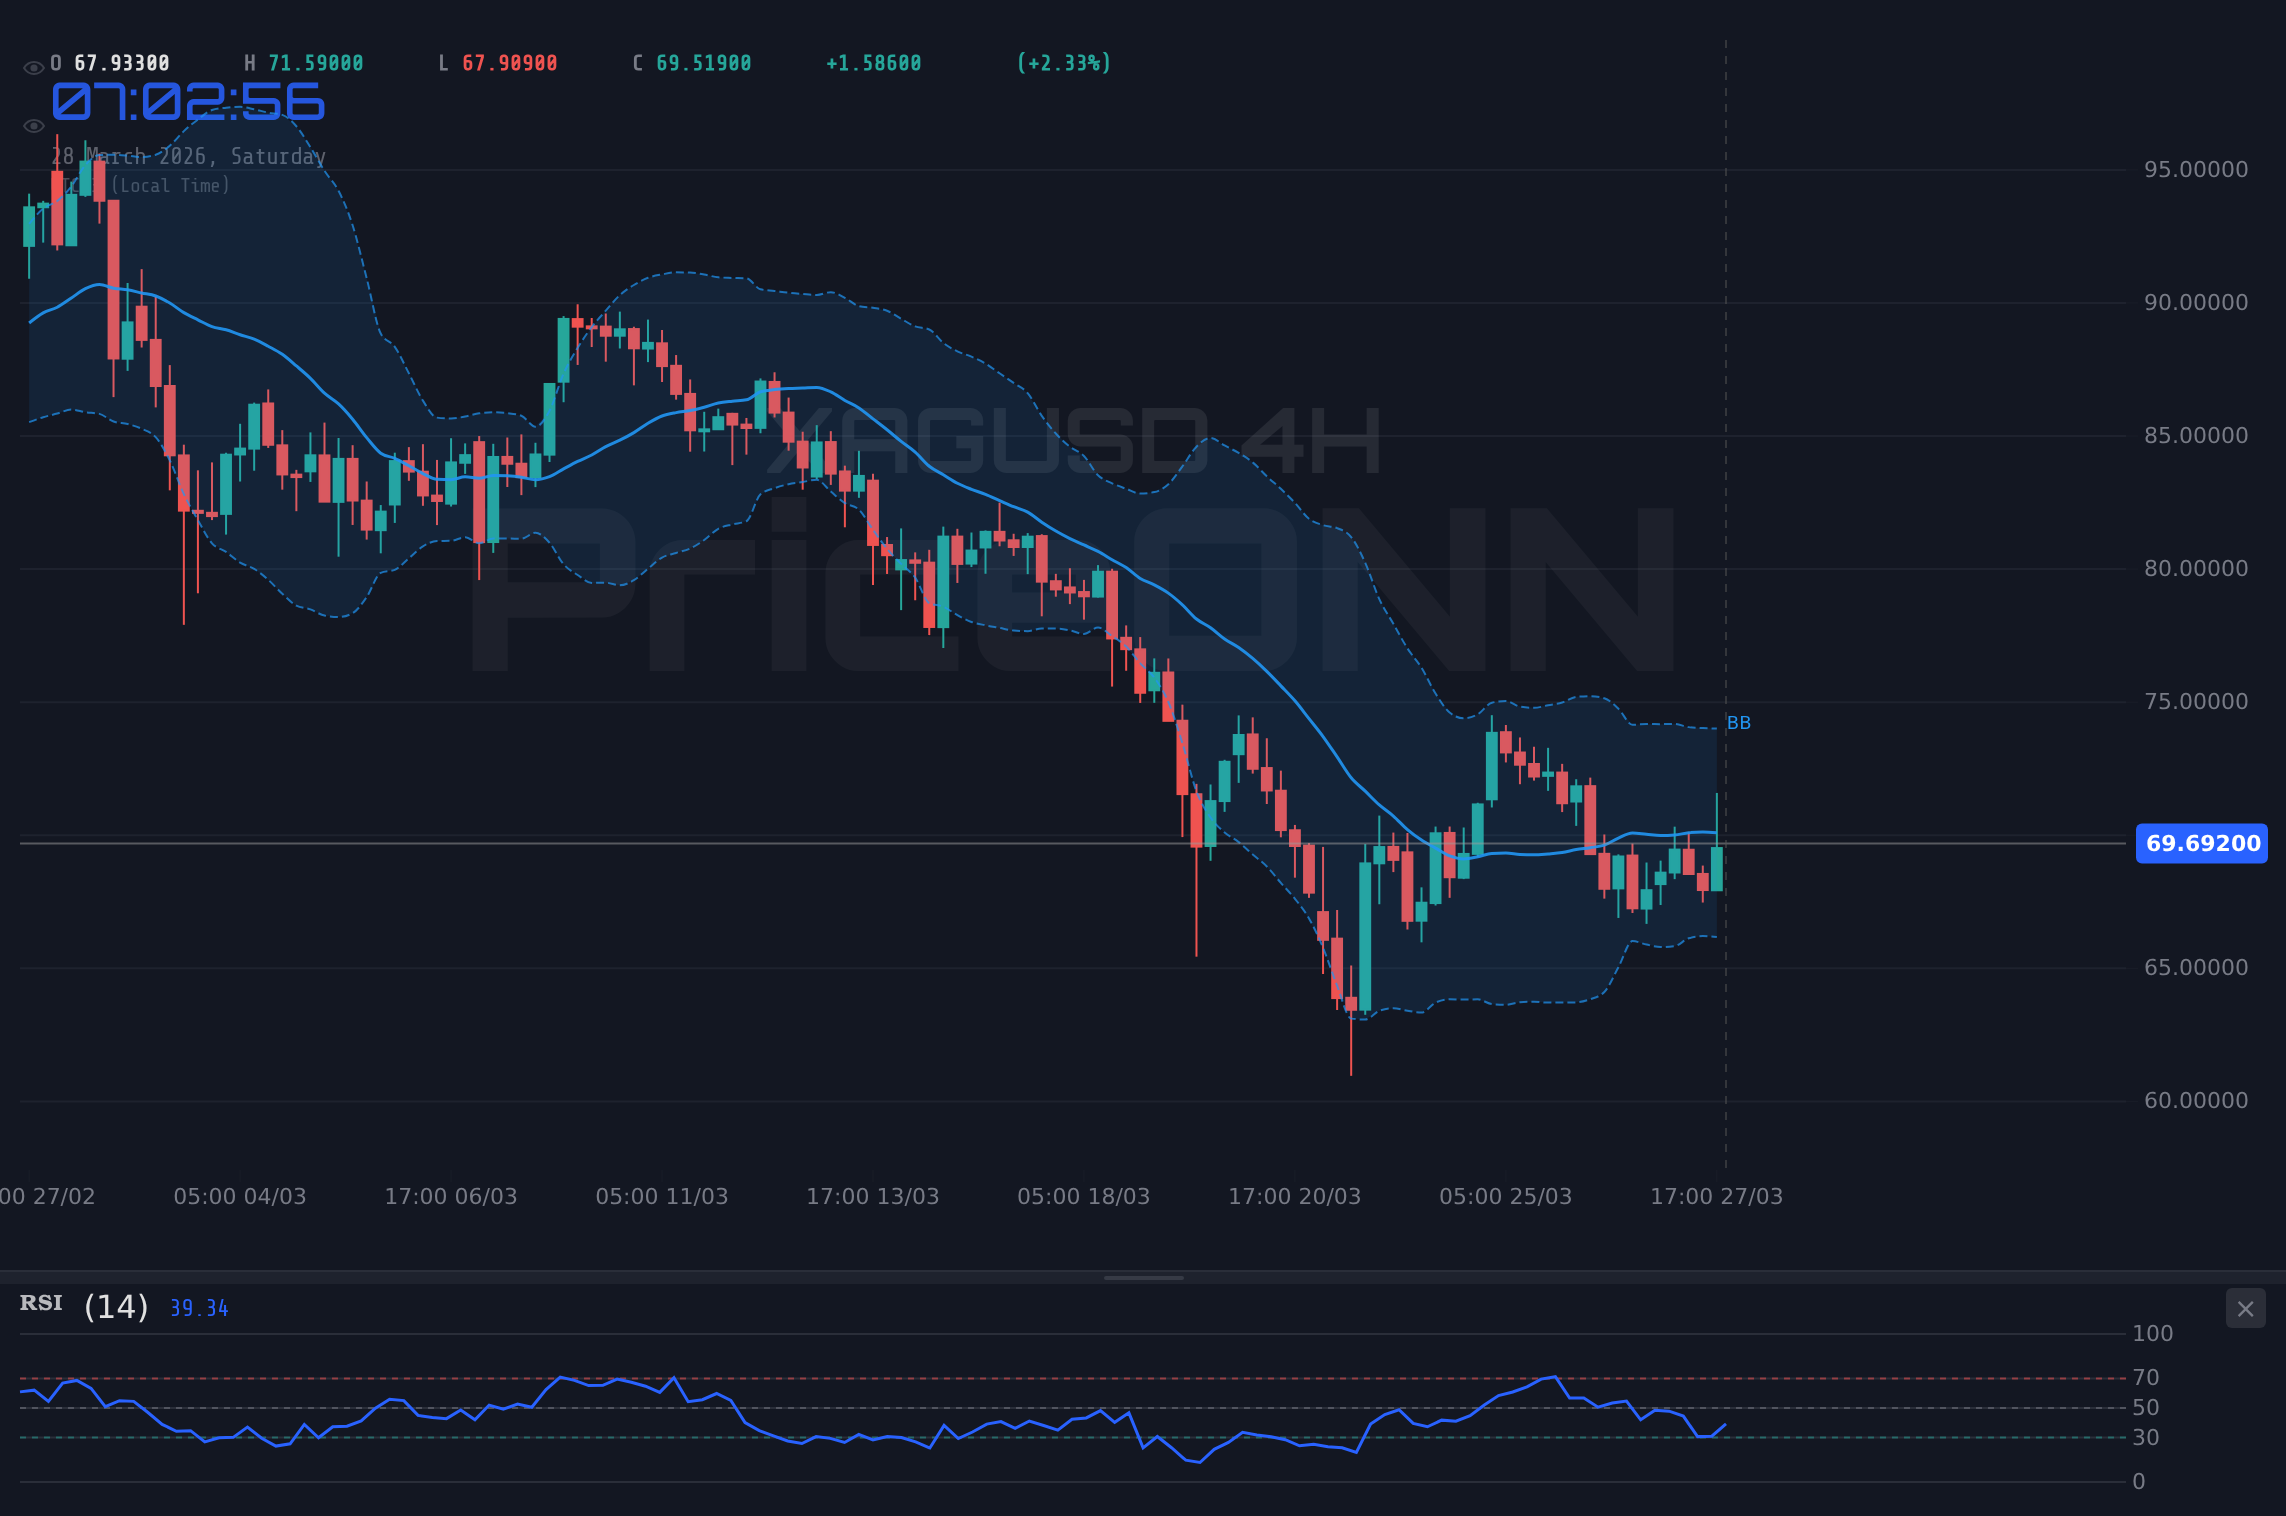
Shifting to the 4-hour chart, the picture becomes slightly more bearish, with the trend identified as 'Düşüş' (Downtrend) with a strength of 50%. However, the signals are mixed, suggesting a potential transition phase. The RSI at 49.03 is sitting almost exactly at the midpoint, indicating a lack of strong directional bias, though it has a slight downward inclination. The MACD remains positive, crossing above its signal line, which is a bullish sign. Yet, the Stochastic Oscillator here presents a strong bullish signal, with %K (39.87) clearly above %D (29.84), suggesting that the downward pressure might be easing and a potential upward move is brewing. The ADX reading of 26.25 on this timeframe indicates a moderately strong trend, which, given the other indicators, could be interpreted as the market attempting to establish an uptrend after a period of consolidation or decline. The general signal leans towards 'BUY' (6 buys, 2 sells), but this is in direct contrast to the daily chart's bearish outlook.
Support levels on the 4-hour chart are identified at $67.32, $66.70, and $65.93. Resistance is seen at $68.71, $69.48, and $70.10. The current price of $69.74 sits just below the $70.10 resistance, making this a crucial area to watch. A decisive break above $70.10 could potentially trigger a move towards higher resistance levels, validating the bullish signals from the Stochastic and MACD. However, the overall trend on the daily chart remains bearish, introducing a significant caveat. Traders should pay close attention to how price reacts around the $69.48 to $70.10 resistance zone. A rejection here, coupled with a breakdown below the $67.32 support, would align with the longer-term bearish sentiment and could signal a continuation of the downtrend. The mixed signals across the 1H and 4H charts necessitate a cautious approach, prioritizing confirmation from price action and volume.
Daily Chart: The Bearish Shadow Looms Large
The daily chart presents the most concerning outlook for silver bulls. The trend is clearly defined as 'Düşüş' (Downtrend) with a formidable strength of 90%. The current price of $69.74 is significantly below the daily resistance level of $4497.62, and even further from the higher levels. The RSI(14) is firmly in bearish territory at 36.34, indicating that sellers have been in control and there's considerable room before reaching oversold conditions. The MACD histogram is negative, sitting below its signal line, a classic bearish signal confirming downward momentum. Bollinger Bands are trading below the middle band, reinforcing the bearish trend. The Stochastic Oscillator shows %K at 37.02 and %D at 25.31, which, while indicating a potential for a bounce (as %K is above %D), is occurring within an overall bearish context and is not a strong buy signal on its own. The ADX at 30.99 signifies a strong downtrend, underscoring the bearish conviction on this longer timeframe.
The support levels on the daily chart are substantial: $4304.96, $4231.7, and $4112.3. These are the levels that would need to be breached for a significant bearish continuation. Conversely, resistance levels are formidable: $4497.62, $4617.02, and $4690.28. The current price of $69.74 is a world away from these daily levels, highlighting the disconnect between the intraday price action and the longer-term trend. The general signal for the daily timeframe is 'SAT' (2 buys, 6 sells), reflecting the prevailing bearish sentiment. For any bullish reversal to gain traction, XAGUSD would need to overcome not only the immediate hourly and 4-hour resistances but also begin a sustained climb towards the daily resistance levels, which seems unlikely given the current data. The prevailing sentiment from the daily chart is one of caution and potential downside risk, despite any short-term technical bounces.
Correlation Analysis: DXY, Equities, and Oil
The interplay between XAGUSD, the US Dollar Index (DXY), major equity indices like the S&P 500 (SP500) and Nasdaq 100 (Nasdaq), and oil prices (Brent and WTI) provides crucial context. Currently, the DXY is at 99.91, demonstrating strength and acting as a headwind for silver. A rising dollar typically correlates with falling silver prices, as it increases the cost for international buyers and reduces the purchasing power of other currencies. This dynamic is clearly at play, with the dollar showing upward momentum across multiple timeframes.
Equity markets are experiencing significant turmoil. The SP500 is down sharply to 6357.55, and the Nasdaq is at 23092.5, both showing strong daily declines. This risk-off sentiment could theoretically boost safe-haven assets like gold and silver. However, the magnitude of the equity selloff might be overpowering this effect, or perhaps the dollar's strength is the primary focus for safe-haven flows. The fact that both SP500 and Nasdaq are showing strong bearish signals on their daily charts, with RSI readings in the low 20s and 30s, indicates deep oversold conditions. This could lead to a technical bounce in equities, which might, in turn, reduce some of the demand for the dollar as a safe haven, potentially offering some relief to silver. Meanwhile, oil prices are surging, with Brent at $110.64 and WTI at $101.19, driven by geopolitical concerns. This rise in energy costs fuels inflation expectations, which traditionally benefits precious metals. However, the dominant narrative appears to be dollar strength and equity market fear, overshadowing the inflation-hedge narrative for silver at this moment. The correlation suggests that a sustained drop in equities, coupled with a strong dollar, creates a challenging environment for XAGUSD, despite rising oil prices.
Economic Calendar Watchlist: Key Catalysts Ahead
Looking at the economic calendar, the past few days have seen some significant data releases, and the upcoming week holds further potential catalysts. For instance, the US Non-Farm Payrolls (NFP) data released recently showed 6.926 million jobs added, significantly exceeding the forecast of -1.3 million and the previous 6.156 million. This robust employment figure, while seemingly positive for the US economy, can paradoxically add pressure on risk assets if it fuels expectations of tighter monetary policy. The market's reaction to such data is often complex, factoring in future interest rate implications.
Upcoming events that traders should monitor closely include potential high-impact releases for the British Pound (GBP) and the US Dollar (USD). While specific dates are not provided for all upcoming events in the provided data, the general trend suggests that employment and economic growth figures will remain in focus. For example, if upcoming GBP data shows a significant deviation from forecasts, it could impact the EURUSD and GBPUSD pairs, indirectly influencing broader market sentiment. Similarly, any major shifts in US economic indicators, especially those related to inflation or employment, could significantly move the DXY and subsequently impact XAGUSD. The absence of specific dates for some high-impact events means traders need to stay vigilant for any scheduled announcements. The key is to assess how these economic releases align with or contradict the current technical picture. For example, if upcoming data suggests a cooling economy, it might reinforce the bearish technical outlook for silver, while strong inflation data could bolster its appeal as an inflation hedge, provided the dollar doesn't completely dominate.
Scenario Analysis: Charting Potential Paths for XAGUSD
Bearish Scenario: Downside Risk Prevails
65% ProbabilityNeutral Scenario: Consolidation Around $69.74
25% ProbabilityBullish Scenario: Reclaiming Higher Ground
10% ProbabilityTrader Psychology: Navigating Uncertainty
As traders, we often find ourselves caught between the desire for decisive market signals and the reality of ambiguous price action. The current situation with XAGUSD at $69.74 perfectly encapsulates this challenge. We see conflicting indicators: MACD suggests upward momentum on the hourly, while Stochastic warns of a pullback. The daily chart paints a bearish picture, yet intraday charts show attempts at recovery. This ambiguity can trigger psychological responses. Fear of missing out (FOMO) might push traders to jump in on weak bullish signals, while fear of further losses could lead to premature exits during minor pullbacks. It's crucial to remember that markets rarely offer perfect clarity. Our training as psychologists reminds us that acknowledging this uncertainty is the first step. Instead of fighting it, we should embrace a strategy that accounts for it. This means relying on robust risk management, waiting for clear confirmation signals rather than chasing every minor price wiggle, and having well-defined trade plans with strict invalidation levels.
The temptation to over-trade or to force a position when the market isn't giving clear signals is immense. We must resist this. The data suggests that while there are immediate supports and resistances to watch, the overarching trend on the daily chart remains bearish. This implies that any bullish moves might be corrective bounces within a larger downtrend, or perhaps the very early stages of a new trend. Our role isn't to predict the future with certainty but to position ourselves optimally based on the probabilities presented by the data. This involves patience, discipline, and a willingness to sit on the sidelines when the setup isn't right. The $69.74 level is a pivot; how price behaves around it in the coming hours and days will dictate the immediate path, but the longer-term trend requires a significant shift in momentum and structure to be overturned.
Focus on the confluence of signals across multiple timeframes. Don't chase the hourly bounce if the daily chart is screaming 'sell'. Wait for confirmation, manage risk diligently, and let the market provide the clarity you need.
Key Levels to Watch: The $69.74 Pivot and Beyond
As we dissect the price action around $69.74, specific levels emerge as critical decision points for the coming week. On the hourly chart, immediate support lies at $69.62. A break below this level, especially if accompanied by increased volume, could signal a short-term bearish move targeting the $69.05 support. Further down, the $68.59 level represents a more significant hourly support zone. Failure to hold these levels could quickly bring the 4-hour chart's support into play, starting with $67.32, followed by $66.70. These are the levels where a more substantial downside move could be initiated, aligning with the bearish daily trend.
Conversely, for any bullish sentiment to take hold, XAGUSD must first conquer the immediate hourly resistance at $70.65. A decisive move above this, ideally with strong buying conviction, could pave the way towards the $71.11 and $71.68 resistance levels on the 4-hour chart. These represent key psychological and technical barriers. Breaking above $71.68 would start to challenge the bearish narrative on the shorter timeframes, but it would still be a long way from reversing the dominant daily downtrend. The current price of $69.74 is therefore a crucial pivot. A hold above it, with subsequent strength towards resistance, suggests a potential short-covering rally. A break below it, however, signals a continuation of the prevailing weakness, with the lower support levels becoming the primary focus. Traders should be prepared for volatility as price dances around these critical zones.
Conclusion: Patience and Precision in a Volatile Market
The silver market, as represented by XAGUSD at $69.74, is currently a complex tapestry woven with threads of geopolitical tension, a strong US dollar, and mixed technical signals. While intraday charts offer glimpses of potential bullish momentum, the overarching bearish trend on the daily timeframe, reinforced by the DXY's strength and equity market weakness, cannot be ignored. We are in a phase where clarity is scarce, and decisive action is best reserved for when the market provides more unambiguous signals. The key levels identified - $69.62 and $70.65 on the hourly, $67.32 and $70.10 on the 4-hour, and the significant daily supports and resistances - will serve as crucial signposts. Trading in such an environment demands patience, discipline, and a rigorous adherence to risk management. Chasing every tick is a recipe for disaster; waiting for high-probability setups that align across multiple timeframes and indicators is the path to sustainable success. The market will eventually reveal its hand; our job is to be ready to play the right cards when it does.
| Indicator | Value | Signal | Interpretation |
|---|---|---|---|
| RSI (14) | 53.19 | Neutral | Slight upward bias on 1H, downward lean on 4H. |
| MACD Histogram | Positive | Bullish | Positive momentum on 1H, suggesting upward pressure. |
| Stochastic Oscillator | K=39.87, D=29.84 | Bullish | Strong bullish signal on 4H, though 1H shows %K < %D warning. |
| ADX | 26.25 | Bullish | Moderately strong trend on 4H, weak trend on 1H (19.81). |
| Bollinger Bands | Above Mid Band | Bullish | Price above middle band on 1H and 4H, indicating upward bias. |
Frequently Asked Questions: XAGUSD Analysis
What happens if XAGUSD breaks below $69.62 support?
A break below the $69.62 hourly support, especially with volume, could trigger a move towards $69.05 and potentially test the $67.32 level on the 4-hour chart.
Is XAGUSD at $69.74 a buy given the mixed signals?
Buying at $69.74 is speculative given the conflicting indicators. A confirmed break above $70.65 resistance with strong volume offers a higher probability bullish setup, while a break below $69.05 support aligns with the bearish daily trend.
Is the RSI at 53.19 a buy signal for XAGUSD?
The hourly RSI at 53.19 indicates neutral momentum with a slight upward bias, but it's not a strong buy signal on its own, especially considering the 4-hour RSI at 49.03 suggests potential weakness.
How will the DXY at 99.91 affect XAGUSD next week?
The strong DXY at 99.91 typically exerts downward pressure on silver. If the dollar continues to strengthen amid risk-off sentiment, it could limit any upside potential for XAGUSD, even if geopolitical events cause temporary spikes.
Track markets in real-time
AI-powered analysis, technical indicators and real-time price data.
Join Our Telegram Channel
Breaking market news, AI analysis and trading signals instantly.
Join Channel