Nasdaq100 at $23,092.50: Bears Grip - Will Bulls Find Footing Next Week?
Nasdaq100 analysis shows bears firmly in control at $23,092.50. Key levels to watch next week as markets digest recent volatility.
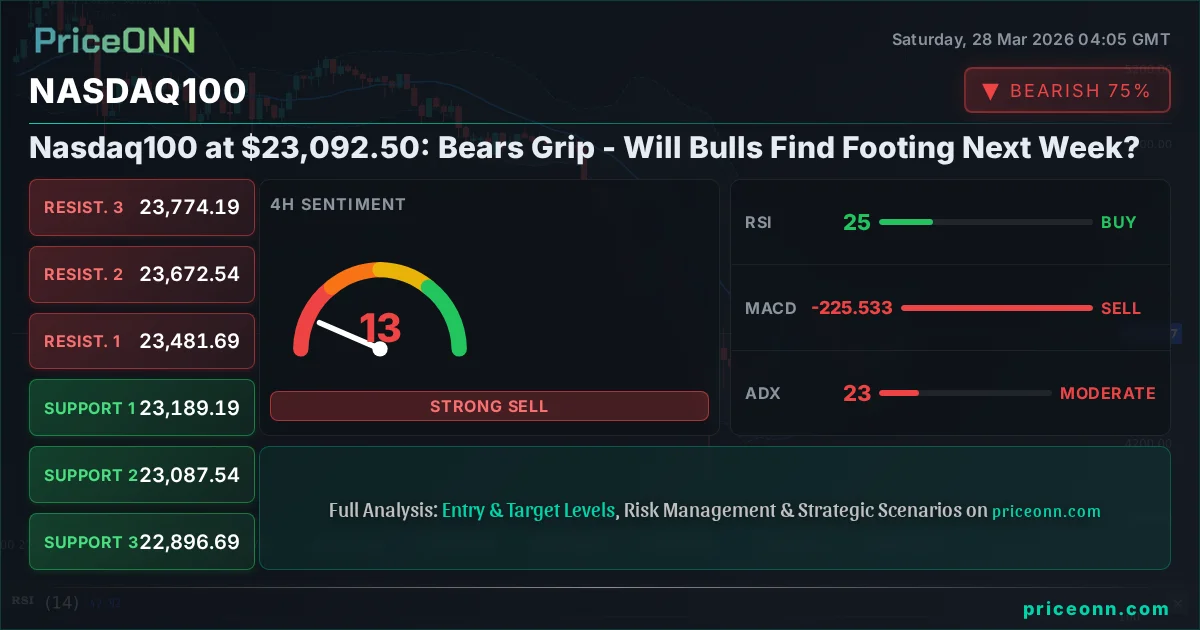
The Nasdaq100 is currently locked in a fierce battle between bulls and bears, trading precariously around the $23,092.50 mark. This level represents a critical juncture, with the index experiencing a significant downturn this past week, shedding 2.23% and closing Friday at $23,092.50. The question on every trader's mind is whether this sharp decline has exhausted itself, paving the way for a potential technical bounce, or if the bears will continue their assault, driving the index lower. This past week has been particularly brutal for risk assets, with the S&P 500 falling 2% to 6357.55 and the Dow Jones Industrial Average down 2.08% to 45077.50. This broad market weakness has undoubtedly cast a shadow over the tech-heavy Nasdaq100, amplifying selling pressure. Understanding the interplay between these indices, the Dollar Index (DXY), and underlying macroeconomic sentiment is crucial for navigating the choppy waters ahead.
- RSI at 20.41 on the 1H chart signals extreme oversold conditions, suggesting potential for a short-term bounce.
- Critical support for the Nasdaq100 sits at $23,061.21, a level tested multiple times this week. A close below this could trigger further downside.
- The ADX at 39.61 on the 1H chart indicates a strong downward trend, implying that any bounce may face significant headwinds.
- Fed rate expectations are a key driver, with the market closely watching for any shifts in policy signals that could influence risk appetite and correlation with the DXY, currently at 99.91.
As we head into the weekend, the technical picture for the Nasdaq100 is undeniably bearish across multiple timeframes. The 1-hour chart shows a strong downtrend with an ADX reading of 39.61, indicating significant directional momentum to the downside. The RSI is deeply oversold at 20.41, and the Stochastic Oscillator is flashing extreme oversold signals with %K at 2.42 and %D at 9.05. These indicators collectively suggest that while a short-term relief rally is possible, the underlying trend remains firmly in favor of the sellers. The 4-hour chart echoes this sentiment, showing a strong downtrend (ADX 22.63) with RSI at 26.9 and Stochastic deeply oversold. The daily timeframe presents an even starker picture: a 100% bearish trend strength, ADX at a formidable 47.68, RSI at 26.73, and Stochastic showing a bearish signal. This confluence of bearish technicals across different timeframes paints a challenging outlook for the index in the immediate future. The sheer strength of the bearish trend indicated by the ADX suggests that any upward movements might be met with significant selling pressure as traders look to re-enter short positions at more favorable levels.
The Case for a Bearish Nasdaq100 Outlook
Dominance of Downside Momentum
The most compelling argument for a continued bearish outlook on the Nasdaq100 stems from the overwhelming technical evidence. Across the 1H, 4H, and 1D timeframes, the indicators paint a consistent picture of sellers in firm control. On the 1-hour chart, the ADX is a robust 39.61, signaling a strong downtrend. This is corroborated by the RSI at 20.41, deep in oversold territory, and the Stochastic oscillator, with %K at a mere 2.42, indicating extreme selling pressure. This isn't just a minor dip; it's a well-established bearish trend that suggests further downside is probable. The MACD, while showing positive momentum on the 1H chart, is still below its signal line, hinting at potential for further downward movement or at least a struggle to gain upward traction. The price action itself, closing below $23,092.50, reinforces this negative sentiment. The daily chart's ADX of 47.68 is particularly alarming, signifying a very strong, established downtrend. This suggests that any attempts at recovery might be short-lived and met with substantial selling pressure as participants who missed the initial move look to short the market at higher prices.
Key Levels Under Threat
The Nasdaq100's technical structure is currently defined by a series of support levels that are being severely tested. On the 1-hour chart, immediate support is found at $23,061.21. A break below this level would likely trigger further selling, with the next significant support at $23,000.21, followed by $22,938.67. The 4-hour chart shows support at $23,087.54, $22,896.69, and then a more substantial level at $22,736.12. On the daily chart, the critical support levels are $23,384.39, $23,150.20, and then $22,736.12. The fact that the index is trading just above $23,092.50 means that the $23,061.21 and $23,087.54 levels are very close. A decisive close below these immediate supports on the shorter timeframes could accelerate the decline towards the more significant daily support at $23,150.20, and potentially further down towards $22,736.12 if the bearish momentum persists. The proximity of these levels means that a breakdown could happen rapidly, catching many participants off guard.
Correlation with Broader Market Weakness
The Nasdaq100 is not trading in a vacuum. The significant drops in the S&P 500 (to 6357.55) and the Dow Jones Industrial Average (to 45077.50) this past week highlight a broader risk-off sentiment gripping the equity markets. This correlation is a strong indicator that the selling pressure in the Nasdaq100 is part of a larger market rotation away from riskier assets. When major indices like the S&P and Dow experience such sharp declines, it typically signals a flight to safety, which often benefits assets like the US Dollar. Indeed, the Dollar Index (DXY) has shown strength, rising to 99.91. This strengthening dollar typically puts downward pressure on assets priced in dollars, including major US indices and commodities like gold (currently at $4495.44) and silver ($69.74). The interconnectedness of these markets suggests that any positive catalyst needed to reverse the trend in the Nasdaq100 would likely need to be significant enough to impact the broader market sentiment and dollar strength simultaneously. The current macroeconomic backdrop, characterized by persistent inflation concerns and uncertainty surrounding central bank policy, favors this risk-averse environment.
Macroeconomic Headwinds and Fed Uncertainty
The macroeconomic landscape continues to present challenges for growth-oriented assets like the Nasdaq100. While specific high-impact economic data releases were sparse this past week, the underlying concerns remain. Inflationary pressures, though perhaps moderating in some areas, are still viewed as persistent by many central bankers. This environment keeps the door open for tighter monetary policy or at least a prolonged period of higher interest rates. The market is constantly trying to price in the Federal Reserve's next moves. While the immediate prospect of rate cuts may have receded, any indication of future tightening or a less dovish stance from Fed officials could further dampen investor appetite for growth stocks. The correlation between the Nasdaq100 and the DXY (currently 99.91) is also a factor; a strong dollar often implies tighter global financial conditions, which can be a headwind for equities. Furthermore, geopolitical tensions, though not explicitly detailed in the provided data for this analysis, are always a background risk that can quickly shift market sentiment towards safety, impacting the Nasdaq100 negatively. The energy markets, with Brent crude at $110.64 and WTI at $101.19, showing significant gains, highlight ongoing inflationary concerns and supply-side risks that could keep central banks on edge.
The Bullish Counter-Argument: Oversold Conditions and Potential Reversal
RSI and Stochastic Signaling Extreme Oversold
Despite the overwhelming bearish technicals, there's a strong argument to be made for a potential short-term bounce based on extreme oversold conditions. On the 1-hour chart, the RSI is a mere 20.41, and the Stochastic oscillator is deeply in the oversold zone with %K at 2.42 and %D at 9.05. Similarly, the 4-hour chart shows RSI at 26.9 and Stochastic at 2.51/%K and 14.09/%D. These readings are historically significant and often precede at least a temporary reversal or a period of consolidation. While oversold conditions do not automatically signal a buy, they indicate that the selling pressure may be overextended in the short term. This creates a potential setup for a technical bounce as traders look to cover short positions or buy at what might be perceived as discounted prices. The daily chart, while still bearish, also shows RSI at 26.73 and Stochastic at 22.76/%K, suggesting that the longer-term trend might also be approaching a point where a significant correction is due, even if not a full trend reversal. The question is not IF a bounce will occur, but WHEN and how strong it will be.
Potential for a Technical Bounce at Key Support
The Nasdaq100 is currently hovering around the $23,092.50 level, which is close to several key support areas identified on the shorter timeframes. The 1-hour support at $23,061.21 and the 4-hour support at $23,087.54 are critical immediate levels. A successful defense of these zones could initiate a technical bounce. If buyers step in decisively around these prices, we might see a move back towards the $23,150.20 to $23,200 range. Such a bounce would be a function of short-covering and opportunistic buying in an oversold market, rather than a fundamental shift in the underlying trend. The daily support at $23,150.20 is also a significant psychological level. A failure to hold these immediate supports, however, would invalidate this bullish short-term thesis and likely lead to a cascade of selling as stops are triggered, pushing the index towards the next major support at $22,736.12. The current price action is a tug-of-war between the strong downtrend and the oversold indicators.
Shift in Market Sentiment or Fed Pivot?
For a sustained bullish case to emerge, a significant shift in market sentiment or a change in the Federal Reserve's policy stance would be required. Currently, the dominant narrative is one of caution, driven by inflation concerns and the specter of higher-for-longer interest rates. However, markets can be forward-looking. If upcoming economic data begins to show a more decisive cooling of inflation, or if Fed officials start signaling a more dovish tone, it could trigger a rapid reassessment of risk appetite. This would likely be accompanied by a weakening of the DXY (currently 99.91) and a recovery in riskier assets like the Nasdaq100. The strong performance of commodities like Brent crude ($110.64) and WTI ($101.19) suggests that inflationary pressures might still be a concern, making a Fed pivot less likely in the immediate term. However, unexpected developments or a sharper-than-anticipated economic slowdown could force the Fed's hand. The market is always looking for the next catalyst, and a data-driven pivot from the Fed remains the most potent bullish scenario, even if it seems distant now.
Trade Scenarios: Navigating the Nasdaq100's Crossroads
Bearish Scenario: Continued Descent
65% ProbabilityNeutral Scenario: Consolidation and Choppy Action
25% ProbabilityBullish Scenario: Short-Term Bounce
10% ProbabilityNavigating the Current Market Environment
The current market environment for the Nasdaq100 is one of extreme caution. The strong bearish trends across multiple timeframes, evidenced by ADX readings well above 30 on the daily and 1-hour charts, suggest that traders should exercise patience and wait for clearer signals. The oversold conditions on RSI and Stochastic oscillators present a potential opportunity for a short-term bounce, but the underlying trend strength makes this a high-risk proposition for longs. For bearish traders, the immediate trigger for further downside lies below the $23,061.21 support level. A decisive break here could open the door to significant further losses, targeting $22,736.12. The correlation with the broader market indices, S&P 500 at 6357.55 and Dow Jones at 45077.50, and the strength of the DXY at 99.91, all reinforce the risk-off sentiment. Any significant shift in macroeconomic data, particularly inflation figures or Fed commentary, could be the catalyst for a change in direction, but until then, the path of least resistance appears to be lower.
Key Levels to Watch for Nasdaq100
| Indicator | Value | Signal | Interpretation |
|---|---|---|---|
| RSI (14) | 26.73 | Oversold | Deeply oversold on daily chart, suggesting potential for bounce but trend remains bearish. |
| MACD Histogram | -15.20 | Negative | Strong negative momentum on 1H, 4H and daily charts indicates persistent selling pressure. |
| Stochastic (%K, %D) | 22.76 / 30.56 | Bearish | Deeply oversold on daily, but %K below %D confirms bearish bias. |
| ADX | 47.68 | Strong Trend | Extremely strong downtrend on daily chart (47.68), indicating significant directional conviction. |
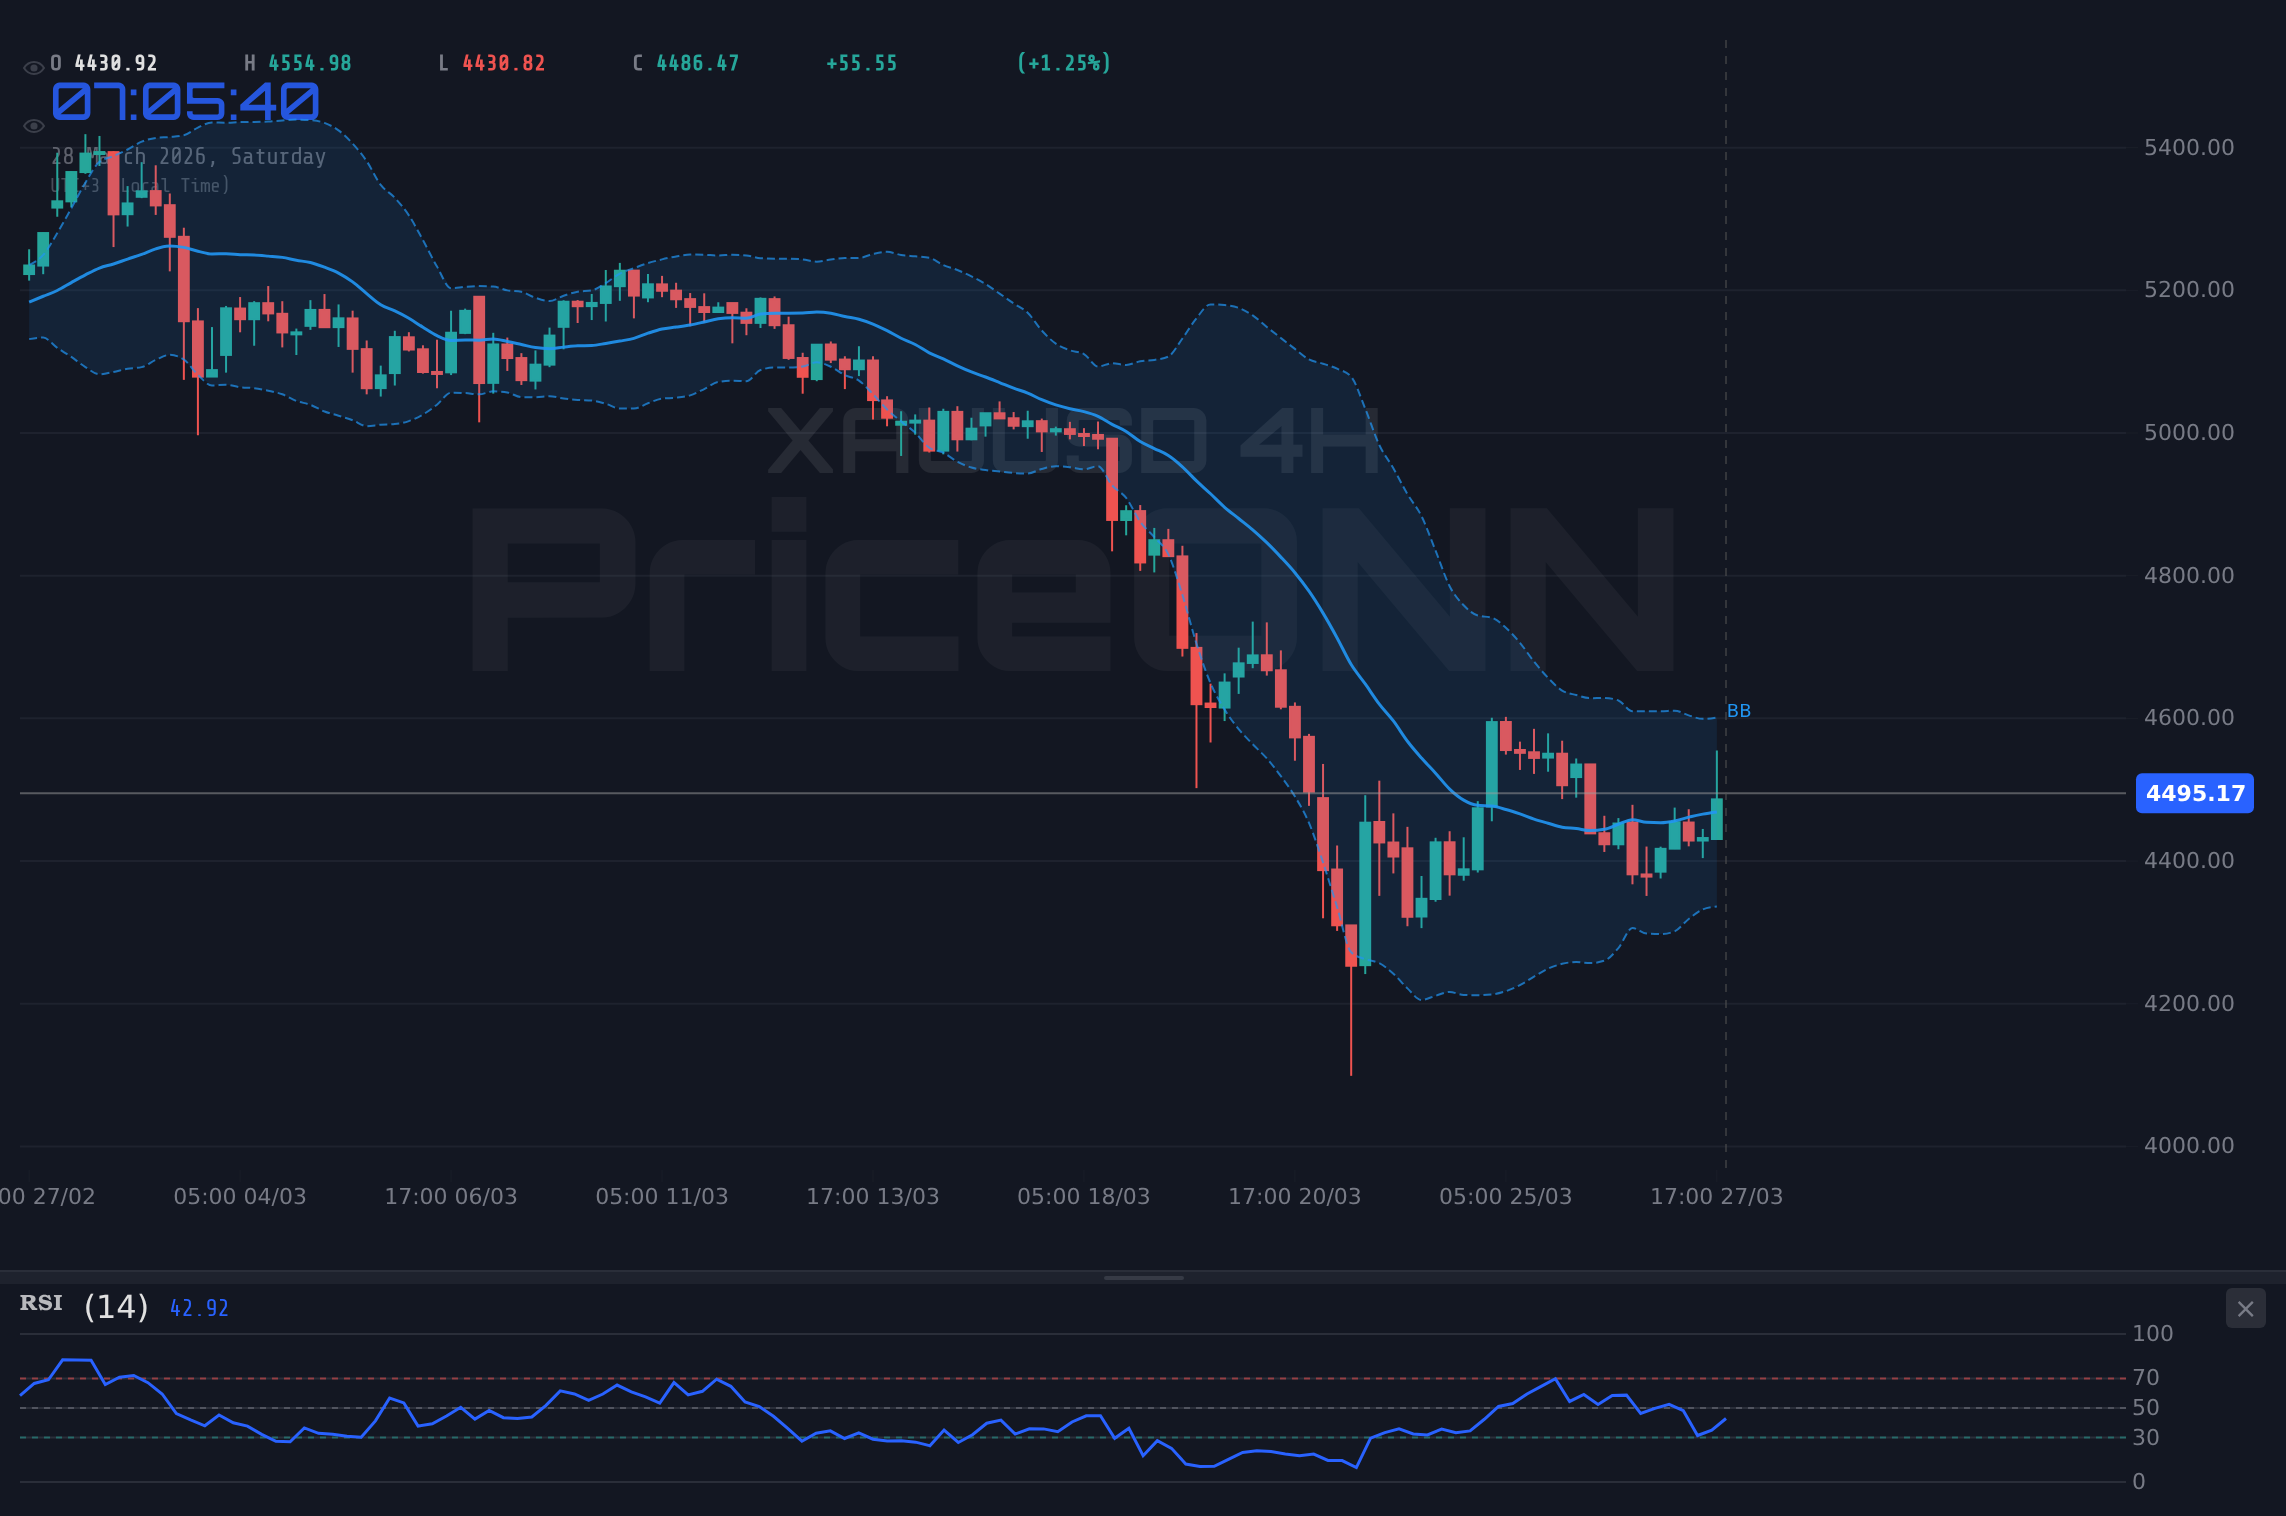
| Bollinger Bands | Middle Band | Below | Price consistently trading below the middle band on daily chart, confirming bearish trend. |
Frequently Asked Questions: Nasdaq100 Analysis
What happens if Nasdaq100 breaks below the $23,061.21 support level?
A close below $23,061.21 would invalidate any short-term bullish thesis and likely accelerate selling pressure. The next significant support to watch would be $22,938.67, with a more critical level at $22,736.12 on the daily chart. This would signal a continuation of the strong downtrend.
Should I consider buying Nasdaq100 at current levels near $23,092.50 given the oversold RSI?
While the RSI at 26.73 on the daily chart is deeply oversold, indicating potential for a bounce, the strong bearish trend (ADX 47.68) suggests caution. A high-probability entry would require confirmation, such as holding above $23,061.21 and seeing a bullish MACD crossover on the 4H chart. Without confirmation, buying here carries significant risk.
Is the RSI at 20.41 on the 1H chart a sell signal for Nasdaq100 right now?
An RSI of 20.41 on the 1-hour chart is an extreme oversold reading, typically signaling that the immediate selling momentum may be exhausted. However, in a strong downtrend, RSI can remain oversold for extended periods. It's more of a contrarian indicator suggesting a potential short-term bounce rather than a direct sell signal.
How will the upcoming economic data releases affect Nasdaq100 this week, especially given the DXY strength?
Upcoming economic data, particularly any hints on inflation or Fed policy shifts, will be crucial. If data suggests persistent inflation, the DXY (currently 99.91) may continue to strengthen, pressuring the Nasdaq100. Conversely, signs of cooling inflation could weaken the dollar and support a Nasdaq100 recovery, especially if it signals a potential Fed pivot. Traders will be scrutinizing all releases for policy implications.
The Nasdaq100 finds itself at a critical juncture, trading around $23,092.50 after a significant weekly decline. The technical indicators, particularly on the daily chart with an ADX of 47.68, overwhelmingly point towards continued bearish pressure. However, the extreme oversold readings on RSI and Stochastic oscillators on shorter timeframes suggest that a technical bounce is plausible, though its sustainability remains questionable given the strong downtrend. The broader market weakness, coupled with a strengthening DXY at 99.91, reinforces the risk-off sentiment. For traders, the next week will be about watching key support levels like $23,061.21 and $22,736.12. A decisive break below these could signal further downside, while a sustained hold and subsequent move above resistance levels like $23,481.69 might hint at a short-term relief rally. Ultimately, the path forward will likely be dictated by macroeconomic data and any shifts in central bank policy expectations.
Track markets in real-time
AI-powered analysis, technical indicators and real-time price data.
Join Our Telegram Channel
Breaking market news, AI analysis and trading signals instantly.
Join Channel