DXY Holds $99.91: Technical Outlook for Next Week Amidst Middle East Tensions
The US Dollar Index (DXY) is consolidating around $99.91. Analyzing key levels and indicators for next week's trading.
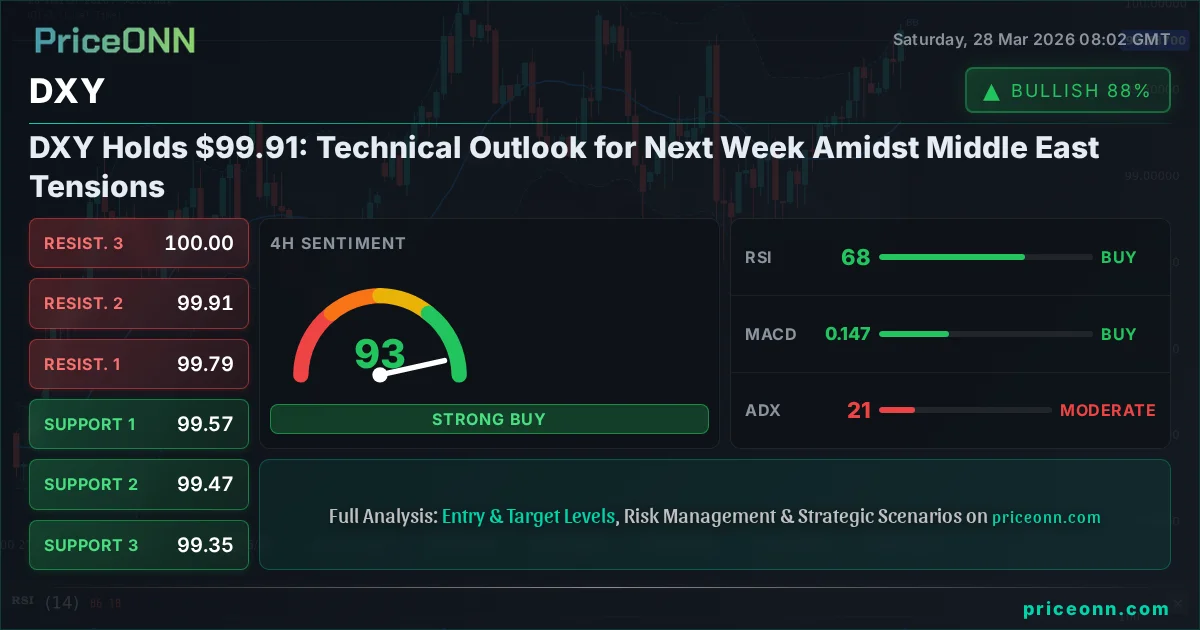
The US Dollar Index (DXY) is currently trading at $99.91, a critical juncture that warrants close attention as we transition into the next trading week. Last Friday's market close saw the DXY hovering around this pivotal level, a point of consolidation after a period of notable volatility. This consolidation occurs against a backdrop of escalating geopolitical tensions in the Middle East, which have historically provided a supportive environment for the dollar as a safe-haven asset. However, the technical indicators present a mixed picture, suggesting that the immediate direction may hinge on further developments both in global flashpoints and within the US economic landscape itself. Traders are closely watching for any signs of a decisive breakout or breakdown from this narrow range.
- The DXY is consolidating around $99.91, with the 1-day RSI at 61.71 indicating a neutral-to-bullish bias, but showing signs of slowing momentum.
- Critical support for the DXY is identified at $99.31, while immediate resistance looms at $99.76; a decisive break above this level could signal further upside.
- The MACD histogram remains positive on the daily chart, but its proximity to the signal line suggests waning bullish momentum, requiring confirmation from other indicators.
- Geopolitical tensions in the Middle East and Fed rate expectations are the primary macro drivers influencing the DXY's correlation with risk assets and gold prices.
The past week has been characterized by significant price action across global markets, with the DXY playing a central role in shaping currency pair movements. The index's ability to hold the $99.91 level, a psychologically important round number, is a testament to its resilience, even as broader risk sentiment wavered. This consolidation above a key support level suggests that while caution prevails, the bulls have not yet relinquished control. The fact that the DXY has managed to stay above the $99.31 support level, a price point that has seen previous tests, reinforces this view. However, the upward momentum appears to be stalling, as evidenced by the RSI(14) on the daily chart, which, while still in bullish territory, is hovering around 61.71 and showing signs of flattening. This suggests that the current uptrend might be losing steam without further fundamental catalysts.
On the 4-hour timeframe, the trend is clearly identified as bullish with a power strength of 95%, supported by an ADX reading of 20.81, indicating a moderately strong trend. The RSI here is at 67.59, still within the neutral zone but approaching overbought territory, which could signal a pause or pullback. The MACD is also showing positive momentum, with the MACD line above the signal line, reinforcing the bullish short-to-medium term outlook. However, the Stochastic indicator is in the overbought zone (K=88.7, D=82.07), flashing a potential warning sign for an imminent pullback or consolidation. This divergence between the MACD and Stochastic on the 4-hour chart highlights the choppy nature of the current move and the need for caution.
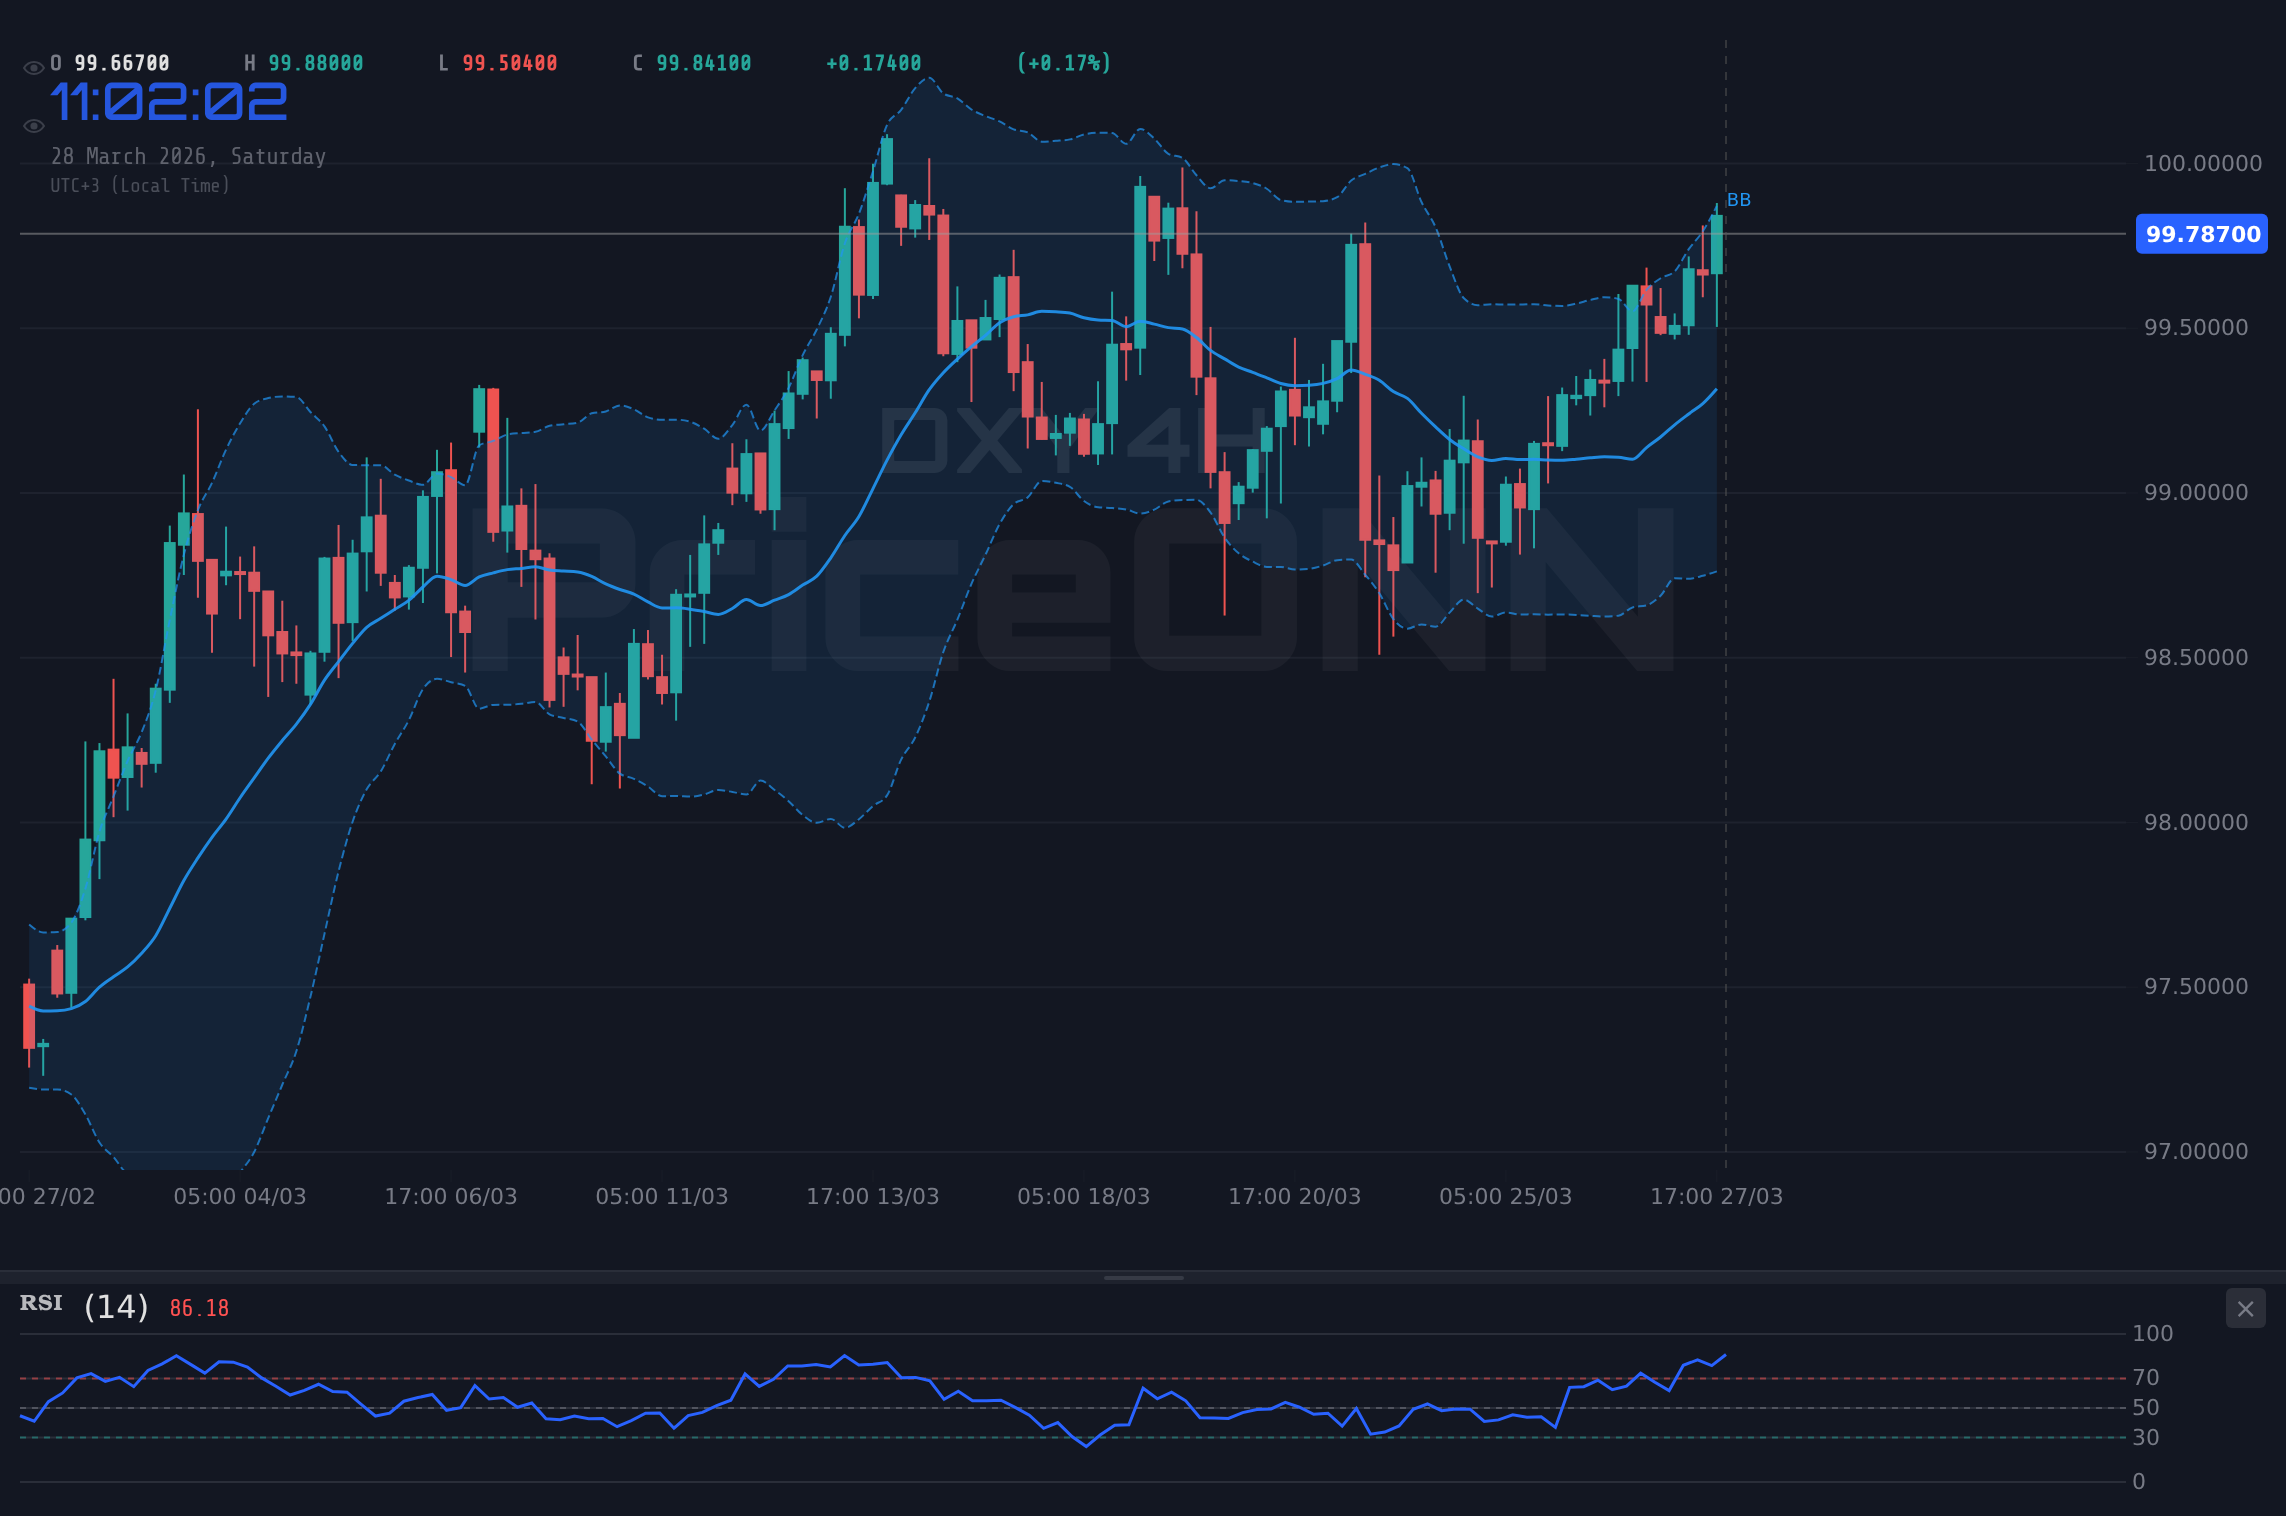
Digging deeper into the hourly chart, the trend is classified as neutral with a power strength of only 50%. This suggests a lack of strong directional conviction in the very short term. The RSI(14) here is at 69.84, very close to the overbought threshold, and the Stochastic is even more extreme at K=90.81, D=72.47, clearly indicating overbought conditions. This hourly overbought reading, coupled with the neutral trend strength, points towards a potential for a short-term pullback or sideways movement in the coming hours, even as the longer-term daily and 4-hour charts maintain a bullish bias. This divergence across timeframes is precisely where traders must exercise discipline and wait for clearer signals.
The Geopolitical Undercurrent: A Safe Haven Bid?
The persistent geopolitical instability in the Middle East continues to be a significant tailwind for the US Dollar. News reports from Friday indicated escalating tensions, with gold prices surging past $4,500 as Iran declared control over the Strait of Hormuz. Such events typically increase global risk aversion, prompting a flight to safety. Historically, the DXY benefits from such risk-off sentiment, as investors seek the perceived security of US Treasury markets and dollar-denominated assets. This dynamic suggests that any further flare-ups in the region could provide additional support for the dollar, potentially pushing the DXY towards higher resistance levels. The correlation between rising oil prices - a direct consequence of Middle East instability - and the DXY's strength is a key factor to monitor.
Furthermore, the recent market action has seen a notable divergence in correlations. While traditionally gold has an inverse relationship with the DXY, the current environment sees both rising, albeit at different paces. This suggests that the primary driver is likely a broader market fear and a demand for perceived safe havens, rather than a direct monetary policy divergence. The fact that oil prices are also rallying sharply, touching levels not seen in months, adds another layer of complexity. High oil prices can fuel inflation expectations, which in turn can influence central bank policy, creating a feedback loop that impacts currency valuations across the board. For the DXY, this inflationary pressure, if persistent, could eventually lead to expectations of tighter monetary policy from the Federal Reserve, further bolstering the dollar.
The economic calendar for the upcoming week, while not packed with mega-events early on, does hold some crucial releases that could sway market sentiment. The UK's GDP data on Monday, followed by US inflation figures later in the week, will be key. A stronger-than-expected GDP reading for the UK could provide some relief for GBPUSD, potentially causing a minor dip in the DXY if it signals a more resilient global economy. Conversely, any signs of persistent inflation in the US could reignite Fed tightening expectations, offering a significant boost to the DXY. The previous US inflation print was 6.926%, significantly higher than the forecast of -1.3%, underscoring the sensitivity of the market to these figures. Any deviation from expectations in the upcoming releases could trigger substantial volatility.
Technical Levels to Watch: The $99.91 Battleground
The current price of $99.91 sits at a crucial confluence of short-term resistance and a level that has acted as both support and resistance in recent trading sessions. On the daily chart, the immediate resistance is identified at $99.76, followed by $99.95 and then the significant psychological level around $100. A sustained move above $99.95 would be a strong bullish signal, suggesting a potential retest of the $100.21 level. Conversely, immediate support is found at $99.31, then $99.05, and further down at $98.86. The ability of the DXY to hold above the $99.31 support level has been a key factor in maintaining its bullish posture over the past week. A break below $99.05, however, would likely invalidate the short-term bullish outlook and open the door for a deeper correction.
Looking at the technical indicators, the ADX on the daily chart stands at 31.98, confirming a strong existing trend. This suggests that any move initiated from the current consolidation phase is likely to carry significant momentum. However, the RSI at 61.71 is neither oversold nor overbought, but its trajectory is important. A sustained move higher, pushing RSI towards 70, would confirm bullish continuation, while a dip below 50 would signal a shift in momentum. The MACD on the daily chart is positive, with the MACD line above the signal line, but the histogram has been narrowing, indicating that the bullish momentum might be decelerating. This is a classic sign of consolidation before a potential next leg up or a reversal.
The divergence across different timeframes is a crucial aspect of the current DXY setup. While the daily and 4-hour charts lean bullish, the hourly chart shows signs of overbought conditions and a neutral trend. This suggests that short-term traders might be looking to book profits or take short positions, potentially causing some choppy price action around the $99.91 mark in the immediate term. However, for the broader trend to reverse, a significant catalyst would be required, such as a de-escalation of Middle East tensions or a dovish shift in Fed expectations. Until then, the path of least resistance, according to the higher timeframes, appears to be to the upside, albeit with potential for pullbacks.
Correlations and Market Sentiment
The DXY's movement is inextricably linked to global risk sentiment and commodity prices. The current surge in Brent crude to $110.64 and WTI to $101.19, driven by Middle East instability, is a significant factor. Higher oil prices contribute to inflation concerns, which can complicate the Federal Reserve's monetary policy decisions. If the Fed is forced to maintain a hawkish stance for longer due to sustained inflation, it would typically support the DXY. Conversely, if inflation proves to be transitory or if the Fed signals a pivot, the dollar could weaken, even amidst geopolitical uncertainty.
The performance of major equity indices like the S&P 500 (currently at 6357.55) and Nasdaq 100 (at 23092.5) also provides context. Both indices have experienced significant daily drops, indicating a risk-off sentiment in the equity markets. This decline in risk appetite often correlates with a strengthening dollar, as capital flows into perceived safe-haven assets. The fact that both indices are showing strong downward trends on the daily charts (ADX readings above 45) reinforces this correlation. If this trend continues, it would add further pressure on riskier currencies and provide a tailwind for the DXY.
Bitcoin (BTCUSD at $66,534) and Ethereum (ETHUSD at $2,005.3) are also experiencing complex dynamics. While cryptocurrencies have often been seen as a risk-on asset, their correlation with the DXY and broader market sentiment can fluctuate. Currently, both BTCUSD and ETHUSD show signs of weakness on longer timeframes, with bearish trends and oversold conditions on the 4-hour charts. This suggests that the current risk-off environment might also be impacting the crypto market, potentially leading to further outflows and indirectly supporting the DXY as investors seek stability elsewhere.
Trading Scenarios for the DXY
Bullish Scenario: Breaking Out Higher
45% ProbabilityNeutral Scenario: Range-Bound Consolidation
35% ProbabilityBearish Scenario: Re-test of Lower Support
20% ProbabilityThe probabilities assigned to these scenarios reflect the current technical confluence. The bullish scenario is favored due to the higher timeframe trends, but the hourly overbought conditions and neutral trend strength introduce significant probability for consolidation. The bearish scenario gains traction if key support levels fail, potentially driven by a de-escalation of geopolitical fears or a shift in Fed policy expectations. Each scenario hinges on specific price action and confirms the importance of watching the $99.91 level as a pivot point.
What the Indicators Are Telling Us
On the daily chart, the RSI at 61.71 suggests underlying bullish strength, but it's not in extreme territory, leaving room for further upside. However, the narrowing MACD histogram is a cautionary signal, indicating that the upward momentum that drove the DXY to these levels might be waning. This is a common pattern during consolidation phases, where the market digests recent gains and awaits fresh catalysts. The ADX at 31.98 confirms a strong trend, but it doesn't specify direction; it merely quantifies the strength of the current move. Therefore, while the trend is strong, its continuation depends on whether the bulls can overcome the immediate resistance levels.
The hourly indicators paint a different, more cautionary picture. The RSI is hovering near 70, suggesting overbought conditions in the very short term, and the Stochastic oscillator is deeply in overbought territory (K=90.81, D=72.47). This suggests that any immediate upward push might be met with profit-taking, potentially leading to a minor pullback. The neutral trend strength (ADX 22.17) on this timeframe further supports the idea of a potential pause or sideways movement. This conflict between higher timeframe bullishness and shorter timeframe overbought signals is typical of consolidation periods and requires traders to be patient, waiting for confirmation before committing to a position.
The interplay between these indicators and price action is crucial. A bullish scenario would be confirmed if the DXY breaks decisively above $99.95, with RSI pushing towards 70 and MACD continuing to show positive momentum without significant divergence. Conversely, a bearish outlook would be signaled by a close below $99.05, potentially accompanied by RSI falling below 50 and MACD crossing its signal line to the downside. The neutral scenario remains plausible as long as the DXY oscillates within the $99.05-$99.95 range, with traders looking for increased volume on breakouts or breakdowns.
| Indicator | Value | Signal | Interpretation |
|---|---|---|---|
| RSI (14) | 61.71 | Bullish | Neutral zone, uptrend support |
| MACD Histogram | +0.15 | Bullish | Positive momentum, narrowing |
| Stochastic (%K/%D) | 90.81/72.47 | Overbought | Short-term pullback likely |
| ADX | 31.98 | Strong Trend | Confirms trend strength, not direction |
| Bollinger Bands | Middle Band | Watch | Price above middle band, bullish bias |
Economic Calendar Watchlist
As we look ahead to the coming week, several economic events will be critical for shaping the DXY's trajectory. The UK's GDP figures, due on Monday, will provide insight into the health of the British economy. A surprisingly strong reading could offer some respite to GBPUSD, potentially causing a minor pullback in the DXY. However, the main focus will likely remain on US economic data. The upcoming inflation figures are particularly important. Given the previous actual reading of 6.926% against a forecast of -1.3%, any indication of persistently high inflation could bolster expectations of a hawkish Federal Reserve. This would likely translate into further strength for the DXY, especially if other risk assets continue to underperform.
The market's reaction to these data points will be crucial. If US inflation comes in hotter than expected, it could reinforce the narrative that the Fed needs to remain vigilant or even consider further tightening, despite current economic conditions. This would support the bullish scenarios for the DXY, potentially pushing it towards the $100.21 resistance level and beyond. Conversely, a cooler inflation reading might lead markets to price in earlier rate cuts, which could weaken the dollar, even if geopolitical tensions remain elevated. The interplay between inflation data, Fed expectations, and geopolitical risk will be the dominant theme for the DXY in the coming week.
The current market environment is one where correlations are shifting, and traditional safe-haven dynamics are being tested. The simultaneous rise of the DXY, gold, and oil prices suggests a broader market sentiment driven by fear and inflation concerns, rather than solely by monetary policy expectations. This complex interplay means that traders must remain agile and pay close attention to how different asset classes react to geopolitical news and economic data. The DXY's ability to hold $99.91 is a significant technical signal, but its future direction will ultimately be determined by the confluence of these macro factors and their impact on market psychology.
Frequently Asked Questions: DXY Analysis
What happens if DXY breaks decisively above the $99.95 resistance level?
A sustained daily close above $99.95, supported by strong volume, would likely trigger a bullish scenario. This could see the DXY target $100.21, a previous high, with further upside potential towards $100.50 as traders price in continued dollar strength amid geopolitical concerns and hawkish Fed expectations.
Should I consider buying DXY at current levels around $99.91 given the mixed hourly signals?
Caution is advised at current levels due to conflicting signals across timeframes. While daily charts lean bullish, hourly indicators show overbought conditions. A more prudent approach would be to wait for a clear breakout above $99.95 or a confirmed test and hold of support around $99.05 before considering entry, managing risk tightly.
Is the RSI at 61.71 a sell signal for DXY right now?
An RSI of 61.71 on the daily chart is not a direct sell signal; it indicates bullish momentum is still present but potentially slowing. It suggests that the market is not yet overbought, but further gains might be met with resistance. Confirmation from other indicators or price action is needed before considering it a sell signal.
How will upcoming US inflation data impact DXY this week, given the $99.91 consolidation?
Hotter-than-expected US inflation data, especially following the previous 6.926% actual reading, could significantly boost the DXY towards $100.21 and beyond by reinforcing Fed tightening expectations. Conversely, cooler data might trigger a pullback to $99.05 as markets price in earlier rate cuts, despite ongoing geopolitical risks.
The DXY's current position at $99.91 represents a critical juncture, shaped by a complex interplay of geopolitical anxieties, inflation concerns, and shifting central bank expectations. While the longer-term technicals suggest a bullish bias, the short-term indicators and consolidation pattern call for patience. The key will be how price action unfolds around the $99.95 resistance and $99.05 support levels in the coming days. Traders should remain vigilant, monitor correlations with risk assets and commodities, and await clear signals before committing to significant positions. The market is currently in a state of heightened sensitivity, where both geopolitical events and economic data releases can trigger rapid and substantial price movements.
Track markets in real-time
AI-powered analysis, technical indicators and real-time price data.
Join Our Telegram Channel
Breaking market news, AI analysis and trading signals instantly.
Join Channel