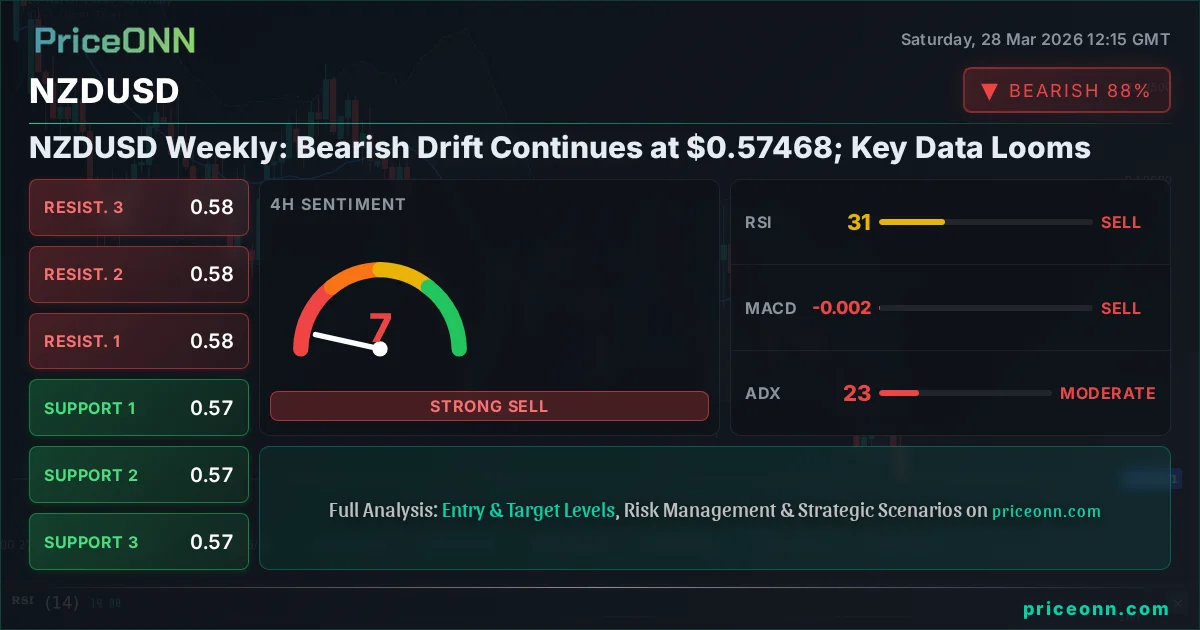
NZDUSD Weekly: Bearish Drift Continues at $0.57468; Key Data Looms
NZDUSD struggles below $0.57468 as geopolitical tensions and a strong USD weigh. Technicals show bearish leanings, but upcoming data could shift sentiment. Discover key levels and scenarios.
The currency pair NZDUSD is currently trading at $0.57468, reflecting a persistent bearish drift that has characterized its performance over the past week. This downward trajectory is largely influenced by a confluence of factors, including escalating geopolitical tensions in the Middle East, which typically bolster safe-haven assets like the US Dollar, and a generally risk-averse market sentiment. As traders digest last week's developments and brace for upcoming economic data, the question on many minds is whether the current bearish momentum will continue or if a rebound is on the horizon. This analysis delves into the technical indicators, key price levels, and potential market drivers shaping the outlook for NZDUSD.
- With RSI at 31.22 on the 4H chart, NZDUSD shows signs of being oversold, suggesting potential for a short-term bounce, though the daily trend remains bearish.
- Critical support sits at $0.57378, tested multiple times last week; a break below this level could accelerate the decline.
- The ADX at 35.24 on the daily timeframe indicates a strong downtrend, suggesting that any upward movements might be mere corrections within a larger bearish structure.
- The correlation with a strengthening DXY (currently at 99.91) is a significant headwind for NZDUSD, highlighting the dollar's dominance amidst global uncertainty.
Navigating the Crosscurrents: Last Week's Price Action
Last week proved challenging for the New Zealand Dollar against the US Dollar. The pair experienced a notable decline, driven by a potent mix of global risk aversion and specific headwinds impacting the NZD. The escalating geopolitical tensions in the Middle East, particularly concerning Iran's actions and potential disruptions to oil supplies, cast a long shadow over riskier assets. This environment naturally favors the US Dollar as a safe-haven destination, pushing the DXY index higher, which in turn exerts downward pressure on pairs like NZDUSD.
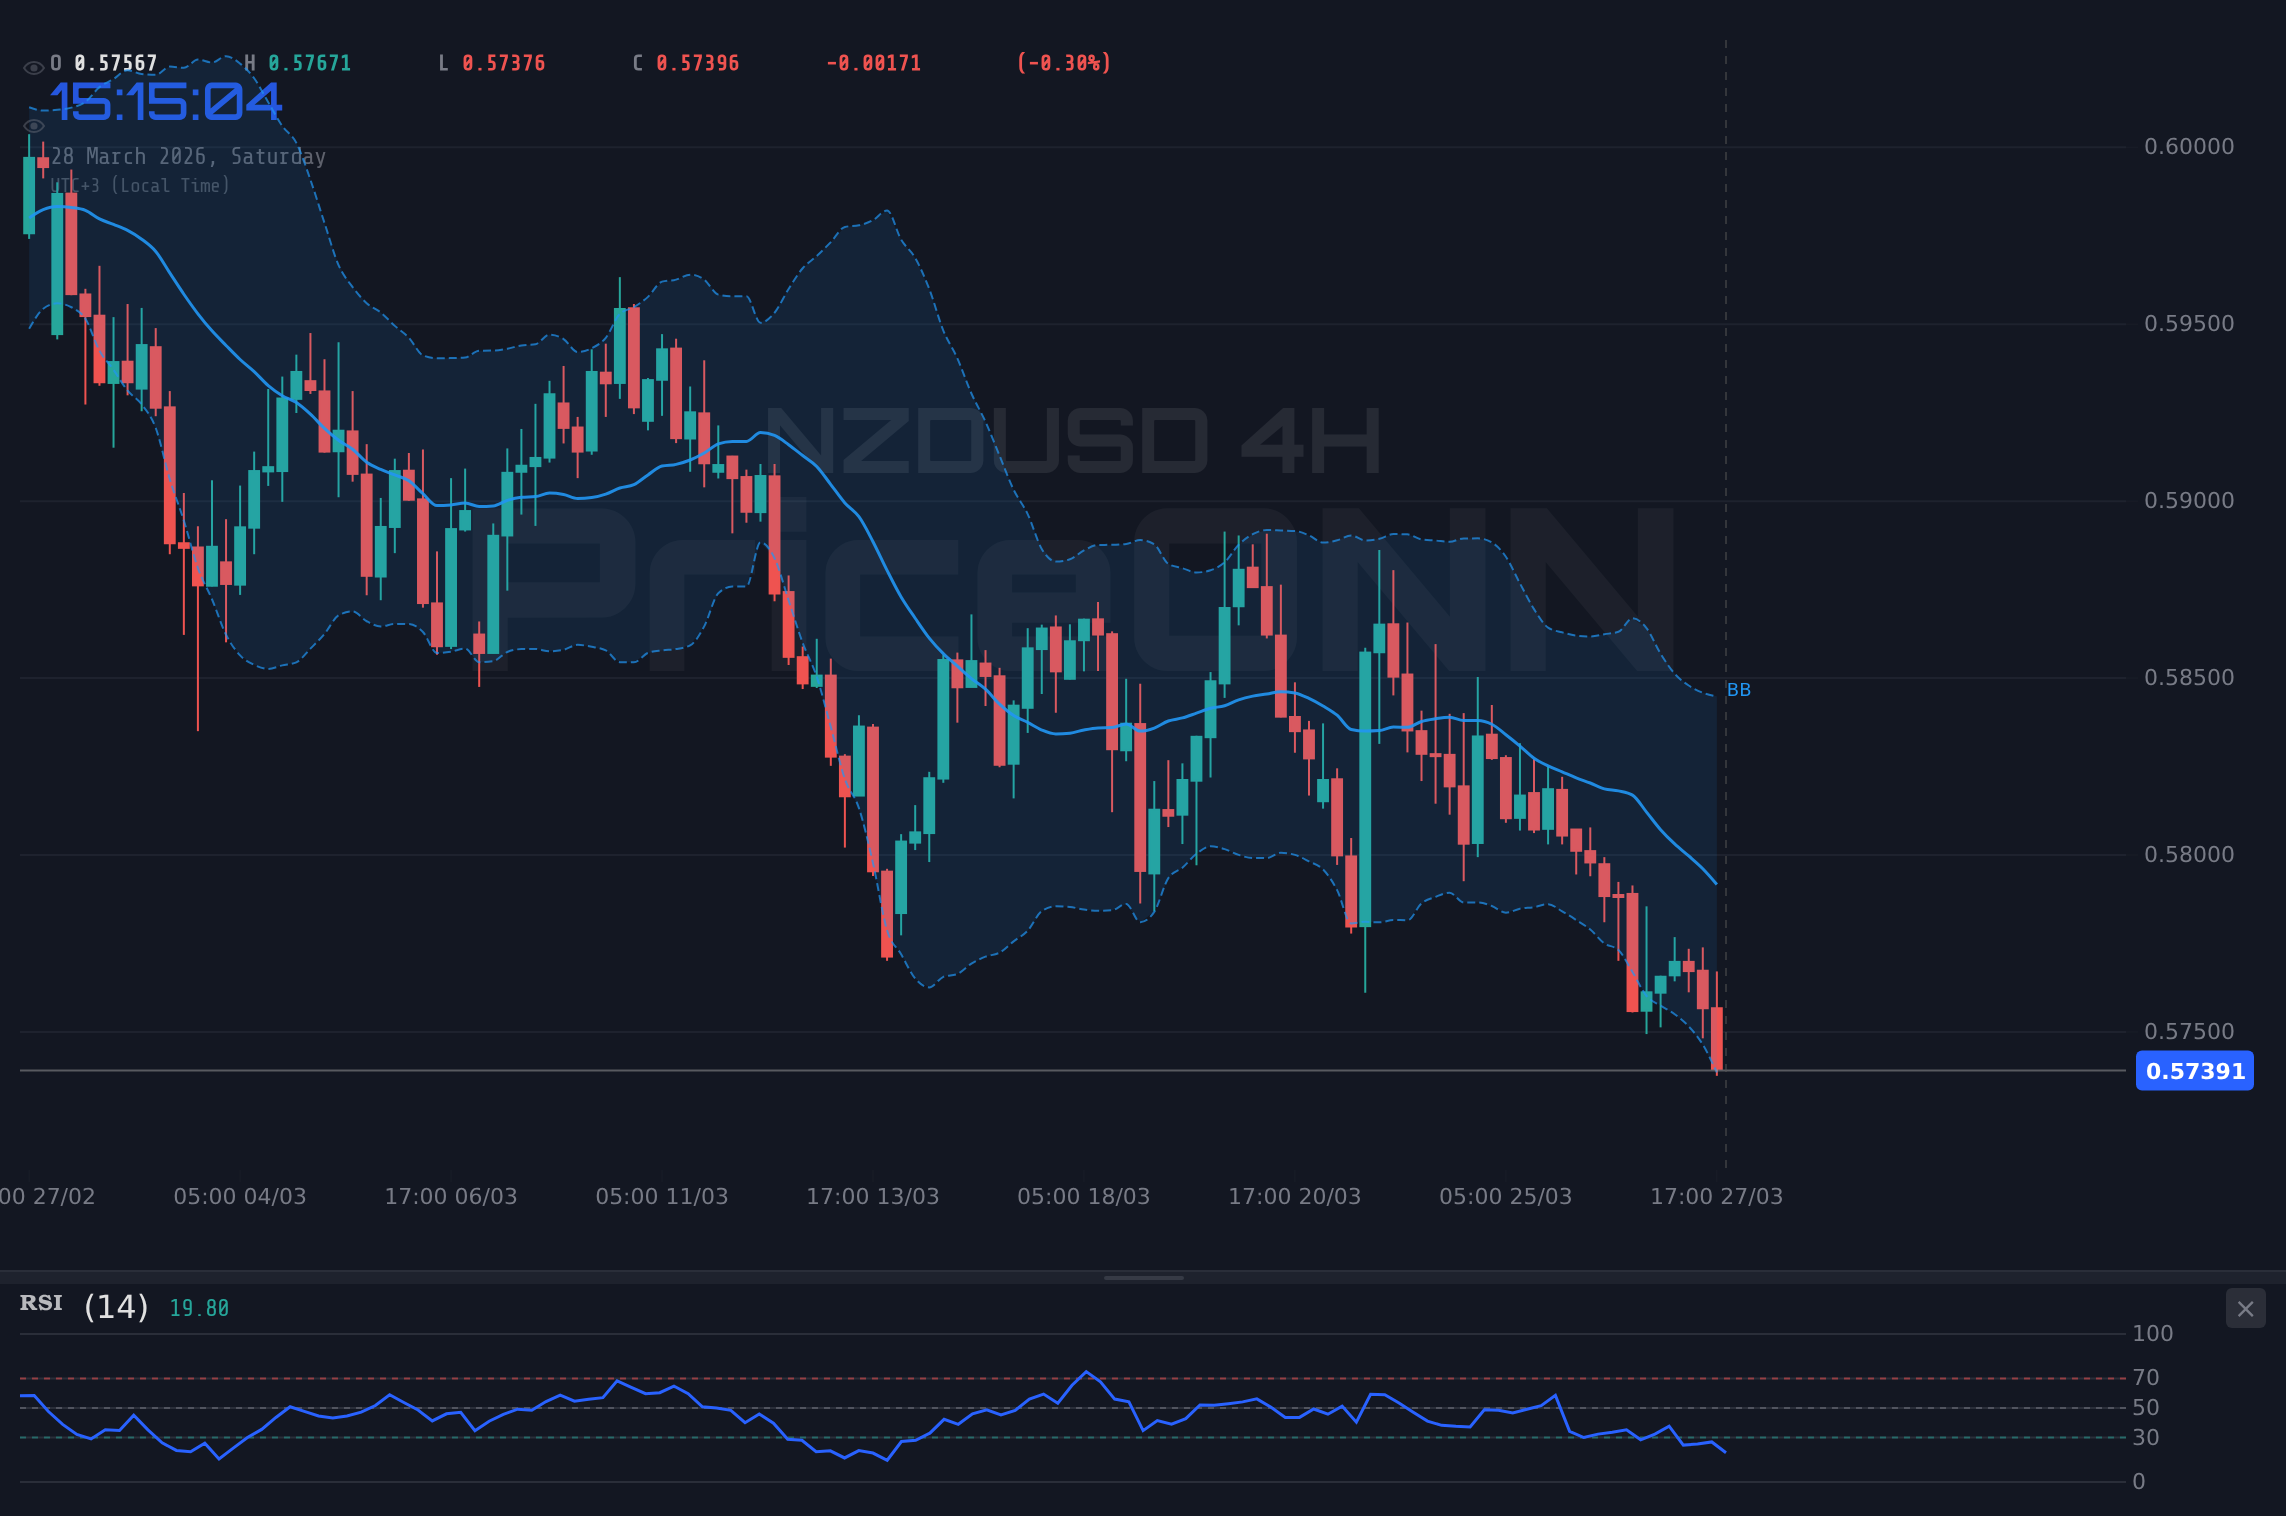
Price action on the charts mirrored this sentiment. The NZDUSD struggled to maintain levels above 0.5800, with significant selling pressure emerging as the week progressed. Several attempts to rally were met with renewed selling, indicating that the bears were firmly in control. The daily chart shows a clear downtrend, with lower highs and lower lows being printed consistently. This technical picture, combined with the macro backdrop, painted a rather bleak short-term outlook for the Kiwi dollar.
Adding to the pressure was the Fitch downgrade of New Zealand's outlook, which, while not a downgrade of the sovereign rating itself, signaled growing concerns about the nation's economic resilience. This news, circulating early in the week, likely amplified selling pressure, especially as traders reassessed the Reserve Bank of New Zealand's (RBNZ) policy path in light of potential inflation shocks from rising oil prices and persistent economic slack. The narrative began to shift, with some analysts questioning the RBNZ's ability to navigate these complex economic crosscurrents without further weakening the currency.
The Case for the Bears: Why Downside Risks Linger
The bearish case for NZDUSD is built on a foundation of strong technical signals and a challenging fundamental backdrop. On the daily timeframe, the trend is unequivocally bearish, with an ADX reading of 30.99 on the 1D chart indicating a strong trend is in place. This is further supported by the RSI(14) at 36.09, which, while not deeply oversold, shows a clear downward momentum. The MACD is also trading below its signal line with negative momentum, reinforcing the bearish sentiment.
The 4-hour chart paints an even starker picture. The trend is overwhelmingly bearish with a strength of 97%, and the RSI at 31.22 is hovering near oversold territory. However, this doesn't immediately signal a buy. Historically, oversold conditions can persist in strong downtrends, and a bounce could simply be a retracement before further declines. The ADX here is 23.09, suggesting a moderately strong trend, which aligns with the daily view. The Stochastic K line at 15.99 and D line at 19.33 also indicate oversold conditions but are in a bearish alignment (%K < %D), warning against immediate long positions.
Fundamentally, the US Dollar remains a formidable opponent. The DXY index, currently at 99.91, is showing strength, particularly on the 1D chart where the ADX is a robust 31.98. This suggests the dollar has strong upward momentum, making it difficult for risk-sensitive currencies like the NZD to gain ground. The ongoing geopolitical instability in the Middle East is a key driver for dollar strength, as investors flock to perceived safe havens. Furthermore, the recent Fitch outlook downgrade for New Zealand adds another layer of fundamental weakness, potentially impacting investor confidence and the currency's appeal.
The correlation between NZDUSD and risk appetite is also a critical factor. With major indices like the S&P 500 (6357.55) and Nasdaq 100 (23092.5) experiencing significant drops – SP500 down 2% and Nasdaq down 2.23% on the day – it signals a clear risk-off environment. This sentiment typically leads to capital flight from perceived riskier currencies and assets, benefiting the USD. Until this broader market sentiment shifts, the path of least resistance for NZDUSD appears to be downwards.
The Bullish Counter-Argument: Potential for a Rebound?
Despite the prevailing bearish sentiment, there are arguments to be made for a potential rebound in NZDUSD. One of the most compelling technical indicators suggesting this possibility is the oversold condition on shorter timeframes. On the 4-hour chart, the RSI is at 31.22 and the Stochastic is deep in oversold territory. While this doesn't guarantee a reversal, it does indicate that the selling pressure may be exhausting itself in the short term. A bounce from these levels could be triggered by a shift in market sentiment or specific data releases.
The 1-hour chart offers a slightly more mixed picture, with an RSI of 34.79 and Stochastic %K at 14.04, %D at 20.43, still pointing towards oversold conditions, albeit with a slight bearish divergence in the Stochastic (%K < %D). However, the MACD on the 1H chart shows positive momentum, suggesting that buying interest could emerge. The ADX on the 1H is 18.67, indicating a weak trend, which could mean that the current downtrend is losing steam and a period of consolidation or a short-term reversal might be possible.
From a fundamental perspective, the narrative could shift if geopolitical tensions in the Middle East de-escalate. Any signs of cooling conflict would likely reduce safe-haven demand for the US Dollar, potentially giving other currencies, including the NZD, some breathing room. Furthermore, if upcoming economic data from New Zealand surprises to the upside, or if the RBNZ adopts a more hawkish tone than anticipated, it could provide a much-needed boost to the currency. The market is sensitive to shifts in central bank policy expectations, and any indication of a more aggressive stance on inflation could strengthen the Kiwi.
Moreover, the current price of $0.57468 is approaching significant support levels. The key support on the 1D chart is at $0.57378, with further levels at $0.57144 and $0.56794. A bounce from these areas is technically plausible, especially if market participants see value in buying at these relatively lower prices after a sustained downtrend. The fact that the daily Stochastic is showing a bullish signal (%K > %D) with %K at 14.62 and %D at 34.04, despite the bearish trend, hints at a potential turning point, or at least a temporary reprieve for the bulls.
Technical Confluence: Indicators and Levels
Examining the technical indicators across different timeframes reveals a complex picture, but with a prevailing bearish bias, especially on the longer daily charts. On the 1-hour timeframe, the trend is classified as bearish with 86% strength. The RSI is at 37.27, indicating downward pressure, and the MACD histogram is negative, reinforcing this view. However, the Stochastic shows an oversold condition with %K at 19.15 and %D at 29.39, hinting at potential short-term buying interest.
The 4-hour chart reinforces the bearish trend, with 100% strength. The RSI is at 29.27, firmly in oversold territory, which could signal a pause or reversal. The MACD is negative, and the Stochastic is also oversold with %K at 15.59 and %D at 17.31. The ADX on this timeframe is 24.01, indicating a moderately strong downtrend. This suggests that while oversold conditions exist, the trend's strength might prevent a significant bullish reversal without a catalyst.
The daily perspective is crucial for understanding the broader trend. Here, the trend is neutral with 50% strength, but the overall direction is still influenced by the bearish momentum. The RSI is at 37.44, showing weakness but not extreme oversold conditions. The MACD is negative, and the Stochastic is deeply oversold with %K at 8.04 and %D at 25.87, giving a strong bearish signal. The ADX at 24.76 suggests a moderately strong downtrend, aligning with the shorter timeframes' bearish leanings.
Key price levels are pivotal in this environment. The immediate support on the daily chart is at $0.57378. A decisive break below this level would likely trigger further selling, targeting $0.57144 and then $0.56794. On the upside, resistance is initially found at $0.57453 on the 1H chart, followed by $0.5771 on the 4H chart, and then the daily resistance at $0.57962. A sustained move above these resistance levels would be required to invalidate the current bearish outlook.
Economic Calendar Watch: Data Ahead
The upcoming week is critical for NZDUSD, with several high-impact economic events on the horizon that could significantly influence the pair's direction. Investors will be closely monitoring data releases from both New Zealand and the United States. For New Zealand, the focus will be on any updates regarding inflation and economic growth, which could shape the RBNZ's future policy decisions. While specific high-impact events are not detailed in the provided calendar for the immediate upcoming days, any subtle shifts in economic data or central bank commentary will be magnified in the current risk-sensitive environment.
On the US side, the economic calendar remains packed with potentially market-moving data. While the provided data for the last 3 days and next 7 days doesn't specify upcoming high-impact events with dates, the general expectation is that US data will continue to be scrutinized for clues about the Federal Reserve's next moves. Any signs of persistent inflation or a surprisingly resilient labor market could bolster the US Dollar further, reinforcing the bearish trend for NZDUSD. Conversely, weaker-than-expected US data might offer some respite to the Kiwi.
The market's reaction to these upcoming releases will be crucial. If US data comes in stronger than forecast, the DXY could extend its gains, pushing NZDUSD lower. Conversely, any indication of cooling inflation or a softening labor market in the US might lead to a dollar pullback, potentially allowing NZDUSD to stage a recovery. Traders will be looking for confirmation of trend changes through price action and technical indicators following these data releases. The current oversold conditions on shorter timeframes make the pair sensitive to any positive news, but the strong daily bearish trend means that any positive catalyst needs to be significant to engineer a sustained reversal.
Market Sentiment and Correlations
Market sentiment remains a dominant force, heavily influenced by the ongoing geopolitical tensions in the Middle East. The fear of oil supply disruptions and potential escalation has led to a 'risk-off' environment, where investors prioritize safety. This sentiment directly benefits the US Dollar, as seen with the DXY's current strength at 99.91. The correlation between NZDUSD and the DXY is typically inverse, meaning as the DXY rises, NZDUSD tends to fall, and vice versa. Currently, this inverse relationship is playing out strongly, with the DXY's upward momentum acting as a significant headwind for the Kiwi.
The performance of major equity indices further underscores this risk-off sentiment. The significant drops in the S&P 500 (currently at 6357.55, down 2%) and the Nasdaq 100 (at 23092.5, down 2.23%) indicate widespread deleveraging and a flight to safety. This broader market weakness typically correlates with underperformance in currencies like the NZD, which are considered higher risk. The fact that Gold prices have surged past $4,500, as reported, further confirms the market's demand for safe-haven assets amidst escalating geopolitical fears, and this often comes at the expense of riskier currencies.
Interestingly, Silver (XAG/USD) has struggled to hold gains below $70, with reports suggesting that Middle East tensions paradoxically boosted the dollar, hindering silver. This highlights the complex interplay of factors. While geopolitical events often drive safe-haven demand, the immediate impact can sometimes be a strengthening dollar due to its unique global liquidity role. For NZDUSD, this means that even as gold shines, the Kiwi might continue to suffer if the dollar remains the primary beneficiary of safe-haven flows. The correlation analysis suggests that a sustained rise in DXY above the 100 level will likely keep NZDUSD under pressure, regardless of other market movements.
Bearish Scenario: Downside Momentum Continues
65% ProbabilityNeutral Scenario: Consolidation Near Support
25% ProbabilityBullish Scenario: Oversold Bounce
10% ProbabilityThe Verdict: Patience and Risk Management are Key
The technical and fundamental landscape for NZDUSD currently favors a bearish outlook, especially on the daily timeframe. The strong downtrend, evidenced by the ADX and RSI readings, coupled with the persistent strength of the US Dollar driven by geopolitical fears, suggests that downside risks remain elevated. The oversold conditions on shorter timeframes offer a glimmer of hope for a temporary bounce, but without a significant shift in macro sentiment or a strong bullish catalyst, these are likely to be short-lived corrections within a larger bearish trend.
The critical support level at $0.57378 is the immediate focal point. A break below this could accelerate the decline, aligning with the bearish scenario's targets. Conversely, if NZDUSD manages to hold this level and a de-escalation in geopolitical tensions occurs, we might see a move towards the neutral or even a weak bullish scenario. However, given the current confluence of bearish factors, the probability leans heavily towards the bears maintaining control in the near term.
For traders, this environment calls for patience and strict risk management. The current setup suggests that looking for shorting opportunities on pullbacks towards resistance levels might be a more prudent strategy than betting on a sharp reversal. Confirmation of any bullish move would require sustained price action above key resistance levels, coupled with a weakening DXY and improving risk appetite. Until then, the bearish drift at $0.57468 is the dominant narrative.
Frequently Asked Questions: NZDUSD Analysis
What happens if NZDUSD breaks below the $0.57378 support level?
A decisive break below the $0.57378 daily support level would likely trigger further selling pressure. Based on the current bearish trend and technical targets, this could lead to declines towards $0.57144, and potentially accelerate towards the $0.56794 level.
Should I consider buying NZDUSD at current levels near $0.57468 given the oversold Stochastic on the 4H chart?
While the Stochastic is oversold on the 4H chart, the daily trend remains bearish with strong ADX. A buy at these levels carries significant risk. A more prudent approach might be to wait for confirmation, such as a bounce from support with increasing volume or a break above short-term resistance, before considering long positions.
Is the RSI at 31.22 on the 4H chart a strong sell signal for NZDUSD?
An RSI of 31.22 on the 4-hour chart indicates that NZDUSD is in oversold territory. While this can sometimes precede a bounce, it is not a direct sell signal. In a strong downtrend, RSI can remain oversold for extended periods. The overall trend and other indicators should be considered alongside the RSI reading.
How will the ongoing Middle East tensions and a strong DXY potentially affect NZDUSD next week?
Continued geopolitical tensions are likely to sustain the strength of the US Dollar (DXY), which is currently at 99.91. This inverse correlation means that a strong DXY will continue to put downward pressure on NZDUSD, potentially pushing it towards the lower support levels if the risk-off sentiment persists.
| Indicator | Value | Signal | Interpretation |
|---|---|---|---|
| RSI (14) Daily | 37.44 | Bearish | Downward momentum, not yet oversold |
| MACD Histogram Daily | - | Bearish | Negative momentum, below signal line |
| Stochastic Daily | K: 8.04, D: 25.87 | Bearish | Deeply oversold, but bearish alignment |
| ADX Daily | 24.76 | Bullish Trend | Moderately strong downtrend |
| Trend 1H | Bearish (86%) | Bearish | Short-term trend aligns with daily bias |
| Trend 4H | Bearish (97%) | Bearish | Strong bearish trend on medium-term |
Track markets in real-time
AI-powered analysis, technical indicators and real-time price data.
Join Our Telegram Channel
Breaking market news, AI analysis and trading signals instantly.
Join Channel