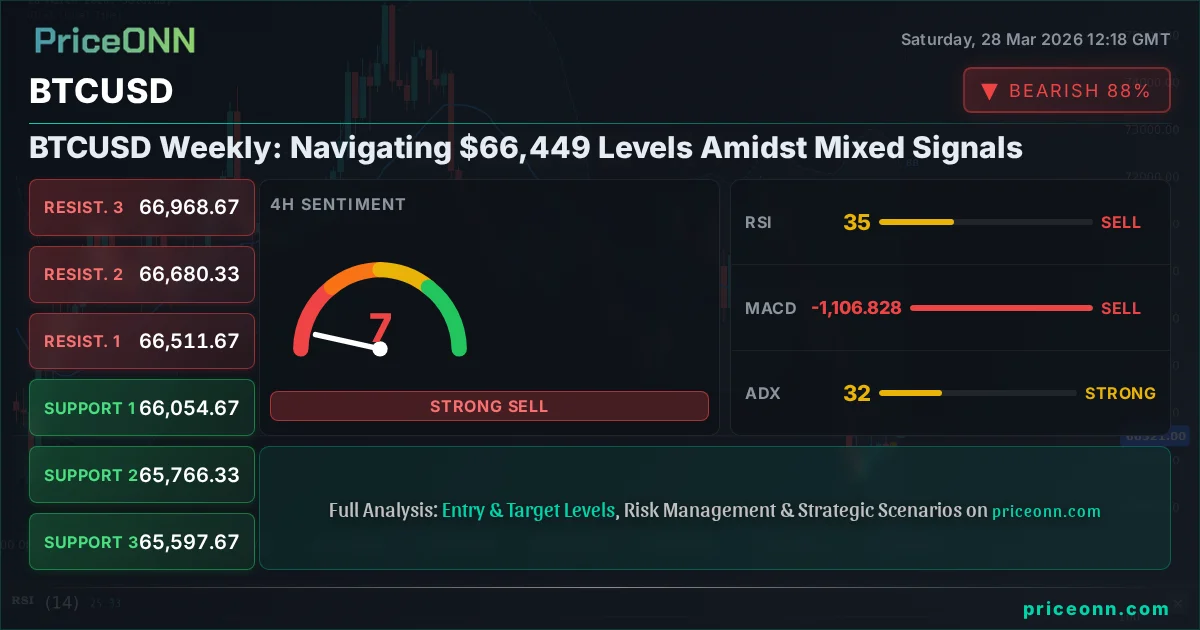
BTCUSD Weekly: Navigating $66,449 Levels Amidst Mixed Signals
BTCUSD holds near $66,449 as mixed signals emerge. Technical indicators show divergence, while geopolitical events add uncertainty. Analysis of key levels and scenarios.
The past week has been a period of careful observation for Bitcoin (BTCUSD), currently hovering around the critical $66,449 mark. While the digital asset has shown resilience, consolidating its position after recent volatility, the technical indicators present a complex picture, demanding a nuanced approach from traders. Geopolitical undercurrents and shifting macroeconomic expectations are also playing a significant role, adding layers of complexity to the already intricate landscape of the cryptocurrency market. This analysis delves into the key technical levels, indicator readings, and market drivers that are shaping BTCUSD's trajectory as we head into the next trading week, aiming to provide clarity amidst the noise.
- RSI at 41.2 signals a cautious approach, indicating neither extreme overbought nor oversold conditions.
- Critical support sits at $61,078, a level BTCUSD has tested but not decisively broken below in the past month.
- MACD histogram shows negative momentum, suggesting fading bullish sentiment or increasing bearish pressure.
- Geopolitical tensions in the Middle East and evolving Fed rate expectations are influencing BTCUSD's correlation with traditional risk assets.
This week's price action for BTCUSD can best be described as a cautious consolidation. After experiencing significant fluctuations, the cryptocurrency found itself trading in a relatively tight range, primarily between the $65,808 and $66,672 levels on the hourly chart. This period of equilibrium, however, is fragile. The daily chart paints a slightly different picture, with the price action suggesting a neutral trend but with underlying bearish momentum as indicated by the MACD histogram. The strength of this trend is currently moderate, as shown by the ADX at 17.3 on the daily timeframe, implying that the market is not yet committed to a strong directional move. This neutral stance on the daily chart, contrasted with the bearish signals from short-term indicators like the MACD histogram, creates a tug-of-war that traders must carefully navigate. The key question remains: will this consolidation lead to a decisive breakout, or will the underlying bearish momentum eventually prevail?
Delving deeper into the technical indicators, the Relative Strength Index (RSI) on the daily chart stands at 41.2. This reading firmly places BTCUSD in the neutral zone, far from the overbought territory (typically above 70) or oversold territory (typically below 30). While this suggests that neither buyers nor sellers have overwhelming control, the slight downward inclination of the RSI hints at a potential for further downside pressure if selling intensifies. The MACD (Moving Average Convergence Divergence) on the daily chart is also worth noting. The histogram, which represents the difference between the MACD line and its signal line, is currently negative. This indicates that the momentum is leaning towards the bearish side, suggesting that recent price action might be driven by selling pressure rather than strong buying conviction. The fact that the MACD line is below its signal line further reinforces this bearish short-term outlook. However, the ADX (Average Directional Index) at 17.3 on the daily chart suggests that the trend, while potentially bearish, lacks significant strength. This implies that the current downward momentum might not be sustained unless new catalysts emerge.
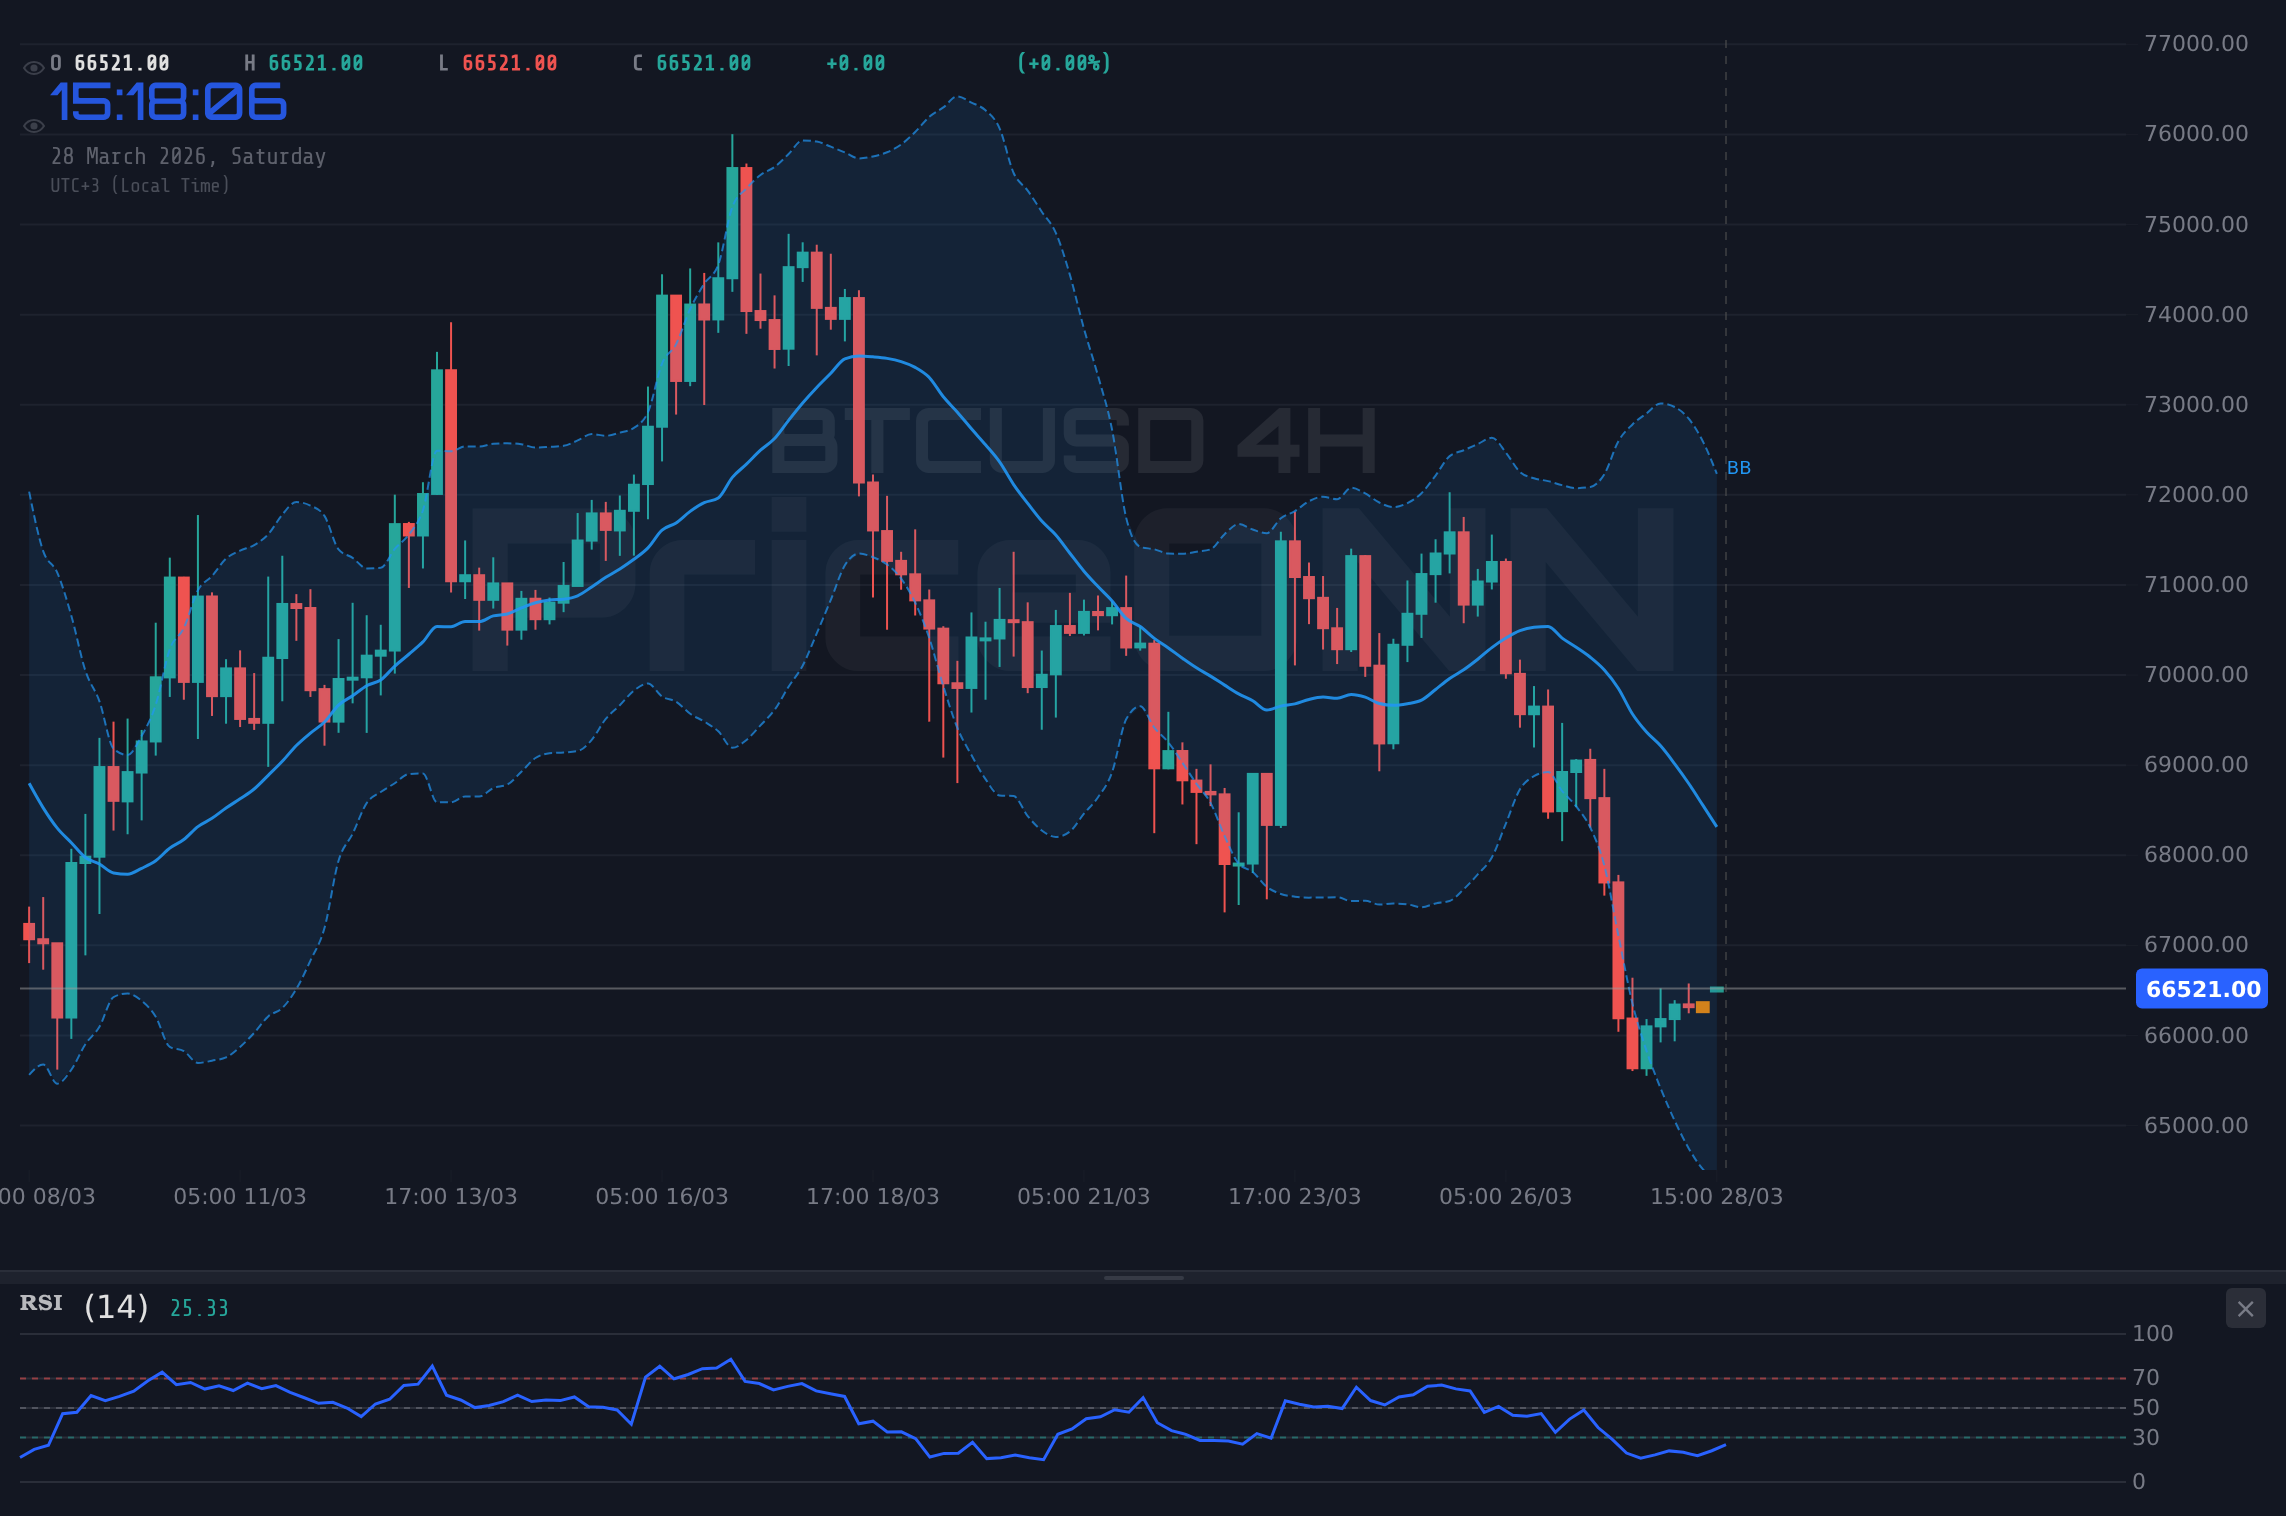
Looking at the shorter timeframes, the hourly chart presents a somewhat conflicting view. The RSI at 44.64 remains in neutral territory, but with a downward trend. The MACD, however, shows positive momentum with the MACD line above its signal line, suggesting a brief bullish inclination on this very short-term timeframe. This divergence between the daily and hourly MACD signals is a common occurrence and highlights the importance of multi-timeframe analysis. The ADX on the hourly chart at 36.94 indicates a strong downtrend, contradicting the slightly positive MACD signal. This complexity underscores the fact that the market is currently in a state of flux, with short-term fluctuations not necessarily aligning with the broader daily trend. Traders looking for immediate opportunities might be tempted by the hourly signals, but a prudent approach would be to weigh these against the more established daily trend and indicators.
The Stochastic Oscillator provides further insight, with the K value at 14.45 and the D value at 26.65 on the daily chart. This configuration indicates a bearish signal, as the %K line is below the %D line, and both are in the oversold territory. Historically, when Stochastic enters oversold territory, it can signal a potential for a price rebound. However, it is not a buy signal in itself; it merely suggests that the selling pressure may be nearing exhaustion. On the hourly chart, the Stochastic is also showing a bearish signal with %K (59.88) below %D (72.09), though not in oversold territory. This consistent bearish signal from the Stochastic across different timeframes, despite the neutral RSI, adds weight to the argument for caution on the long side. The fact that the Stochastic is in oversold territory on the daily chart, however, could be an early warning that a bounce is possible if key support levels hold.
Support and resistance levels are paramount in understanding BTCUSD's potential movements. On the daily chart, the immediate support is identified at $64,708, followed by more significant levels at $63,315 and $61,078. The $61,078 level, in particular, has acted as a crucial floor in recent months, and a decisive break below it would signal a significant shift in market sentiment. On the resistance side, the price faces immediate hurdles at $68,338, with further significant resistance expected around $70,575 and $71,968. The $68,338 level has proven to be a formidable barrier in the past week, acting as a ceiling that has capped rallies. For a bullish outlook to gain traction, BTCUSD would need to convincingly break and hold above this resistance. Conversely, a failure to hold the $64,708 support could see the price retest lower levels, potentially targeting the $63,315 support.
The broader market context, particularly the performance of traditional risk assets and the US Dollar Index (DXY), plays a crucial role in shaping Bitcoin's price action. The S&P 500 and Nasdaq indices have experienced significant declines this past week. The S&P 500 closed around 6,357.55, down 2% for the day, while the Nasdaq fell 2.23% to 23,092.5. This risk-off sentiment in equities often correlates with a decrease in appetite for riskier assets like Bitcoin. When major stock indices tumble, investors tend to seek safer havens, which can lead to outflows from cryptocurrencies. Conversely, the DXY has shown strength, trading around 99.91, indicating a strengthening US Dollar. A stronger dollar typically exerts downward pressure on assets priced in dollars, including Bitcoin. The current confluence of falling equities and a rising dollar creates a challenging environment for BTCUSD, suggesting that any upward momentum may face significant headwinds unless these correlations shift.
Geopolitical tensions, particularly in the Middle East, have added another layer of complexity. Reports of Iran shutting down the Strait of Hormuz and escalating conflicts have sent gold prices soaring past $4,500. This heightened geopolitical uncertainty often drives investors towards safe-haven assets. While gold has benefited directly, the overall risk sentiment shift can impact Bitcoin. Sometimes, Bitcoin acts as a risk-on asset, moving in tandem with equities, and thus suffers during geopolitical turmoil. At other times, it can be perceived as a digital gold, a store of value benefiting from inflation hedges and geopolitical uncertainty. The current market reaction suggests that Bitcoin is leaning more towards the risk-on category, as evidenced by its struggles while gold rallies and equities decline. The ongoing drone strikes threatening Russian oil exports also contribute to this volatile energy and commodity market, indirectly impacting inflation expectations and central bank policies, which in turn affect Bitcoin.
Central bank policies, especially those of the US Federal Reserve, remain a critical driver for Bitcoin. While the provided economic calendar data is sparse for the immediate past and upcoming week, the general expectation regarding interest rates continues to influence market sentiment. If the Fed maintains a hawkish stance or signals a delay in rate cuts, it could increase borrowing costs and reduce liquidity, potentially dampening speculative assets like Bitcoin. Conversely, any indication of a pivot towards looser monetary policy could boost risk appetite and support Bitcoin's price. The ongoing debate about inflation, with the US reporting a higher-than-expected Personal Consumption Expenditures (PCE) price index at 6.926% compared to a forecast of -1.3%, further complicates the picture. Persistent inflation could force central banks to maintain higher rates for longer, creating headwinds for risk assets. The market's interpretation of this inflation data and its implications for future Fed actions will be crucial for Bitcoin's direction.
Given the mixed technical signals and the prevailing macroeconomic and geopolitical backdrop, the outlook for BTCUSD remains uncertain, necessitating a detailed scenario analysis. The ADX at 31.92 on the daily chart confirms a strong trend, but the conflicting signals from RSI and MACD prevent a clear directional call. The 1-hour chart shows a strong downtrend (ADX 36.94), while the 4-hour chart also indicates a downtrend (ADX 31.92). However, the daily chart's ADX at 17.3 suggests a weaker trend overall, creating a conflict in trend strength interpretation across timeframes. The key levels to watch remain the immediate support at $64,708 and resistance at $68,338. A break above resistance could target $70,575, while a break below support might lead to a test of $63,315.
The concept of 'key levels' is crucial for any BTCUSD technical analysis today. These are not arbitrary numbers but price points where significant buying or selling pressure has historically emerged. For BTCUSD, the $66,449 current price represents a pivotal area. A hold above this level could be interpreted as a sign of strength, especially if accompanied by increasing volume. Conversely, a sustained price below this psychological mark might invite further selling pressure, potentially targeting the aforementioned support levels. The $68,338 resistance level is particularly important. A successful breach and consolidation above it would be a significant bullish signal, suggesting a potential move towards higher targets. The market sentiment analysis needs to consider the interplay between these levels and the broader risk appetite. Currently, the sentiment appears cautious, with traders hesitant to commit heavily on either side until a clearer directional bias emerges.
The correlation between Bitcoin and traditional markets, especially tech stocks like the Nasdaq, is a key factor to monitor. The Nasdaq's sharp decline this week, closing around 23,092.5, suggests a broader risk aversion that typically impacts Bitcoin negatively. While Bitcoin has sometimes shown signs of decoupling and acting as a 'digital gold' during periods of geopolitical uncertainty, its recent performance suggests it is still largely behaving as a risk-on asset. This means that as long as major stock indices are under pressure, Bitcoin may struggle to find sustained upward momentum. The price forecast for BTCUSD will therefore be heavily influenced by the direction of global equity markets and the broader macroeconomic environment, including inflation data and central bank policy cues.
The recent market news highlights ongoing volatility. Reports of Bitcoin testing $70,000 amidst stablecoin jitters and institutional inflows show the market's sensitivity to both regulatory whispers and strong capital flows. However, the broader risk-off sentiment, as seen in the equity markets, is currently a more dominant factor. The conflict in the Middle East, impacting oil prices and inflation expectations, adds another layer of uncertainty that cannot be ignored. This complex interplay of factors means that Bitcoin's price action could remain choppy. The trend analysis for BTCUSD needs to account for these external influences, which can often override purely technical signals in the short to medium term.
From a trading perspective, the current environment demands patience and a clear strategy. The mixed signals from indicators like RSI and MACD, coupled with the strong ADX on shorter timeframes but weaker trend strength on the daily, suggest a market in transition. The key levels identified - support at $61,078 and resistance at $68,338 - are crucial battlegrounds. A breakout above $68,338 could signal the start of a new bullish phase, targeting $70,575 and potentially higher. Conversely, a decisive close below $64,708, and particularly below $61,078, would invalidate any immediate bullish hopes and could lead to a more significant correction.
The price action around the $66,449 level is critical. A failure to hold this area could trigger a cascade of stop-losses, accelerating downward movement. Conversely, if buyers step in strongly around the $64,708 support, we might see a consolidation pattern emerge before a potential upward move. The trading signals derived from the indicators are currently leaning bearish on the short to medium term, but the oversold conditions on the daily Stochastic suggest that a bounce is plausible. Confirmation would be needed, such as a decisive break above the $68,338 resistance or a bullish divergence on the daily RSI.
Considering the conflicting signals and the broader market sentiment, a neutral scenario with a slight bearish bias seems most probable in the short term. However, the market is dynamic, and shifts can occur rapidly. The probability of a bullish move hinges on breaking key resistance levels and a reversal in global risk sentiment. A bearish scenario is more likely if immediate support levels fail and geopolitical tensions continue to escalate, pushing investors into safer assets. The ADX on the daily chart at 17.3 is a key point of contention; if this number starts to climb significantly, it would indicate a strengthening trend, which would then require more decisive action based on its direction.
The current technical setup for BTCUSD presents a challenging environment. While the daily chart shows a neutral trend with moderate strength (ADX 17.3), the shorter timeframes exhibit stronger bearish momentum (hourly ADX 36.94, 4-hour ADX 31.92). The RSI at 41.2 on the daily chart provides a neutral reading, but the MACD histogram is negative, suggesting underlying bearish pressure. The Stochastic Oscillator on the daily chart is in oversold territory, hinting at a potential bounce, but this is not a definitive buy signal. Support at $64,708 and $61,078 are critical for preventing further downside, while resistance at $68,338 and $70,575 need to be overcome for a bullish reversal. The correlation with risk assets like the Nasdaq, which has seen significant declines, adds to the bearish pressure. Geopolitical events and central bank policy expectations remain key macro drivers that could easily shift the narrative.
The past week has been characterized by consolidation around the $66,449 level for BTCUSD. While the daily trend shows a neutral stance with moderate strength (ADX 17.3), the shorter timeframes exhibit stronger bearish signals. The RSI at 41.2 indicates a lack of strong directional conviction, while the negative MACD histogram suggests that selling pressure is present. Support at $64,708 and $61,078 are crucial watch zones. Resistance at $68,338 is the immediate barrier for any bullish aspirations. Given the current technical divergence and the prevailing risk-off sentiment in traditional markets, caution is warranted. Traders should look for clear breaks of key levels or confirmation from multiple indicators before committing to a directional trade.
Bearish Scenario: Consolidation Breakdown
60% ProbabilityNeutral Scenario: Range-Bound Volatility
30% ProbabilityBullish Scenario: Resistance Breakout
10% ProbabilityFrequently Asked Questions: BTCUSD Analysis
What happens if BTCUSD breaks below the $64,708 support level?
A daily close below $64,708 would invalidate the neutral short-term outlook and likely trigger a move towards the $63,315 support. This bearish signal would be reinforced if selling pressure continues towards the $61,078 major support zone, indicating a potential trend reversal.
Should I consider buying BTCUSD at current levels around $66,449 given the daily Stochastic is oversold?
While the daily Stochastic Oscillator is in oversold territory, it is not a direct buy signal. A more prudent approach would be to wait for confirmation, such as price holding above immediate support ($64,708) or a decisive break above the $68,338 resistance. Buying solely on oversold Stochastic without confirmation carries significant risk.
Is the negative MACD histogram at 41.2 RSI a sell signal for BTCUSD right now?
The negative MACD histogram suggests bearish momentum is present, while the RSI at 41.2 indicates neutral conditions. This combination implies that while downward pressure exists, it is not yet overwhelming. A confirmed sell signal would require a break of key support levels or further confirmation from other indicators.
How might the ongoing Middle East tensions and Fed rate expectations affect BTCUSD this week?
Escalating geopolitical tensions can increase demand for safe-haven assets, potentially pressuring riskier assets like Bitcoin. Simultaneously, persistent inflation data (like the recent 6.926% PCE) may lead the Fed to maintain higher rates, reducing liquidity and acting as a headwind for BTCUSD. These macro factors could override technical signals, making cautious trading essential.
Track markets in real-time
AI-powered analysis, technical indicators and real-time price data.
Join Our Telegram Channel
Breaking market news, AI analysis and trading signals instantly.
Join Channel