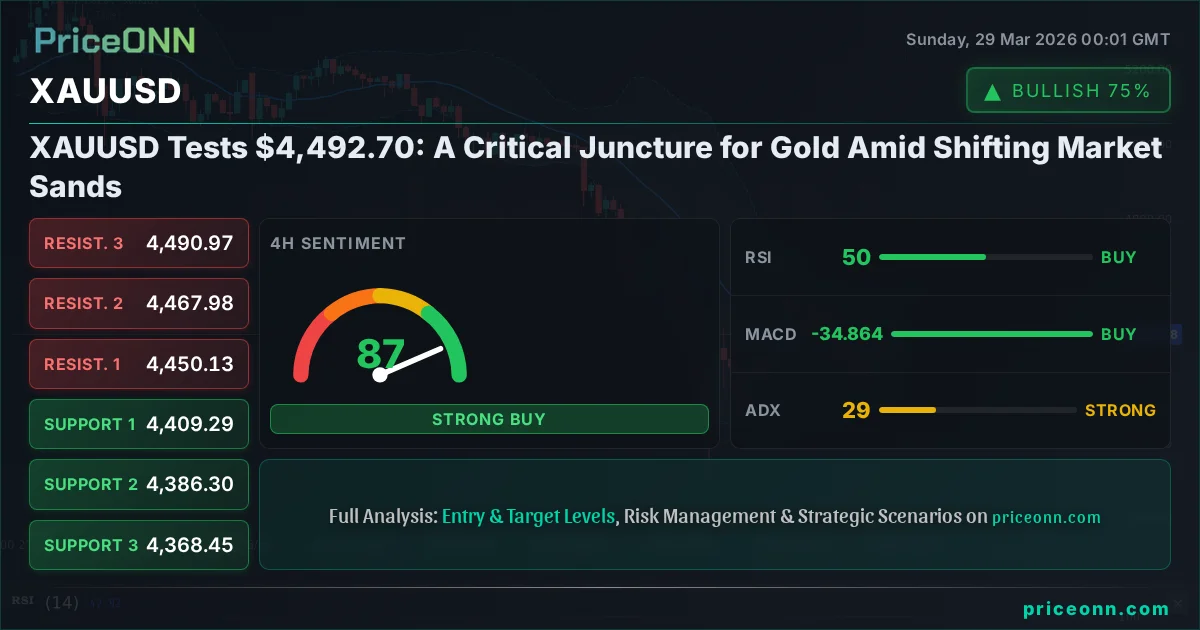
XAUUSD Tests $4,492.70: A Critical Juncture for Gold Amid Shifting Market Sands
Gold hovers around $4,492.70 as geopolitical tensions and economic uncertainty create a volatile landscape. Technical indicators offer mixed signals, demanding careful navigation.
The precious metal, XAUUSD, is currently positioned at a critical juncture, trading around the $4,492.70 mark. This price level, a significant point of reference from the latest market data, finds gold navigating a complex landscape shaped by escalating geopolitical tensions and a shifting global economic outlook. After a notable surge, the metal now faces a period where its next directional move hinges on a confluence of technical signals and fundamental undercurrents. The daily chart paints a picture of a potential downtrend with a power score of 90%, yet the 1-hour and 4-hour timeframes present a more neutral to bullish leaning, creating a divergence that traders must decipher.
- RSI at 56.12 on the 1H chart signals neutral momentum with an upward bias, while the 1D RSI at 36.2 indicates a bearish leaning.
- Critical support for XAUUSD sits at $4,492.65 (1H) and $4,304.96 (1D), tested intermittently this week.
- The ADX reading of 24.26 on the 1H suggests a moderately trending market, contrasting with the 30.99 on the 1D, indicating a strong downtrend.
- Geopolitical events and the DXY's movement at 99.79 are key drivers influencing the correlation between gold and the dollar.
This week has been a testament to gold's dual nature as both a safe-haven asset and a sensitive barometer of inflation expectations. The latest market data reveals XAUUSD closing last Friday near $4,492.70, a level that has seen considerable price action. The broader market sentiment, influenced heavily by the Dollar Index (DXY) trading at 99.79 and a significant dip in the S&P 500 to 6355.66, creates a complex backdrop. While a strengthening dollar typically exerts downward pressure on gold, the prevailing geopolitical instability, particularly concerning energy markets as indicated by Brent crude's surge to $110.33, could be providing a floor for the precious metal. This dynamic interplay between currency strength, risk sentiment, and inflation hedges is central to understanding gold's current position.
From a technical standpoint, the divergence across different timeframes presents a challenging but potentially rewarding scenario for traders. The 1-hour chart offers a bullish inclination, with a general buy signal and RSI hovering at 56.12, suggesting underlying upward momentum. However, the daily chart tells a different story, painting a bearish picture with a trend strength of 90%, an RSI at 36.2, and negative MACD momentum. This discrepancy underscores the importance of multi-timeframe analysis. Traders looking for short-term opportunities might find signals on the hourly charts, while those with a longer-term perspective must contend with the prevailing bearish trend on the daily timeframe. The ADX indicator further complicates the picture, showing a moderate trend on the 1H (24.26) and a strong trend on the 1D (30.99), indicating conflicting trend strengths across the timeframes.
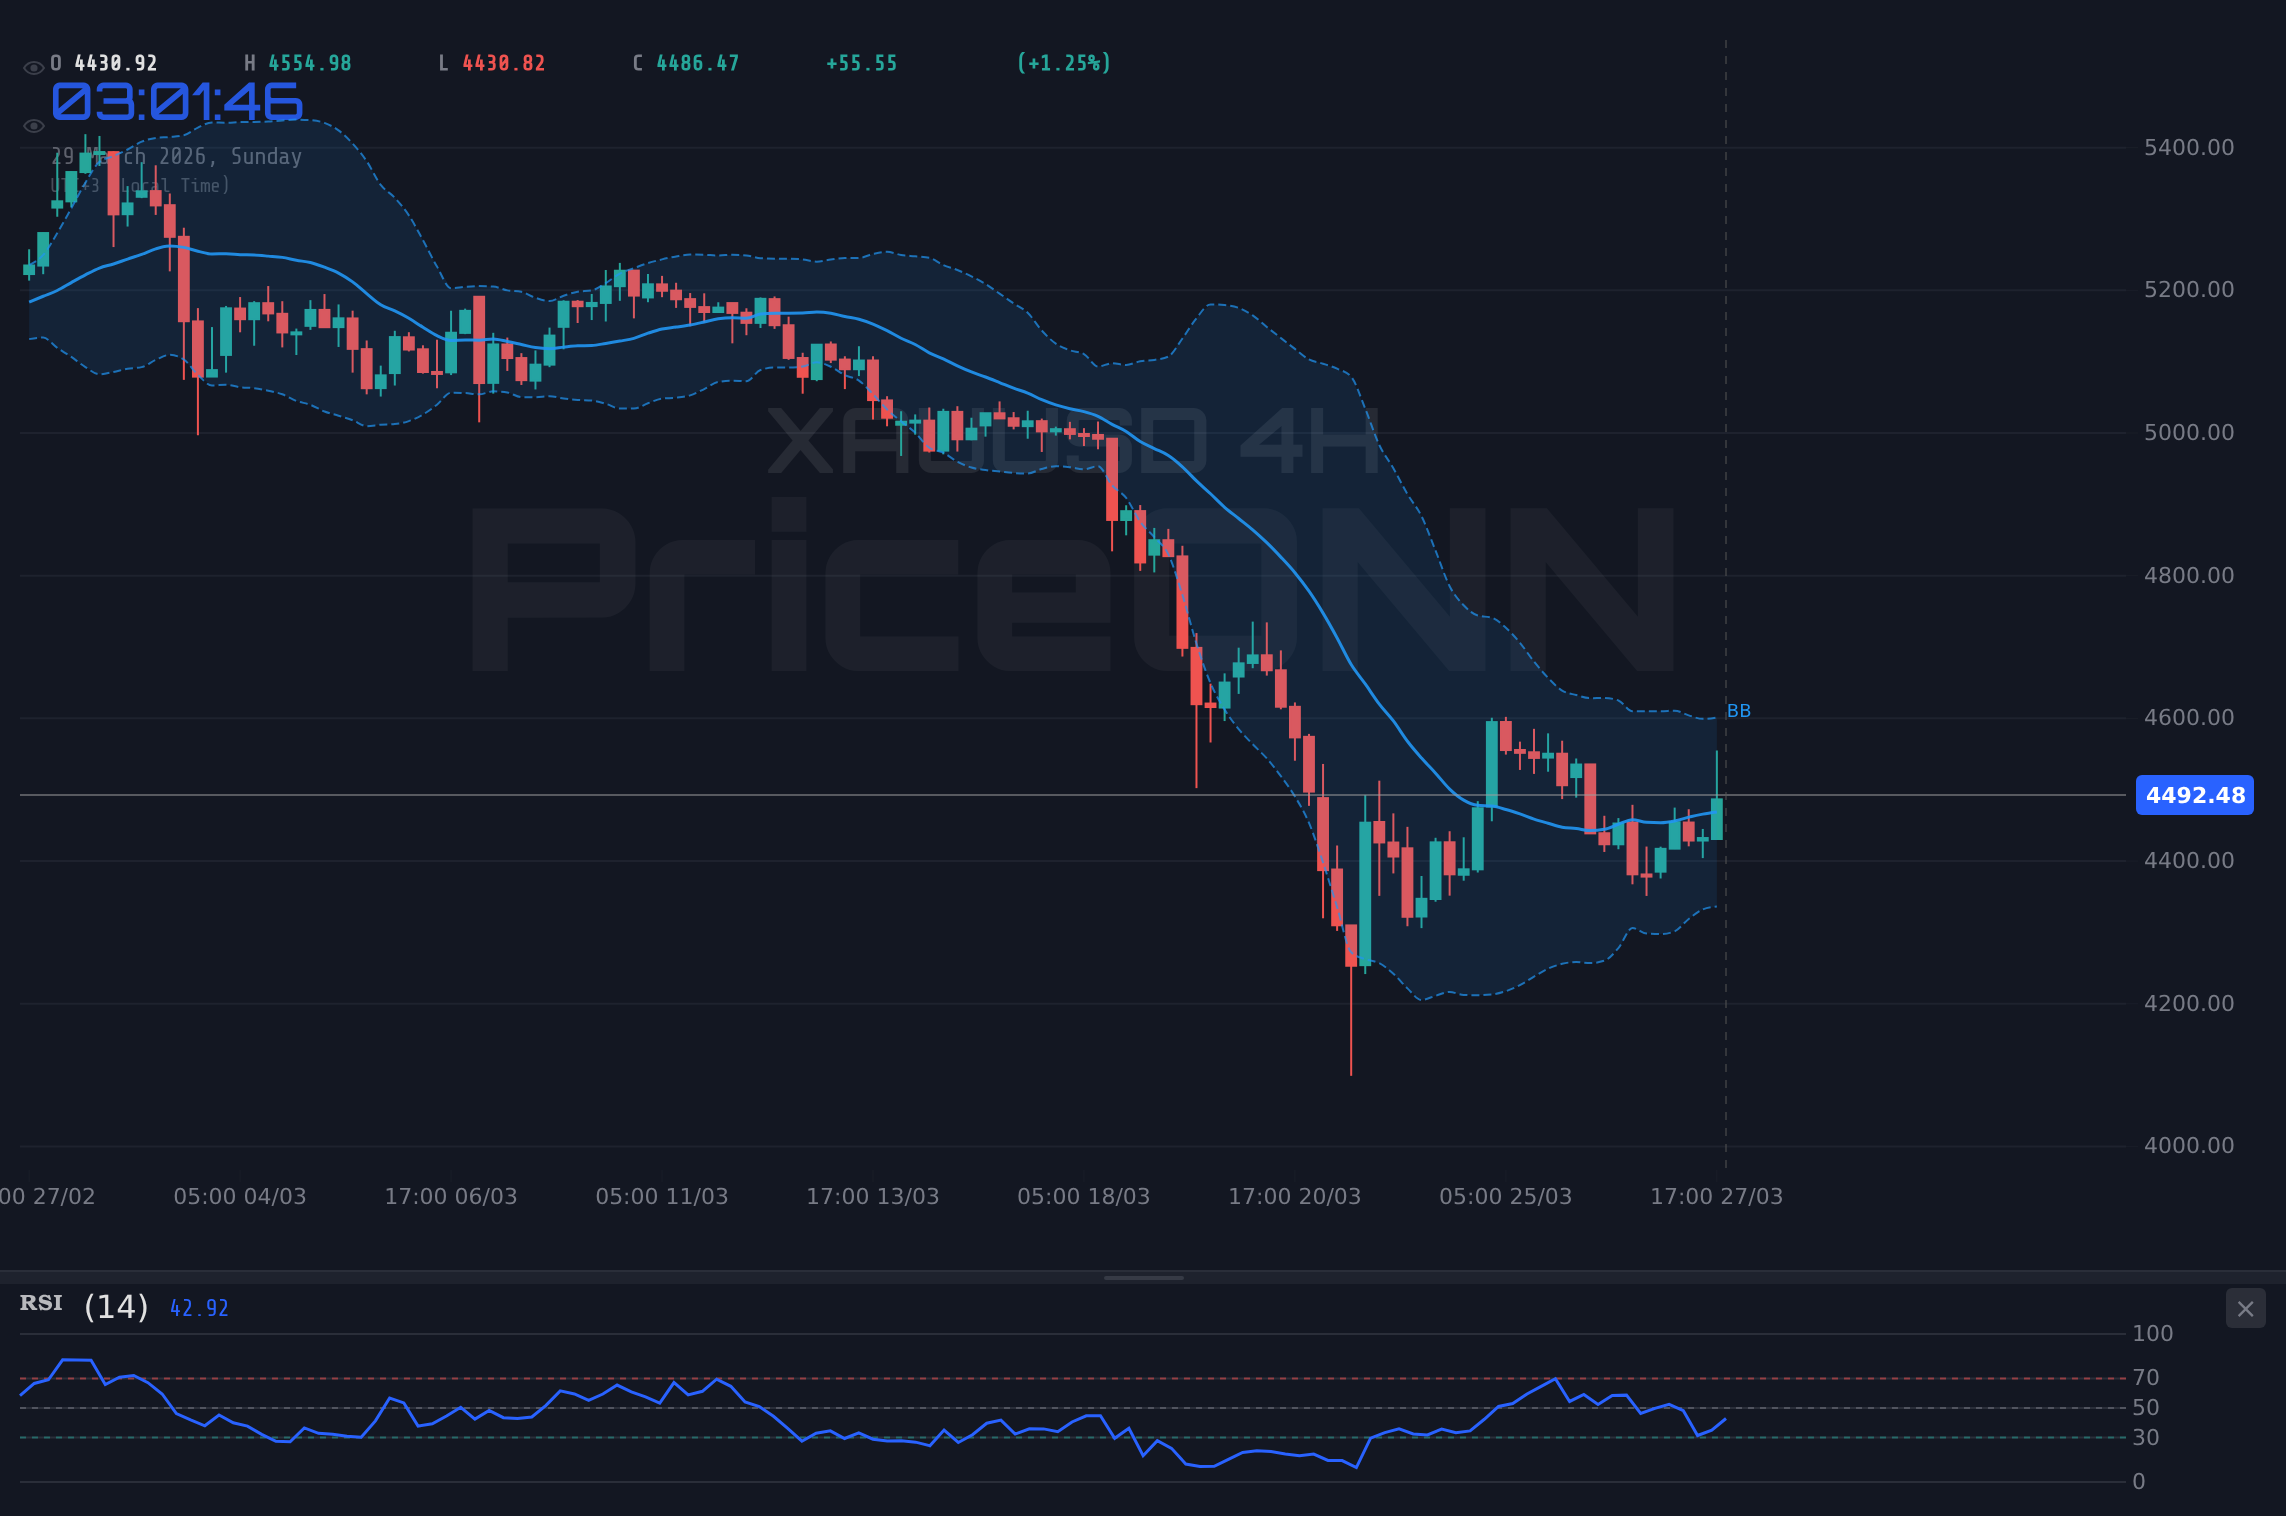
The current price of $4,492.70 for XAUUSD is not merely a number; it represents a battleground where bulls and bears are vying for control. On the 1-hour chart, key support is identified at $4,492.65, a level that has been tested. A break below this could signal further downside. Resistance, on the other hand, is seen at $4,534.5. The 4-hour chart also shows a bullish bias with RSI at 50.32 and a strong trend indicated by ADX at 28.83, suggesting that short-to-medium term traders might be leaning towards the upside despite the daily bearish outlook. The Stochastic Oscillator on the 4-hour chart also shows a bullish signal (%K > %D), adding to the mixed technical tapestry. This intricate web of indicators and price levels necessitates a granular approach to strategy development.
One of the most significant drivers impacting gold recently has been the surge in energy prices. Brent crude oil, trading at $110.33, has seen a dramatic 6.48% daily increase, fueled by ongoing geopolitical tensions in the Middle East. This rise in oil prices directly feeds into inflation expectations, a traditional tailwind for gold. When energy costs soar, the general price level tends to rise, eroding the purchasing power of fiat currencies and making gold, often seen as an inflation hedge, more attractive. The market's reaction to these energy price shocks, coupled with the general uncertainty surrounding global stability, creates a potent cocktail of demand for safe-haven assets like gold. This fundamental backdrop provides a crucial context for the technical signals observed.
The correlation with the US Dollar Index (DXY), currently at 99.79 and showing a 0.22% daily increase, is also a critical factor. Historically, a stronger dollar tends to make gold more expensive for holders of other currencies, thus dampening demand. However, in periods of heightened geopolitical risk, gold can sometimes move in tandem with the dollar as both are perceived as safe havens. The current data shows the DXY in an uptrend across all timeframes, with the daily chart exhibiting a strong trend (ADX 31.93). This presents a potential headwind for gold, especially if the dollar continues to strengthen. The interplay between the dollar's strength and gold's safe-haven appeal is a delicate dance that investors are closely watching.
Looking at the broader market context, the sharp decline in major equity indices like the S&P 500 (down 2.03% to 6355.66) and Nasdaq 100 (down 2.3% to 23076.09) further amplifies the demand for safe-haven assets. When risk appetite wanes, investors often flock to assets perceived as less volatile and more stable, such as gold and US Treasuries. This risk-off sentiment can override the typical inverse correlation between the dollar and gold, leading to both strengthening simultaneously. The significant drops in equities suggest that market participants are becoming more risk-averse, which could provide underlying support for gold, even in the face of a relatively strong dollar. This sentiment is a crucial element in forecasting gold's short-to-medium term trajectory.
The technical indicators on the daily chart present a predominantly bearish outlook, despite the more optimistic signals on shorter timeframes. The RSI at 36.2 is below the 50-neutral level, and the MACD is showing negative momentum, indicating that sellers have had the upper hand over the past 24 hours. The Bollinger Bands are also positioned below the middle band, reinforcing the bearish sentiment. However, the Stochastic Oscillator on the daily chart is showing a bullish signal (%K > %D), suggesting a potential for a bounce. This conflicting signal from the Stochastic on the daily chart, against the backdrop of a strong downtrend (ADX 30.99), highlights the uncertainty and the need for confirmation before committing to a directional trade. The general signal across the daily timeframe is a 'SELL' (2 Buy, 6 Sell, 0 Neutral).
The 1-hour and 4-hour charts, however, offer a more constructive view. The 1-hour chart shows a neutral trend with a bullish inclination (RSI 56.12, MACD positive momentum) and a general 'BUY' signal (6 Buy, 2 Sell, 0 Neutral). Support is found at $4,492.65, with resistance at $4,534.5. The 4-hour chart continues this theme, with RSI at 50.32 and a strong uptrend indicated by ADX 28.83. The Stochastic on this timeframe also provides a bullish signal. This suggests that intraday traders might be looking for opportunities to buy into any dips, anticipating a short-term recovery. The key here is to watch if this shorter-term bullish momentum can overcome the longer-term bearish trend.
Given the divergence in signals and the conflicting fundamental drivers, a multi-scenario approach is essential for navigating XAUUSD. The current price of $4,492.70 serves as a pivot point. A break below immediate support levels could accelerate the bearish trend indicated on the daily chart, while a sustained push above resistance might signal a reversal. The market's reaction to upcoming economic data, particularly any figures that might influence inflation expectations or central bank policy, will be crucial. For instance, if upcoming inflation data surprises to the upside, it could bolster gold's appeal as an inflation hedge, potentially overriding dollar strength. Conversely, stronger-than-expected employment figures could lead to a stronger dollar and renewed pressure on gold.
The recent surge in oil prices, coupled with the sharp decline in equity markets, creates a strong undercurrent of demand for safe-haven assets. This is a fundamental factor that cannot be ignored when assessing gold's potential. While the daily technicals suggest caution, the fear premium being priced into the market due to geopolitical events and stagflation concerns might provide a floor under gold prices. The ability of gold to hold above key support levels, such as $4,468.70 on the 1-hour chart or $4,304.96 on the daily chart, will be critical in determining whether the current bearish trend has room to run or if a significant correction is imminent. The market is essentially weighing the traditional safe-haven appeal against the pressure from a potentially strengthening dollar.
Understanding the interplay between these technical and fundamental factors is paramount. The 1H ADX at 24.26 suggests a trend is forming, but its strength is moderate. The 4H ADX at 28.83 indicates a stronger trend, but it's still below the threshold for a very strong trend. The daily ADX at 30.99, however, points to a well-established downtrend. This discrepancy in trend strength across timeframes means that short-term trades might be more volatile, and confirmation is key. A sustained break above the daily resistance at $4,497.62 would be a significant bullish signal, potentially invalidating the current bearish narrative. Conversely, a decisive drop below the 1H support at $4,468.70 could signal a continuation of the daily downtrend.
The role of central banks in the gold market cannot be overstated. Recent reports indicate continued accumulation of gold reserves by several major central banks, driven by a desire to diversify away from the US dollar and hedge against geopolitical risks and inflation. This structural demand provides a long-term supportive element for gold prices, acting as a significant counterweight to short-term fluctuations driven by speculative trading or currency movements. While ETF outflows might indicate Western investor caution, the consistent buying from official sector sources suggests a fundamental floor is in place for the yellow metal, providing a degree of confidence for long-term holders.
Considering the current market environment, the probability of a neutral scenario or a period of consolidation seems high in the immediate term, given the conflicting signals. However, the underlying geopolitical risks and inflation concerns lend weight to the potential for a bullish breakout if key resistance levels are overcome. The bearish scenario remains a strong contender, especially if the DXY continues its upward trajectory and risk-off sentiment intensifies. The upcoming week will be crucial, with economic data releases and geopolitical developments likely to provide the catalyst for gold's next significant move. Traders must remain vigilant, manage their risk effectively, and wait for clear signals before committing substantial capital.
The Bears' Grip: A Downside Scenario
65% ProbabilityThe Waiting Game: Consolidation Around $4,492.70
25% ProbabilityThe Bull's Gambit: A Reversal Attempt
10% ProbabilityNavigating the Crossroads: What to Watch Next Week
As we look towards the upcoming trading week, the focus for XAUUSD remains squarely on the interplay between geopolitical risks, central bank expectations, and the technical levels that have defined recent price action. The current price of $4,492.70 is more than just a trading point; it's a psychological level that could dictate short-term sentiment. The significant drop in major equity indices like the S&P 500 to 6355.66 and Nasdaq 100 to 23076.09, alongside the dollar's strength at 99.79, creates a complex risk-reward scenario for gold. While dollar strength is a headwind, the persistent inflation hedge narrative, bolstered by soaring oil prices to $110.33, offers a strong counterargument.
Technically, the divergence between the shorter-term bullish signals and the longer-term bearish trend on the daily chart (RSI 36.2, ADX 30.99) suggests that volatility is likely to remain elevated. Key levels to monitor closely will be the immediate 1-hour support at $4,492.65. A breach here could trigger further selling pressure, potentially testing the 4-hour support at $4,409.29. On the upside, the 1-hour resistance at $4,534.5 is the first hurdle. A convincing break above this level, especially if accompanied by increasing volume and positive MACD momentum, could signal a short-covering rally, though challenging the daily resistance at $4,497.62 would be a more significant indicator of a trend change.
Economic data releases will play a pivotal role in shaping market expectations and, consequently, gold's price action. Investors will be scrutinizing any new inflation figures or employment reports that could influence central bank policy. For example, a surprisingly high inflation reading could reignite demand for gold as an inflation hedge, potentially pushing prices higher even if the dollar strengthens. Conversely, data suggesting a cooling economy or a more dovish central bank stance might weaken the dollar and provide support for gold. The market's interpretation of these data points, and how they align with or deviate from current expectations, will be critical in determining the direction of XAUUSD in the coming days.
The ongoing geopolitical narrative, particularly concerning the Middle East and its impact on energy markets, continues to be a significant wildcard. The surge in Brent crude to $110.33 highlights the sensitivity of markets to these events. Any escalation or de-escalation in regional conflicts could have a swift and pronounced impact on gold prices, driving safe-haven demand or reducing it accordingly. This makes it imperative for traders to stay informed about geopolitical developments and their potential implications for energy prices and overall market sentiment. The market's reaction to these events, rather than the events themselves, is what ultimately drives price action.
XAUUSD is at a critical crossroads, with conflicting technical signals and a complex mix of fundamental drivers. The bearish trend on the daily chart is undeniable, yet short-term charts and the persistent demand for safe havens due to geopolitical risks and inflation fears offer potential for a bullish counter-trend move. The ability of gold to hold above key support levels around $4,492.65, or break decisively through resistance near $4,534.5, will be crucial in determining its path forward. Vigilance, disciplined risk management, and a keen eye on both technical levels and macro catalysts will be essential for navigating this uncertain yet potentially opportune market environment.
| Indicator | Value | Signal | Interpretation |
|---|---|---|---|
| RSI (14) | 56.12 | Neutral | Neutral momentum on 1H, bearish on 1D (36.2) |
| MACD Histogram | Positive | Bullish | Positive momentum on 1H/4H, negative on 1D |
| Stochastic | K=62.62, D=69.19 | Bearish | Bearish crossover on 1H, bullish on 4H |
| ADX | 24.26 | Moderate Trend | Moderate trend strength on 1H, strong on 1D (30.99) |
| Bollinger | Middle Band | Watch | Above middle band on 1H/4H, below on 1D |
Frequently Asked Questions: XAUUSD Analysis
What happens if XAUUSD breaks below the 1H support at $4,492.65?
A break below $4,492.65 on the 1-hour chart could accelerate selling pressure, potentially targeting the next support at $4,468.70. This would validate the bearish trend indicated by the daily chart's RSI at 36.2 and ADX at 30.99.
Should I buy XAUUSD at current levels around $4,492.70 given the mixed technical signals?
Buying at current levels requires caution due to the bearish daily trend. A more prudent approach would be to wait for confirmation, such as a sustained break above $4,534.5 resistance, or a clear bounce from the 4H support around $4,409.29, while managing risk tightly.
Is the RSI at 56.12 on the 1H chart a buy signal for XAUUSD right now?
An RSI of 56.12 on the 1-hour chart indicates neutral momentum with a slight upward bias, not an outright buy signal. While it suggests some bullish inclination in the short term, it needs to be considered alongside other indicators and the prevailing daily downtrend.
How will the rising DXY at 99.79 affect XAUUSD's price around $4,492.70 this week?
A rising DXY typically exerts downward pressure on gold. However, geopolitical tensions and inflation concerns can sometimes lead to gold and the dollar strengthening concurrently as safe havens. The market will be watching if gold can maintain its value above $4,492.70 despite dollar strength.
Track markets in real-time
AI-powered analysis, technical indicators and real-time price data.
Join Our Telegram Channel
Breaking market news, AI analysis and trading signals instantly.
Join Channel