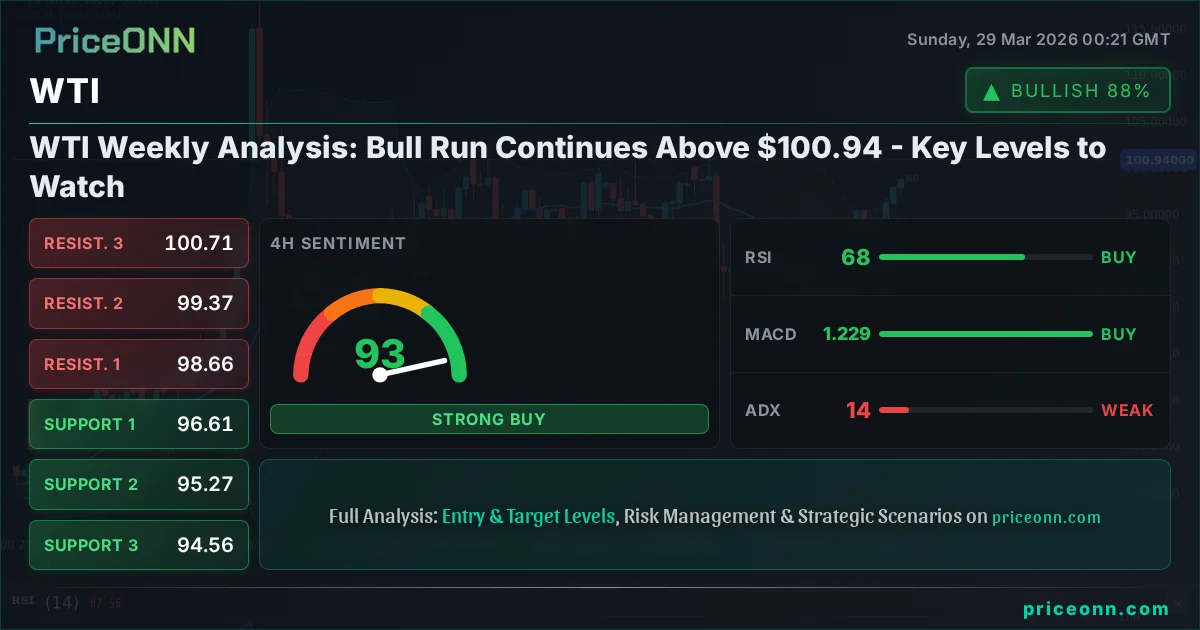
WTI Weekly Analysis: Bull Run Continues Above $100.94 - Key Levels to Watch
WTI crude oil holds firm above $100.94 after a strong week. Technicals show bullish momentum, but overbought conditions loom. What's next?
The WTI crude oil market has staged a remarkable comeback, decisively breaking through the psychological $100 mark and now consolidating above $100.94. This past week saw significant upward momentum, driven by a confluence of geopolitical tensions and fundamental supply concerns. As traders eye the week ahead, the critical question is whether this bullish run can be sustained or if profit-taking and overbought indicators will lead to a correction. Understanding the interplay between technical signals and the underlying market drivers is paramount for navigating this dynamic environment.
- WTI crude oil is trading above $100.94, a significant bullish development driven by supply fears and geopolitical risk premiums.
- On the daily chart, RSI at 67.11 indicates a strong upward trend but approaches overbought territory, suggesting caution is warranted.
- The ADX at 57.34 on the daily timeframe signals a very strong upward trend, confirming the conviction behind the current move.
- Key resistance lies at $106.34, while support is found at $100.77; a break of either level will likely dictate the next significant price action.
Navigating the Surge: WTI's Ascent Above $100.94
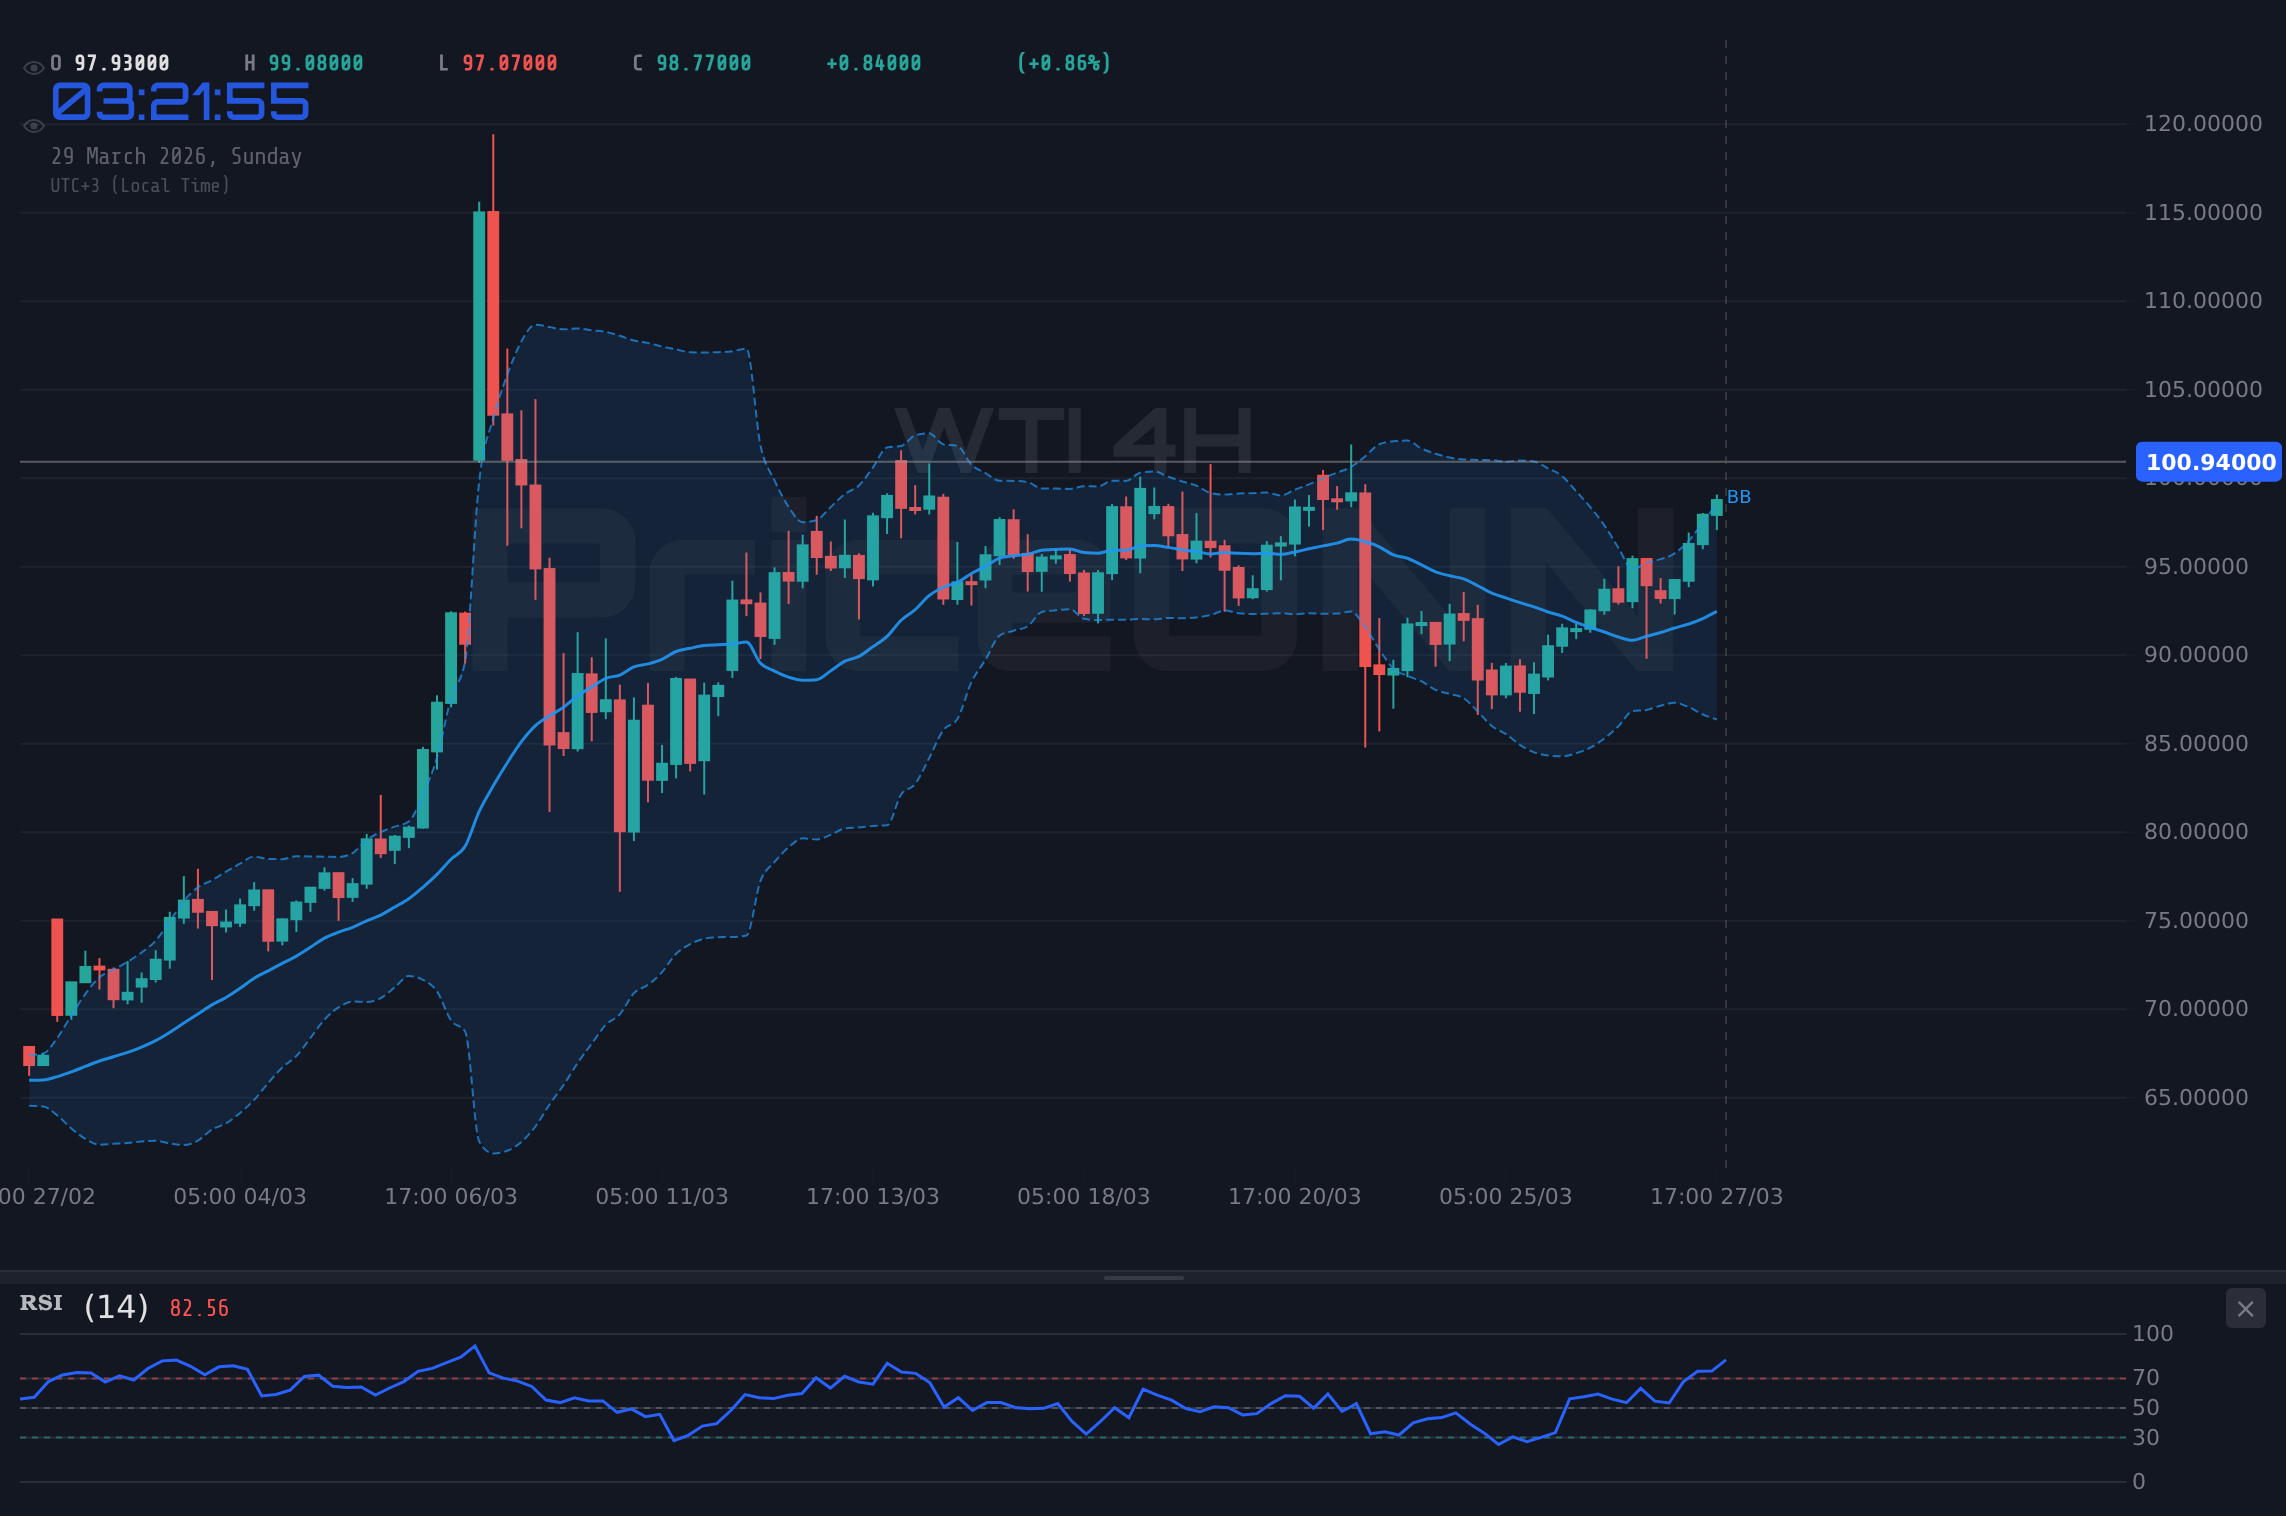
The price action in WTI crude oil this past week has been nothing short of spectacular. After weeks of consolidation and indecision, the market finally found its footing, pushing prices decisively above the critical $100 per barrel level. The current price of $100.94 reflects a significant weekly gain, underscoring the strength of the bullish sentiment that has taken hold. This surge is not merely a technical breakout; it's underpinned by a complex web of fundamental factors that have intensified market volatility. The geopolitical landscape, particularly in the Middle East, continues to be a major catalyst, injecting a substantial risk premium into oil prices. Any escalation or perceived threat to supply routes or production facilities immediately translates into higher prices, as traders price in potential disruptions. This has created a supportive environment for oil, pushing it into territory not seen in months.
From a technical standpoint, the daily chart paints a predominantly bullish picture. The Relative Strength Index (RSI) at 67.11, while not yet in overbought territory (typically considered above 70), clearly signals strong upward momentum. This suggests that buyers are in control and have been consistently driving prices higher. The MACD indicator, though showing negative momentum on the daily timeframe, is showing positive momentum on the 1-hour and 4-hour charts, indicating a potential shift or at least a short-term bullish bias within the larger uptrend. The ADX on the daily chart, standing at a robust 57.34, is particularly noteworthy. An ADX value this high signifies an exceptionally strong trend, confirming that the current move is not a fleeting fluctuation but a committed directional push. This strength in the trend suggests that pullbacks might be shallow and could present buying opportunities for those looking to join the momentum.
The 4-hour timeframe, while still showing strong bullish signals with an ADX of 14.31, indicates a more neutral stance compared to the daily chart's conviction. This suggests that while the longer-term trend is undeniably upward, shorter-term consolidation or minor retracements are possible as the market digests recent gains. The Stochastic indicator on the 4-hour chart at K=96.6 and D=84.09 is firmly in overbought territory, flashing a warning sign for immediate upside potential. This divergence between the strong daily trend and the overbought conditions on shorter timeframes highlights the need for careful entry strategies. It suggests that chasing the rally blindly could be risky, and waiting for a pullback or confirmation of a sustained breakout above immediate resistance might be a more prudent approach.
The 1-hour chart, however, presents a slightly different narrative. While the ADX at 29.47 still indicates a strong trend, the RSI at 80.39 is significantly overbought, and the Stochastic is also flashing extreme overbought signals. This suggests that the intraday momentum might be reaching a temporary peak. The MACD histogram on this timeframe is positive, and the MACD line is above the signal line, reinforcing the bullish bias, but the extreme RSI and Stochastic readings point towards a potential for intraday pullbacks or consolidation. This could be a natural consequence of such a rapid price ascent, where the market pauses to consolidate gains before potentially making its next move. It’s crucial for traders to distinguish between a healthy pullback within an uptrend and the beginning of a reversal.
The $100.94 Level: A New Floor or a Temporary Pause?
The price of $100.94 is more than just a number; it represents a significant psychological and technical threshold. Having decisively breached this level, it now serves as a key area of interest. The fact that WTI is currently trading above this level suggests it could act as a new support zone. Historically, when prices break above a significant resistance level and then retest it, a successful hold confirms the strength of the breakout and often precedes further upward movement. However, the current market conditions, with multiple indicators flashing overbought signals on shorter timeframes, warrant caution. A close below $100.94 on a significant volume could signal a failed breakout attempt and a potential move lower, targeting the next significant support level.
Looking at the provided data, the immediate support levels are identified at $100.77, $98.66, and $97.94 on the 1-hour and 4-hour charts. These levels represent areas where buying interest might emerge if the price pulls back. The daily support, however, is further down at $100.77, $97.91, and $95.20. The substantial gap between the current price and the daily support suggests that there is considerable room for a pullback before the broader bullish trend is technically challenged. This wider support structure provides a degree of comfort for bulls, implying that minor dips might be absorbed without derailing the overall upward trajectory.
On the resistance side, immediate hurdles are seen at $109.39 and $110.09 on the 1-hour chart, with the 4-hour chart showing resistance at $108.66 and $109.53. The daily resistance, however, is where the next significant challenges lie: $106.34, $109.05, and the more distant $111.91. The fact that the current price is already near the upper end of the 1-hour and 4-hour resistance ranges, while still having substantial room to the daily resistance levels, indicates that the immediate path higher might face some friction. A decisive break above $106.34 on the daily chart would be a strong signal of continued bullish momentum, potentially opening the door for a move towards the $109-$111 range.
Geopolitical Undercurrents: The Driving Force Behind the Rally
While technical indicators provide valuable insights into market sentiment and potential price movements, the fundamental underpinnings of the WTI rally cannot be ignored. The ongoing geopolitical instability, particularly the heightened tensions in the Middle East, remains a primary driver. News reports from the last 48 hours, such as the mention of potential energy rationing and the US offering incentives to halt offshore wind projects amidst a push for fossil fuels, highlight the precarious global energy supply situation. These developments directly impact crude oil markets by increasing the perceived risk of supply disruptions. When the market fears a shortage, prices tend to rise, reflecting this uncertainty. The involvement of major energy players and the strategic importance of oil-producing regions mean that any geopolitical flare-up in these areas has an immediate and amplified effect on WTI and Brent prices.
Furthermore, the broader economic context plays a crucial role. The correlation between WTI and the US Dollar Index (DXY) is something to monitor closely. While the DXY is showing strength, currently trading around 99.79 and showing a strong uptrend across timeframes, this can sometimes put pressure on dollar-denominated commodities like oil. However, in this instance, the bullish drivers for oil appear strong enough to overcome dollar strength, or perhaps the dollar strength itself is partly fueled by the same risk-off sentiment that supports oil prices. The news linking rising oil prices to potential stagflation and trouble for gold and the dollar underscores this complex relationship. The market is grappling with a 'dual shock' scenario, where rising energy costs could fuel inflation while simultaneously dampening economic growth, a situation reminiscent of the 1970s.
The strength of the US dollar, as indicated by the DXY's current price of 99.79 and its strong daily trend, often suggests a risk-averse environment. In such conditions, investors tend to move towards safe-haven assets. While gold might typically benefit, the surge in oil prices is creating a unique dynamic. The demand for oil is seen as robust, overriding typical safe-haven considerations for now. The fact that WTI is climbing despite a strengthening dollar highlights the potency of the supply-side narrative and geopolitical risk premiums currently dominating the energy markets. This suggests that the demand for oil is robust enough to absorb the headwinds from a stronger dollar, at least in the short to medium term.
Market Sentiment and Indicator Confluence
Analyzing the confluence of indicators across different timeframes offers a nuanced view of market sentiment. On the daily chart, the strong ADX of 57.34 is a powerful signal of a firmly established uptrend. This suggests that the underlying trend is robust and likely to persist unless significant counter-signals emerge. However, the RSI at 67.11, while still below the 'overbought' threshold, is approaching it, hinting that the pace of the rally might slow down or consolidate. The Stochastic on the daily chart, showing K=39.39 and D=46.4 with a downward cross, also suggests a potential short-term cooling-off period, even within the strong daily trend.
The shorter timeframes, particularly the 1-hour and 4-hour charts, present a more cautionary picture regarding immediate upside potential. The 1-hour RSI is at 80.39, firmly in overbought territory, and the Stochastic is also flashing extreme overbought signals. This suggests that intraday traders might be looking to book profits, potentially leading to minor pullbacks. The 4-hour chart also shows overbought Stochastic readings (K=96.6, D=84.09), reinforcing the idea that the market may be due for a brief pause or consolidation. This divergence between the strong daily trend and the overbought conditions on shorter timeframes is a classic sign of a market that has moved up rapidly and might need to consolidate before continuing higher. It’s not necessarily a bearish signal, but it does suggest that chasing the price higher at current levels might be risky.
The MACD indicator offers a mixed view. On the daily chart, it shows negative momentum, which seems to contradict the strong price action. However, on the 1-hour and 4-hour charts, it displays positive momentum with the MACD line above the signal line. This discrepancy could be due to the recent sharp upward move on the daily chart, where the MACD calculation might lag behind the price action. The overall interpretation from the indicators is that the dominant trend is bullish, supported by strong daily ADX and price action above key levels, but shorter-term overbought conditions and mixed signals on the MACD warrant a degree of caution and suggest that a consolidation phase is likely before any further significant upside.
The trend strength across different timeframes is also telling. The daily trend is classified as 'Very Strong' with an ADX of 62.63, while the 1-hour and 4-hour trends are 'Strong' and 'Neutral' respectively. This hierarchy of trend strength confirms that the primary direction is upwards, but the neutral reading on the 4-hour ADX (14.31) indicates that the momentum on that timeframe is not as committed as on the daily. This could mean that the market is consolidating gains on the 4-hour chart, waiting for a catalyst to re-ignite the trend. The weak ADX on the 4-hour chart could also be a sign that the current price action is not sustainable without further fundamental catalysts or a period of consolidation.
Price Outlook and Scenarios for the Week Ahead
Given the current technical readings and fundamental backdrop, the outlook for WTI crude oil next week remains cautiously bullish, with potential for consolidation. The strong daily trend and the current price holding above $100.94 provide a solid foundation for further upside. However, the overbought conditions on shorter timeframes and the geopolitical uncertainties create a degree of volatility. Traders will be closely watching the key levels identified: immediate resistance at $106.34 and support at $100.77. A decisive move above $106.34 could trigger a further rally towards $109.05 and potentially $111.91. Conversely, a failure to hold above $100.77 could lead to a pullback towards the $97.91 level.
The economic calendar also presents potential catalysts. While specific high-impact events for USD, EUR, and GBP were noted without precise dates, any significant data releases impacting inflation expectations or economic growth could influence oil prices. For instance, if upcoming US employment data or inflation figures suggest a potential slowdown in economic activity, it could dampen oil demand expectations and lead to a correction. Conversely, any news suggesting prolonged supply disruptions or stronger-than-expected global demand would likely fuel the bullish narrative further. The interplay between these macro factors and the ongoing geopolitical situation will be crucial in shaping price action.
Considering the mixed signals - strong daily trend versus overbought shorter-term indicators - a neutral scenario might also play out, characterized by range-bound trading as the market digests recent gains and awaits clearer direction. This would likely involve price action oscillating between the immediate support and resistance levels. The ADX values across timeframes also support this view; while the daily ADX is very high, the 4-hour ADX is significantly lower, suggesting a lack of strong directional conviction on that intermediate timeframe. This choppy price action could be an opportunity for range traders but presents challenges for breakout strategies.
Bearish Scenario: Profit-Taking and Trend Exhaustion
30% ProbabilityNeutral Scenario: Consolidation Above $100.94
40% ProbabilityBullish Scenario: Momentum Continues
30% ProbabilityNavigating Volatility: What the Indicators Are Telling Us
The technical indicators provide a multifaceted view of WTI's market dynamics. On the daily timeframe, the ADX reading of 57.34 is exceptionally high, indicating a very strong and committed trend. This is a powerful signal that the current upward move has significant conviction behind it. However, the RSI at 67.11 is approaching the overbought threshold, suggesting that the pace of the rally might moderate. The Stochastic indicator on the daily chart (K=39.39, D=46.4) shows a bearish crossover, hinting at a potential short-term pullback even within the strong daily trend.
On the 4-hour chart, the picture is less clear-cut regarding trend strength. The ADX at 14.31 suggests a weak trend or consolidation phase, which contrasts sharply with the daily chart's conviction. This implies that while the longer-term trend is bullish, the intermediate timeframe might be experiencing a pause. The Stochastic here is in overbought territory (K=96.6, D=84.09), flashing a strong warning sign for immediate upside potential. The MACD on the 4-hour chart shows positive momentum, aligning with the price action, but the overbought Stochastic tempers immediate bullish expectations.
The 1-hour chart presents the most immediate cautionary signals. The RSI at 80.39 is deeply in overbought territory, and the Stochastic is also flashing extreme overbought readings. This suggests that intraday traders might be looking to exit positions or book profits, potentially leading to downward pressure. The ADX at 29.47 still indicates a strong trend, but combined with the extreme RSI and Stochastic, it points to a market that may be extended in the short term. The MACD on this timeframe shows positive momentum, but the extreme readings on other oscillators suggest that this momentum might be unsustainable without a brief correction.
The confluence of these indicators suggests a market that is strongly trending upwards on a daily basis, but showing signs of being extended on shorter timeframes. This often leads to periods of consolidation or minor pullbacks as the market attempts to rebalance. The key will be whether any pullback finds support at the identified levels, particularly around the $100.94 mark and the daily support at $100.77. A sustained hold above these levels would validate the bullish thesis, while a decisive break below could signal a more significant correction.
| Indicator | Value | Signal | Interpretation |
|---|---|---|---|
| RSI (14) | 67.11 | Neutral | Approaching overbought on daily, but strong momentum |
| MACD Histogram | -0.13 | Bearish | Negative momentum on daily chart, but positive on shorter frames |
| Stochastic | K=39.39, D=46.4 | Bearish Crossover | Suggests potential short-term pullback despite strong trend |
| ADX | 57.34 | Very Strong Trend | Confirms a powerful and committed upward move on the daily chart |
| Bollinger Bands | Middle Band Breakout | Bullish | Price trading above the middle band, indicating bullish bias |
Frequently Asked Questions: WTI Analysis
What happens if WTI breaks below $100.77 support this week?
A break below the daily support at $100.77 would invalidate the immediate bullish outlook and could trigger a move towards the next significant support level at $97.91. This would indicate that the market is correcting more deeply, potentially due to profit-taking or shifting fundamental news.
Should I buy WTI at current levels near $100.94 given the strong daily trend?
Buying at current levels carries risk due to overbought conditions on shorter timeframes. A more prudent approach might be to wait for a pullback towards support levels like $100.77 or confirmation of a breakout above immediate resistance at $106.34. Patience could be rewarded with a better risk-reward setup.
Is the daily RSI at 67.11 a sell signal for WTI right now?
An RSI of 67.11 on the daily chart indicates strong bullish momentum but is not yet definitively overbought. While it suggests the rally is maturing, it doesn't necessarily signal an immediate sell. A move above 70 would increase the probability of a pullback, but the strong ADX reading still favors the trend's continuation for now.
How will geopolitical tensions in the Middle East affect WTI prices this week?
Heightened geopolitical tensions in the Middle East are a primary driver for WTI's current surge, adding a significant risk premium. Any further escalation or credible threat to oil supply could push prices higher, potentially targeting resistance levels above $106.34. Conversely, signs of de-escalation could lead to profit-taking and a price correction.
The energy markets are currently dominated by supply-side concerns and geopolitical risks, creating a potent cocktail for sustained upward price pressure on WTI. While technical indicators on shorter timeframes suggest a period of consolidation or minor pullback is possible, the underlying daily trend remains exceptionally strong. The ability of WTI to hold above the $100.94 level will be critical in the coming days. Traders should remain vigilant, manage risk diligently, and await clear signals confirming either the continuation of the bullish trend or a more significant correction. Patience and discipline are key in navigating these volatile waters; the market always offers opportunities for those who wait for the right setup.
Track markets in real-time
AI-powered analysis, technical indicators and real-time price data.
Join Our Telegram Channel
Breaking market news, AI analysis and trading signals instantly.
Join Channel