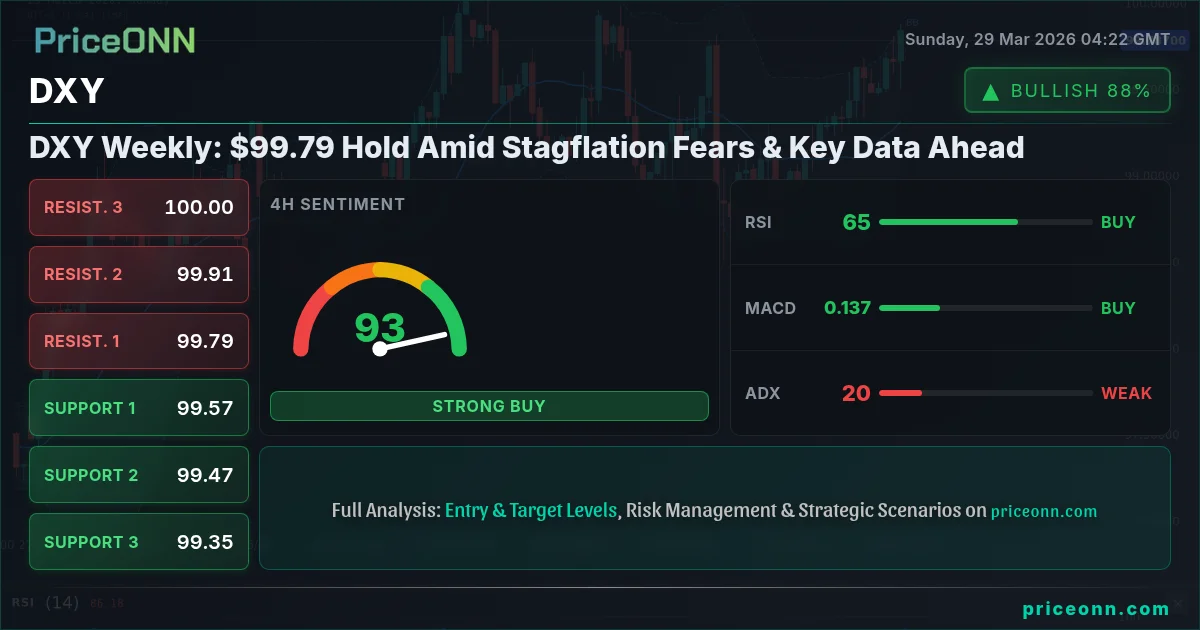
DXY Weekly: $99.79 Hold Amid Stagflation Fears & Key Data Ahead
The Dollar Index (DXY) holds at $99.79. With stagflation fears rising and key economic data on the horizon, the outlook remains crucial for currency markets.
The US Dollar Index (DXY) closed last week hovering around the critical $99.79 mark, a level that has become a focal point for traders and analysts alike. As we step into a new trading week, the narrative is dominated by escalating stagflation fears and a packed economic calendar, creating a complex backdrop for the greenback. Having navigated a volatile period, the DXY's ability to hold this psychological threshold will be paramount in determining its trajectory in the coming days and weeks. This analysis delves into the technical underpinnings, fundamental drivers, and potential scenarios shaping the DXY's path forward, offering a comprehensive outlook for currency market participants.
- The DXY is currently trading at $99.79, a key psychological level that held firm last week.
- Stagflation fears, driven by rising oil prices ($110.33 for Brent) and Treasury yields, are increasing demand for the dollar as a safe haven.
- Technical indicators present a mixed picture: ADX at 19.8 suggests a ranging market, while RSI at 62.23 points to bullish momentum.
- Upcoming economic data releases from the US, particularly employment figures, will be critical in shaping the DXY's direction.
The Shifting Sands of Market Sentiment
Last week was a stark reminder of how quickly market narratives can evolve. The resurgence of stagflation fears, a grim combination of stagnant economic growth and rising inflation, has cast a long shadow over global financial markets. Brent crude prices surged past $110, and WTI followed suit, breaking the $100 barrier. This surge in energy prices, often a bellwether for inflation, has economists and traders revisiting the painful lessons of the 1970s. The implications are far-reaching, potentially forcing central banks into a difficult balancing act between controlling inflation and avoiding a deep recession. In this environment, the US dollar, traditionally seen as a safe-haven asset, often finds itself in demand. The DXY's current position at $99.79 is therefore being closely watched as a barometer of this risk aversion and the market's confidence in the US economic outlook relative to its global peers.
The correlation between rising oil prices and a strengthening dollar is not always straightforward, but when 'stagflation' enters the lexicon, the dollar's appeal as a store of value often increases. The news that oil prices have soared by over 50% in March underscores the severity of the energy shock. While higher energy costs can be a drag on economic growth, they also contribute to inflationary pressures. This creates a dilemma for the Federal Reserve, which has been signaling a data-dependent approach to monetary policy. If inflation proves 'sticky,' as some Fed officials have suggested, it could necessitate a more aggressive stance, potentially supporting the dollar. However, if growth falters significantly, the Fed might be forced to pivot, which could weigh on the greenback. The market is currently grappling with these competing forces, making the $99.79 level on the DXY a critical pivot point.
Furthermore, the geopolitical landscape remains a significant, albeit unpredictable, driver. Tensions in the Middle East continue to simmer, raising alarms about potential global energy shortages. Reports of the US administration considering a near $1 billion offer to TotalEnergies to cease its offshore wind projects, while seemingly counterintuitive, highlight the complex energy policy decisions being made amidst global instability. The potential for energy rationing, as warned by the IEA, adds another layer of uncertainty. In such scenarios, the dollar often benefits from its safe-haven status, attracting capital flight from more volatile regions or assets. This backdrop of rising energy costs, inflation concerns, and geopolitical jitters provides a potent cocktail of factors that could bolster the DXY, provided the US economy itself doesn't show signs of severe distress.
The Technical Picture: A Crossroads at $99.79
From a technical standpoint, the DXY is at a fascinating juncture. The 1-hour chart paints a picture of consolidation, with the ADX hovering around 19.8, indicating a lack of strong directional momentum. This suggests that while there's underlying strength, the market is in a holding pattern, awaiting clearer signals. The RSI(14) at 62.23, however, leans bullish, suggesting that buyers still have some conviction. The Stochastic Oscillator, with %K at 82.65 and %D at 71.11, is in overbought territory, hinting at potential selling pressure if the index attempts to push higher without significant fundamental catalysts. On this shorter timeframe, support is seen at 99.73, 99.61, and 99.54, while resistance lies at 99.92, 99.99, and 100.11.
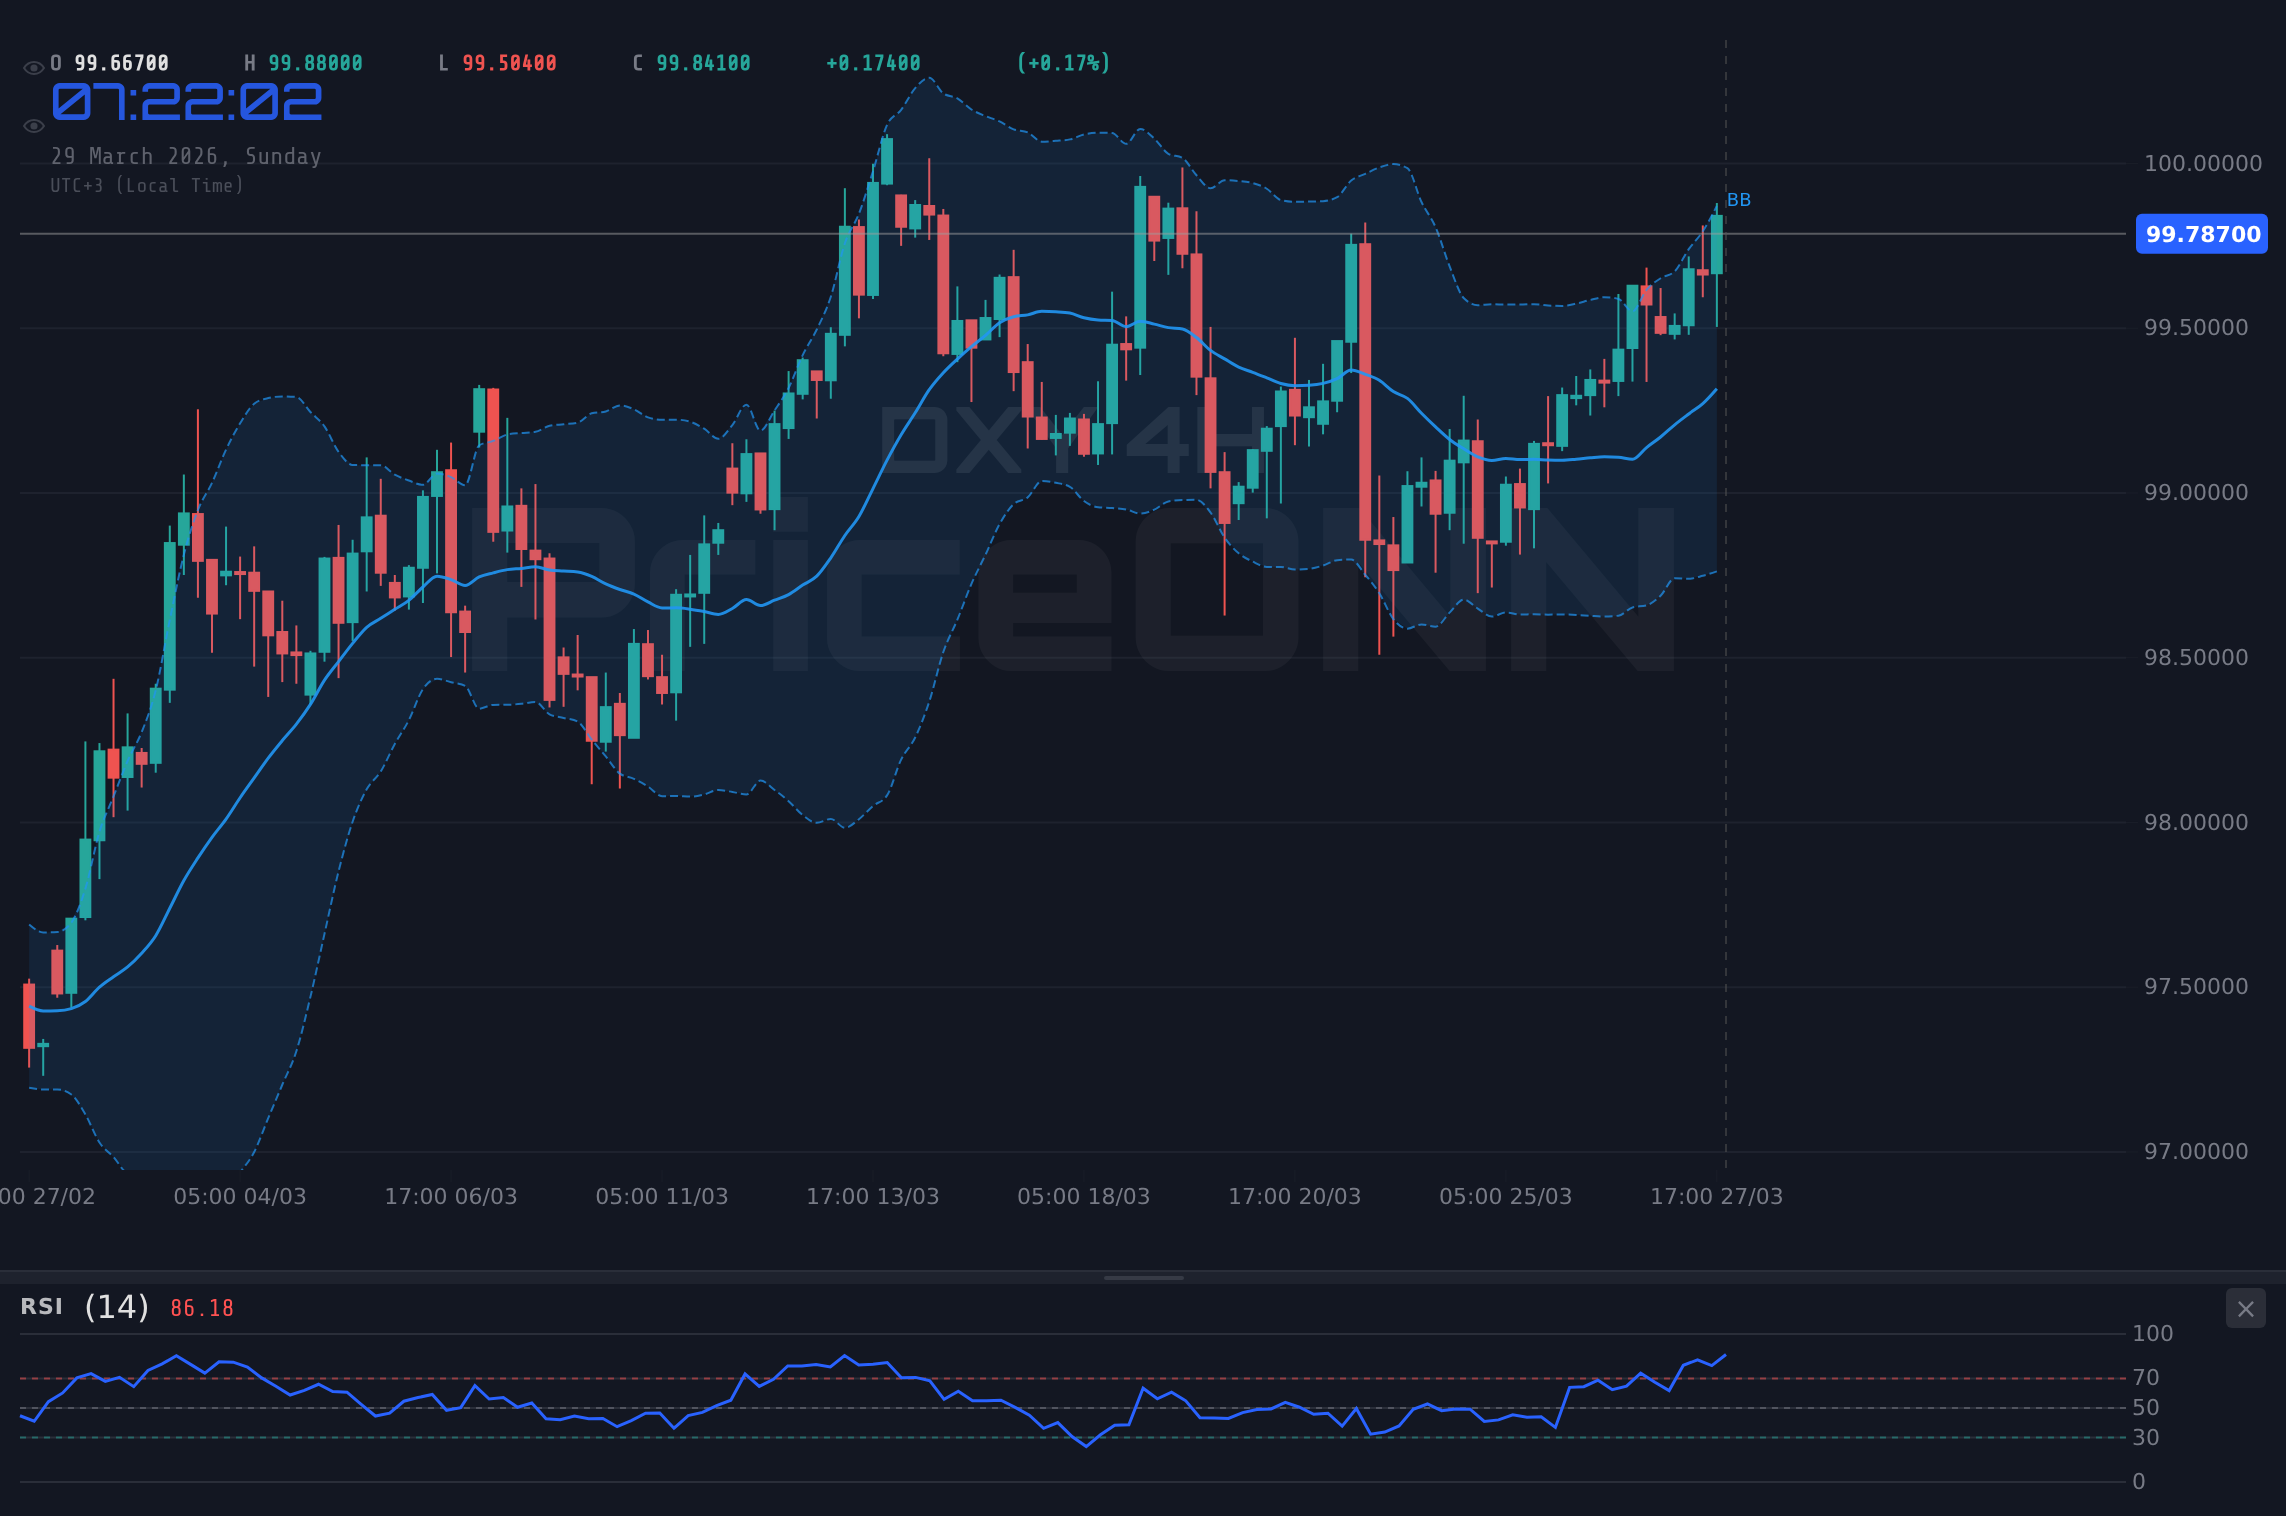
Stepping back to the 4-hour timeframe, the trend analysis shifts to 'Bullish' with a strength of 95%. This suggests that the longer-term momentum might be in favor of the bulls, despite the choppiness seen on the hourly chart. The RSI(14) here sits at 64.9, reinforcing the bullish sentiment, while the Stochastic Oscillator (%K: 83.75, %D: 81.25) remains firmly in overbought territory, signaling caution against chasing immediate upside. The ADX at 19.8 still indicates a relatively weak trend, which could mean that any upward move might face significant headwinds or reversals. Support levels are identified at 99.57, 99.47, and 99.35, with resistance points at 99.79, 99.91, and 100. These levels are crucial; a hold above 99.79 on this timeframe could pave the way for further gains, while a break below could signal a deeper correction.
The daily chart offers the most compelling bullish signal, with the trend categorized as 'Bullish' and strength at 96%. The RSI(14) is at 60.77, firmly in bullish territory but not yet overextended. The MACD is showing positive momentum, with the MACD line above the signal line, and the histogram is positive. The ADX reading of 31.93 confirms a strong uptrend. This daily picture suggests that the underlying strength of the dollar remains intact, despite the short-term fluctuations. Key resistance levels on the daily chart are at 99.76, 99.95, and 100.21. A decisive break and hold above the 100.00 psychological level would be a significant bullish confirmation, potentially opening the door for a move towards higher targets. Conversely, support is located at 99.31, 99.05, and 98.86; a failure to hold these levels could invalidate the bullish thesis.
The Economic Calendar: Data-Driven Decisions Ahead
The upcoming week is packed with high-impact economic data releases that could significantly sway the DXY. While the provided economic calendar data is sparse, we can infer the importance of certain releases based on typical market focus. The mention of a 'high impact' USD event with 'Actual: 210 | Forecast: 211 | Previous: 205' suggests a Non-Farm Payrolls (NFP) or similar employment report. Coming in slightly below forecast, this figure, if it represents NFP, indicates a minor cooling in the labor market. However, the actual number (210) is still robust, and the previous reading (205) shows consistent job growth. This data, if accurate, would likely be interpreted as dollar-neutral to slightly USD-negative, but not enough to derail the broader bullish trend if other factors remain supportive.
The absence of forecast data for many other USD, EUR, and GBP releases highlights a potential lack of immediate market-moving news from those specific events. However, the general context of rising oil prices and inflation concerns means that any deviation from expectations in upcoming data will be amplified. For instance, if inflation figures (not detailed here but implied by the stagflation narrative) were to come in higher than forecast, it could strengthen the dollar by reinforcing the possibility of a more hawkish Fed stance. Conversely, any signs of significant economic slowdown, such as weak PMI or GDP figures, could put pressure on the DXY, even with rising oil prices, as it would raise recessionary fears.
The market's reaction to these data points will be crucial. For the DXY to sustain its upward momentum, it will need strong economic readings, particularly from the US labor market and inflation indicators. A weaker-than-expected employment report coupled with rising inflation could create the dreaded stagflation scenario, which, while initially supportive of the dollar due to safe-haven flows, could eventually lead to recessionary fears and pressure the Fed to reconsider its tightening path. The interplay between these data points and the Fed's reaction function will be the central theme for the DXY in the coming weeks. Traders will be dissecting every number for clues about the future path of interest rates and the relative health of the US economy.
Geopolitical Undercurrents and Their Impact on the Dollar
The persistent geopolitical tensions, particularly in the Middle East, continue to be a significant undercurrent in the global financial markets. As highlighted by recent news, the potential for energy shortages and even rationing is a growing concern, with Brent crude prices soaring past $110. This instability naturally elevates the demand for safe-haven assets, and the US dollar is often the primary beneficiary. While the exact impact is hard to quantify, the general trend of heightened global risk tends to favor the dollar, especially when the US economy itself is not directly threatened by the conflict. The narrative of the dollar as a safe harbor gains traction when uncertainty prevails elsewhere.
The broader implications of rising oil prices extend beyond immediate inflation concerns. They can impact global trade, consumer spending, and corporate profitability across various sectors. For example, the increased cost of flights and packages, driven by the oil surge, affects consumer prices indirectly. This ripple effect can slow down economic activity, a factor that central banks must consider. If global growth falters significantly due to these energy shocks, it could lead to a 'risk-off' environment where investors flock to perceived safe assets like the dollar, US Treasuries, and gold. This dynamic currently supports the DXY around the $99.79 level.
The interplay between geopolitical events and economic data is complex. While Middle East tensions might support the dollar through safe-haven demand, a severe global economic slowdown triggered by these events could eventually undermine the dollar if it leads to a significant downturn in the US. The market will be watching closely to see if the current strength in oil prices translates into sustained inflation that forces the Fed into a more aggressive tightening cycle, or if it tips the global economy into a recession, prompting a reassessment of monetary policy. The DXY's ability to hold $99.79 suggests that, for now, the safe-haven bid is outweighing recessionary concerns, but this balance could shift rapidly.
Scenario Analysis: Navigating the DXY's Path Forward
Bullish Scenario: Dollar Strength Prevails
65% ProbabilityNeutral Scenario: Range-Bound Trading
25% ProbabilityBearish Scenario: Dollar Weakness Emerges
10% ProbabilityThe most probable scenario, given the current confluence of factors, leans towards continued bullishness, albeit with potential for consolidation. The daily chart presents a strong uptrend, reinforced by robust ADX readings and bullish RSI momentum. The primary trigger for this scenario is the DXY holding above the $99.79 level and subsequently breaking through the psychological 100.00 mark, potentially reaching towards the R3 daily resistance at 100.21. This would be fueled by strong US economic data, particularly employment figures, that reinforce expectations of a hawkish Federal Reserve. In this environment, the dollar would benefit from safe-haven flows and interest rate differentials.
However, the path is unlikely to be a straight line. The 1-hour and 4-hour charts show signs of consolidation and overbought conditions, particularly from the Stochastic Oscillator. This suggests that a period of range-bound trading is plausible, especially if upcoming data is mixed or slightly below expectations. The neutral scenario, with the DXY consolidating between 99.30 and 100.20, carries a 25% probability. This would occur if key resistance levels fail to break and support levels hold, leading to indecision as the market awaits clearer directional cues. Such a scenario could be characterized by volatility within the range, with potential 'stop hunts' at the extremes.
The bearish scenario, while currently carrying only a 10% probability, cannot be entirely dismissed. A decisive break below the daily support at 99.31, and more critically, below 98.86 (S3 Daily support), would signal a significant shift in market sentiment. This could be triggered by unexpectedly weak US economic data that raises recession fears, or a dovish pivot from the Federal Reserve. In such a case, the dollar could face considerable selling pressure, potentially targeting 98.50 and then the 98.00 support zone. This outcome appears less likely given the current geopolitical backdrop and the dollar's traditional safe-haven appeal, but it remains a tail risk that traders must monitor.
What to Watch This Week
The coming week presents several key catalysts that will likely dictate the DXY's direction. Firstly, monitoring the price action around the 100.00-100.21 resistance zone is paramount. A sustained break above this level, confirmed by strong volume and follow-through buying, would validate the bullish scenario. Conversely, a failure to break this resistance and a subsequent move below the 99.50-99.30 support area could signal a shift towards the neutral or even bearish outlook.
Secondly, upcoming economic data releases, particularly any employment or inflation figures, will be critical. While specific details were limited in the provided data, the context of stagflation fears implies that any data deviating significantly from expectations will be amplified. Strong US data could cement the bullish case, while weak data might introduce doubt and support the neutral or bearish scenarios. Traders should pay close attention to the actual vs. forecast numbers and the market's immediate reaction.
Finally, geopolitical developments cannot be ignored. Any escalation or de-escalation of tensions in the Middle East could trigger significant safe-haven flows. While currently supportive of the dollar, a sudden easing of geopolitical risks could paradoxically lead to some dollar weakness as risk appetite returns to other markets. Monitoring news headlines related to energy supply and major global conflicts will remain essential for understanding the broader market sentiment influencing the DXY.
| Indicator | Value | Signal | Interpretation |
|---|---|---|---|
| RSI (14) | 62.23 | Bullish | Suggests upward momentum, but nearing overbought territory on shorter timeframes. |
| MACD Histogram | Positive | Bullish | Positive momentum supports the bullish trend on daily charts. |
| Stochastic | %K: 82.65, %D: 71.11 | Overbought/Sell | On 1H, signals potential pullback or consolidation due to extreme levels. |
| ADX | 19.8 | Neutral/Weak Trend | Indicates choppiness and lack of strong directional commitment on shorter timeframes. |
| Bollinger Bands | Middle Band Breakout | Bullish | Price is above the middle band, suggesting upward bias on 1H/4H. |
Frequently Asked Questions: DXY Analysis
What happens if DXY breaks decisively above the 100.21 resistance level this week?
A sustained close above 100.21, the R3 daily resistance, would strongly validate the bullish scenario. This could trigger a move towards the 100.95 target, driven by continued safe-haven demand and hawkish Fed expectations. It would signal a significant commitment to the uptrend.
Should I consider buying DXY at current levels of $99.79 given the RSI at 62.23?
Buying at $99.79 requires careful risk management. While the RSI at 62.23 suggests bullish momentum, the Stochastic Oscillator is in overbought territory on shorter timeframes, indicating potential for a pullback. A confirmation above 100.00 or a clear hold of 99.50 support would offer a better risk/reward entry.
Is the ADX at 19.8 a sell signal for DXY right now?
No, an ADX of 19.8 is not a direct sell signal; it indicates a weak or ranging trend. This suggests that the market lacks strong directional conviction, making breakouts less reliable. It implies that price action may be choppy, and traders should wait for stronger trend confirmation before committing to a position.
How will upcoming employment data affect DXY this week, given stagflation fears?
Stronger-than-expected US employment figures could reinforce hawkish Fed expectations, supporting the DXY towards 100.21. Conversely, weaker data might fuel stagflation fears and potentially lead to dollar weakness if it suggests significant economic slowdown, testing support levels below 99.31.
Navigating the DXY's path requires a keen eye on both technical signals and the evolving macroeconomic landscape. While the dollar index holds at a critical juncture around $99.79, the confluence of rising stagflation fears, geopolitical uncertainty, and a crucial economic data calendar creates a dynamic environment. The technical picture, with its mixed signals across different timeframes, suggests that a decisive move is imminent. The bullish scenario, supported by daily trend strength and safe-haven demand, appears most probable, targeting levels above 100.00. However, the possibility of consolidation or even a reversal cannot be ruled out, especially if upcoming data disappoints or geopolitical risks subside unexpectedly.
Track markets in real-time
AI-powered analysis, technical indicators and real-time price data.
Join Our Telegram Channel
Breaking market news, AI analysis and trading signals instantly.
Join Channel