Nasdaq100 Analysis: Bears Eye $22,834 Support at $22,916.77
Nasdaq100 analysis at $22,916.77: Bears eye $22,834 support as RSI dips and MACD shows negative momentum. Is a breakdown imminent?
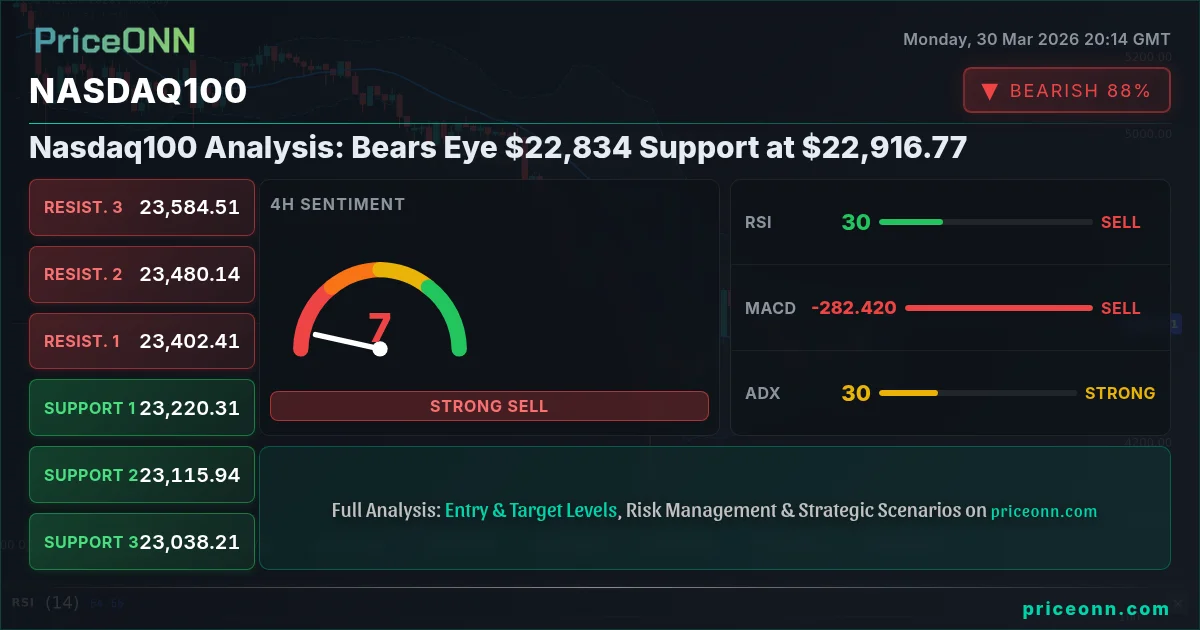
The Nasdaq 100 is currently teetering at a critical juncture, trading at $22,916.77. After a significant sell-off that saw the tech-heavy index plunge 12.5% from its January peak, the bears are sharpening their claws, eyeing the $22,834 support level. This isn't just a number on a chart; it represents a significant psychological and technical barrier that, if breached, could signal further downside. The question on every trader's mind is whether this level will hold, or if the current downtrend will accelerate. Understanding the interplay between technical indicators, broader market sentiment, and geopolitical undercurrents is key to navigating this volatile landscape.
- The Nasdaq 100 is trading at $22,916.77, with bears targeting the $22,834 support level.
- RSI at 31.03 on the 1H chart signals bearish pressure, while the MACD histogram shows negative momentum.
- Critical support sits at $22,834.13 (1D), tested implicitly by the current price action.
- The correlation with a strengthening DXY (100.32) and falling SP500 (6,335.70) suggests a risk-off environment is pressuring tech stocks.
The past few days have been a stark reminder of market fragility. The Nasdaq 100 has entered correction territory, a term that sends shivers down the spine of even seasoned investors. This sharp decline, attributed partly to escalating geopolitical tensions and their impact on inflation, has put the $22,834 support level firmly in focus. On the 1-day chart, this level represents a significant floor, a price point where buying interest has historically emerged. However, the current momentum, as indicated by several technical indicators, suggests that this support might be under severe threat. The question isn't just about price; it's about the underlying forces driving this market sentiment.
Looking at the 1-hour chart, the picture is decidedly bearish. The Relative Strength Index (RSI) hovers at 31.03, deep in the oversold territory but still showing a downward eğilimi (tendency). This suggests sellers are in control, and while a bounce is possible, the underlying pressure remains downwards. The Moving Average Convergence Divergence (MACD) further reinforces this bearish outlook, with its histogram firmly in negative territory and the MACD line below the signal line. This indicates waning bullish momentum and strengthening bearish sentiment. The Bollinger Bands are also showing price trading below the middle band, a classic sign of a downtrend in this timeframe. The ADX at 25.01 indicates a strong downtrend is in play, suggesting that the current move has conviction behind it.
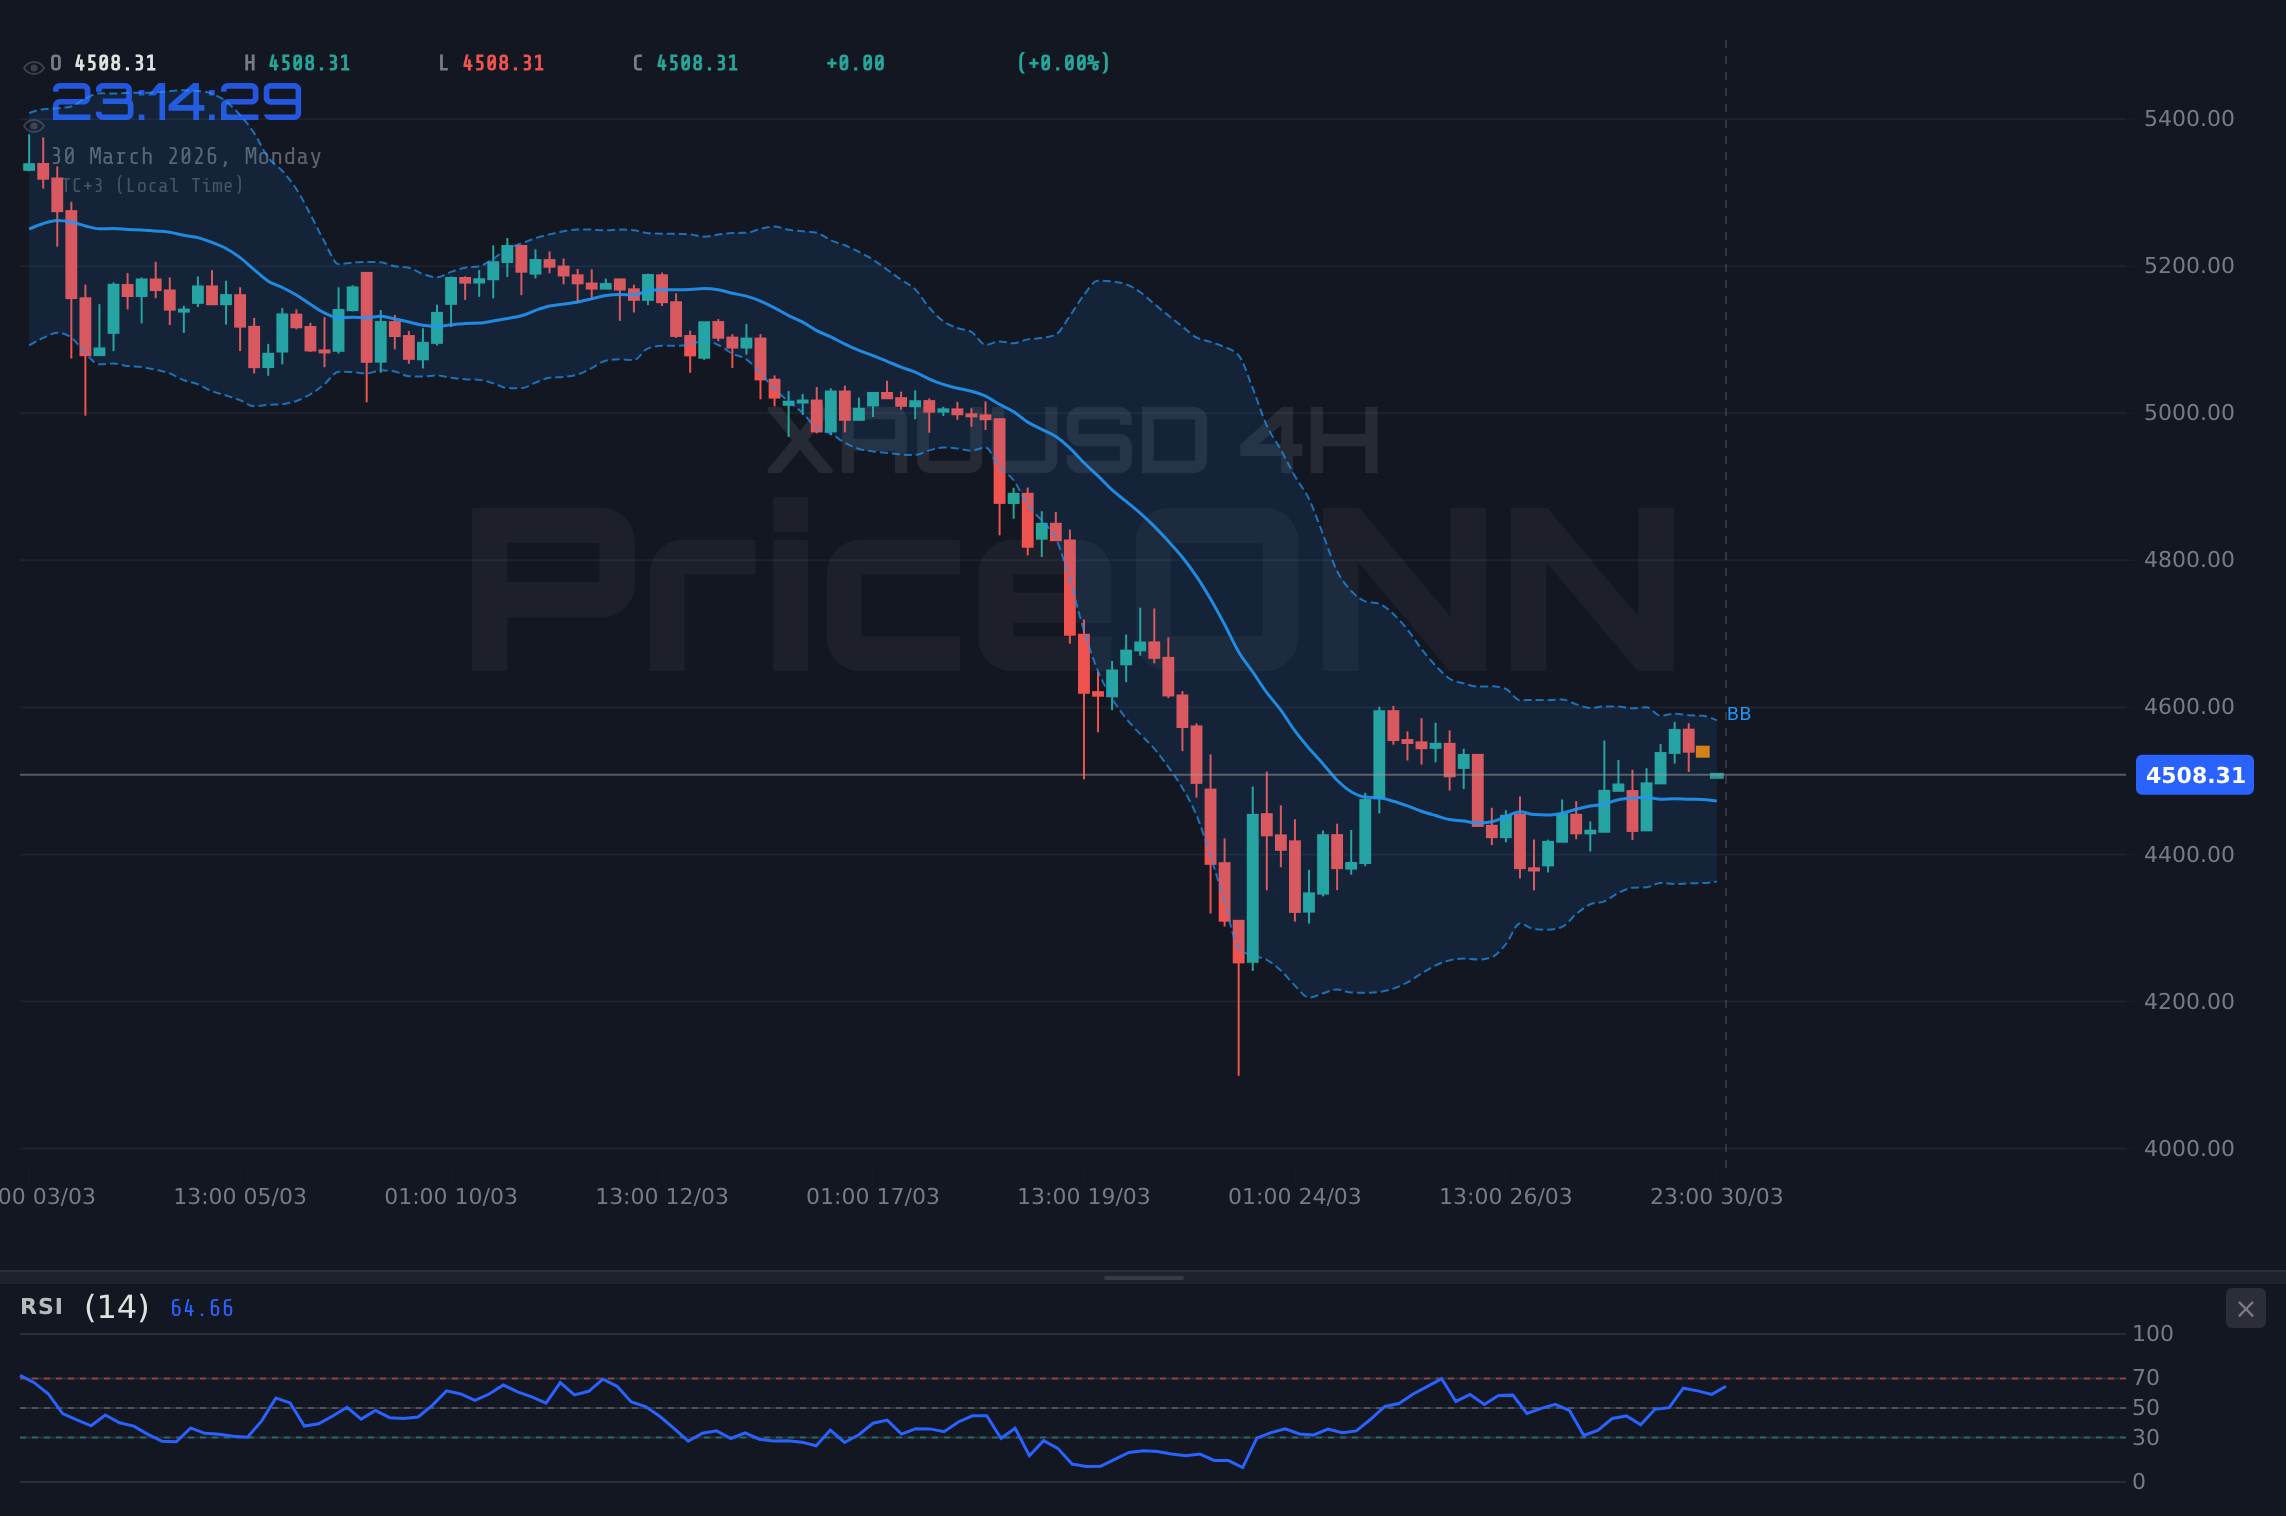
The 4-hour timeframe offers a slightly nuanced, yet still predominantly bearish, perspective. Here, the RSI is at 30.1, still signaling oversold conditions, but the trend is clearly downwards. The MACD continues to show negative momentum, confirming the weakness seen on the shorter timeframe. While Stochastic shows a potential for a bounce (K=29.34, D=17.92, K > D), the overall ADX at 29.94 confirms a strong bearish trend. This confluence of indicators across multiple short-to-medium term timeframes suggests that any rallies are likely to be met with selling pressure, making the $22,834 support level a key battleground.
Zooming out to the daily chart ($22,916.77 current price), the trend is unequivocally bearish, with a strength of 100%. The RSI at 27.14 is deeply oversold, a condition that often precedes a bounce, but it's crucial to remember that oversold can become more oversold. The MACD is negative, and the Bollinger Bands are firmly below the middle band, indicating significant selling pressure. The ADX reading of 47.22 is exceptionally high, confirming a very strong downtrend. While the Stochastic shows a potential bullish signal (K=2.12, D=25.54, K < D), it's in extreme oversold territory and needs significant confirmation. This daily chart paints a picture of a market in a strong downward trajectory, where the $22,834.13 support is the next major hurdle.
The broader market context cannot be ignored. The US Dollar Index (DXY) is showing strength, currently at 100.32, which typically exerts downward pressure on risk assets like tech stocks. A rising dollar often implies a 'risk-off' sentiment, as investors move towards perceived safe havens. This is further corroborated by the performance of major equity indices. The S&P 500 is trading at 6,335.70, down 0.34%, and the Nasdaq 100's tech-heavy nature makes it particularly vulnerable in such an environment. The Dow Jones Industrial Average, while currently showing a slight uptick, is still in a bearish trend on the daily chart, indicating a general cautiousness across the stock market.
Geopolitical tensions are also playing a significant role. News reports indicate escalating conflicts in the Middle East, pushing oil prices higher. Brent crude is surging past $112.39, and WTI is at $105.18. This rise in energy prices fuels inflation concerns, which in turn can lead to tighter monetary policy expectations or simply a dampening of consumer and corporate spending. The German inflation data, projected to spike due to energy costs, further adds to the global inflationary picture, potentially forcing the ECB's hand and impacting the Euro. This macro backdrop creates headwinds for growth-sensitive assets like the Nasdaq 100.
The correlation between the Nasdaq 100 and its technical indicators is currently painting a consistent bearish narrative. The combination of a weakening RSI, negative MACD momentum, and price action below the Bollinger Bands across multiple timeframes strongly suggests that downward pressure is likely to persist. The ADX values, particularly the daily reading of 47.22, highlight the strength of the current bearish trend. While every asset class experiences cycles, the current technical setup on the Nasdaq 100 points towards a challenging period for bulls. The $22,834 level is not just a support; it's a psychological line in the sand.
Given this technical and fundamental backdrop, the market appears to be pricing in further weakness. The $22,834.13 support level on the daily chart is the immediate focus. A decisive close below this level would likely trigger stop-loss orders and accelerate selling, potentially opening the path towards the next significant support at $22,576.58. Conversely, if $22,834 holds, we might see a short-covering rally, but the broader bearish trend would need to be challenged by stronger buying conviction and a shift in momentum indicators.
The strength of the current downtrend, as evidenced by the high ADX values across timeframes, means that any potential bounce needs to be treated with caution. It's not uncommon to see sharp, albeit temporary, rallies within a larger downtrend. Traders should be looking for confirmation signals, such as a clear break above immediate resistance levels and a shift in momentum indicators towards positive territory, before considering long positions. The current price action at $22,916.77 suggests that caution is the prudent approach.
The interplay between the US Dollar Index (DXY) at 100.32 and the Nasdaq 100's performance is a key area to watch. A strong DXY often correlates inversely with tech stocks. If the dollar continues its ascent, it will likely add further pressure to the Nasdaq. Similarly, the performance of the S&P 500 at 6,335.70, which is also under pressure, indicates a broader risk-off sentiment that is detrimental to growth-oriented assets. This interconnectedness highlights the importance of a holistic market view rather than focusing solely on one asset.
The historical context also provides some perspective. Major tech indices have experienced significant corrections before, often driven by shifts in monetary policy, macroeconomic shocks, or geopolitical events. While past performance is not indicative of future results, understanding how the Nasdaq 100 has reacted to similar conditions in the past can offer valuable insights into potential price behavior. The current situation, marked by high inflation fears and geopolitical instability, presents a challenging environment for equities.
The immediate path forward for the Nasdaq 100 hinges on its ability to defend the $22,834.13 support. A failure to do so could lead to a rapid descent towards $22,576.58. On the flip side, a strong rebound from current levels, coupled with a shift in momentum indicators and a weakening dollar, could signal a short-term bottom. However, the prevailing trend and market sentiment strongly suggest that bears have the upper hand for now.
The ongoing geopolitical tensions, particularly in the Middle East, continue to be a significant wildcard. Any escalation could further fuel inflation concerns, impact global supply chains, and increase demand for safe-haven assets, potentially weighing on growth stocks. Conversely, a de-escalation could lead to a relief rally across risk assets. Traders must remain vigilant and adapt their strategies to evolving news flow.
The technical indicators on the daily chart present a mixed bag, but the overall trend strength leans heavily bearish. While the RSI is deeply oversold at 27.14, and Stochastic is showing a potential reversal signal, the extremely high ADX of 47.22 cannot be ignored. This suggests that the current downtrend is powerful and may require more than just an oversold reading to reverse. Confirmation of a bottom will likely require a sustained break above key resistance levels and a bullish crossover in momentum indicators like the MACD.
The price action around $22,916.77 is crucial. If the index fails to hold this immediate level and drifts towards $22,834.13, the probability of a further decline increases significantly. Traders should be looking for clear price action signals confirming either a bounce or a breakdown. Relying solely on one indicator can be misleading; therefore, a confluence of signals across multiple timeframes and indicators provides a more robust basis for decision-making.
The current market environment demands discipline and patience. Chasing falling knives is a dangerous game, and attempting to catch a falling knife without clear confirmation can lead to substantial losses. While the oversold readings on some indicators might tempt traders to look for a bottom, the prevailing bearish trend and the strength of the sell-off suggest that waiting for more definitive signals is the prudent strategy. The $22,834 support level will be a key determinant of short-term price direction.
Understanding the potential impact of upcoming economic events is also vital. While specific high-impact events were not detailed for the immediate future in the provided data, the general market sentiment is influenced by inflation expectations and central bank policy. Any data releases that suggest persistent inflation or a more hawkish stance from central banks could further pressure indices like the Nasdaq 100.
The Nasdaq 100's current position at $22,916.77, with bears eyeing $22,834.13, represents a high-stakes moment. The technical indicators, broader market correlations, and geopolitical backdrop all lean towards caution. While oversold conditions offer a glimmer of hope for a bounce, the strength of the bearish trend suggests that downside risk remains elevated. Only a decisive break above key resistance levels, coupled with a confirmed shift in momentum, would signal a true reversal. Until then, risk management remains paramount.
Bearish Scenario: Breakdown Below Key Support
70% ProbabilityNeutral Scenario: Consolidation Above Support
20% ProbabilityBullish Scenario: Unexpected Bounce and Reversal
10% ProbabilityFrequently Asked Questions: Nasdaq100 Analysis
What happens if Nasdaq100 breaks below $22,834.13 support?
A decisive break below $22,834.13 on the daily chart would likely trigger further selling pressure, potentially accelerating the downtrend towards the $22,576.58 support level. This would invalidate any short-term bullish hopes and confirm the prevailing bearish sentiment.
Should I buy Nasdaq100 at current levels of $22,916.77 given the RSI at 31.03?
Buying at $22,916.77 when the 1H RSI is 31.03 is risky without further confirmation. While oversold, the trend remains bearish (ADX 25.01). A more prudent approach would be to wait for a confirmed bounce off $22,834.13 or a break above immediate resistance, indicating a potential trend shift.
Is the RSI at 27.14 a sell signal for Nasdaq100 on the daily chart?
An RSI of 27.14 on the daily chart indicates extreme oversold conditions, which is typically a signal for potential buying opportunities, not selling. However, in a strong downtrend (ADX 47.22), oversold conditions can persist. It's a signal to watch for a potential reversal, but not an immediate sell signal itself.
How will the strengthening DXY at 100.32 affect Nasdaq100 this week?
A strengthening DXY at 100.32 typically exerts downward pressure on risk assets like the Nasdaq 100. This inverse correlation suggests that if the dollar continues to rise, it could hinder any attempts by the Nasdaq to bounce back, potentially reinforcing the bearish trend.
Track markets in real-time
AI-powered analysis, technical indicators and real-time price data.
Join Our Telegram Channel
Breaking market news, AI analysis and trading signals instantly.
Join Channel