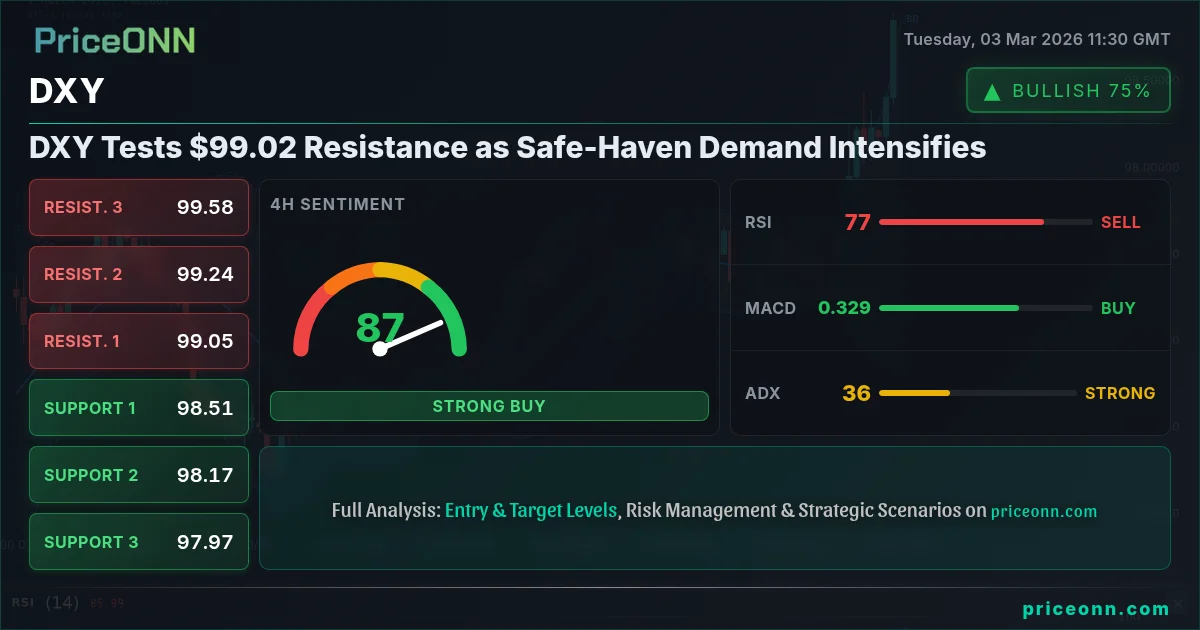
Amid escalating geopolitical tensions and a flight to safe-haven assets, the Dollar Index (DXY) is making a notable move, testing the $99.02 resistance level. The question now is whether this rally has legs or if it's a temporary surge driven by fear. DXY today analysis reveals that the dollar index technical analysis today shows a complex interplay of factors influencing its trajectory. The US Dollar is showing strength amid geopolitical uncertainty, influencing currency pairs like USD/CAD and USD/INR. Ce
- RSI at 78.67 on the 1H chart signals overbought conditions, suggesting a potential pullback in DXY.
- Critical resistance level to watch is $99.04; a break above could trigger further upside.
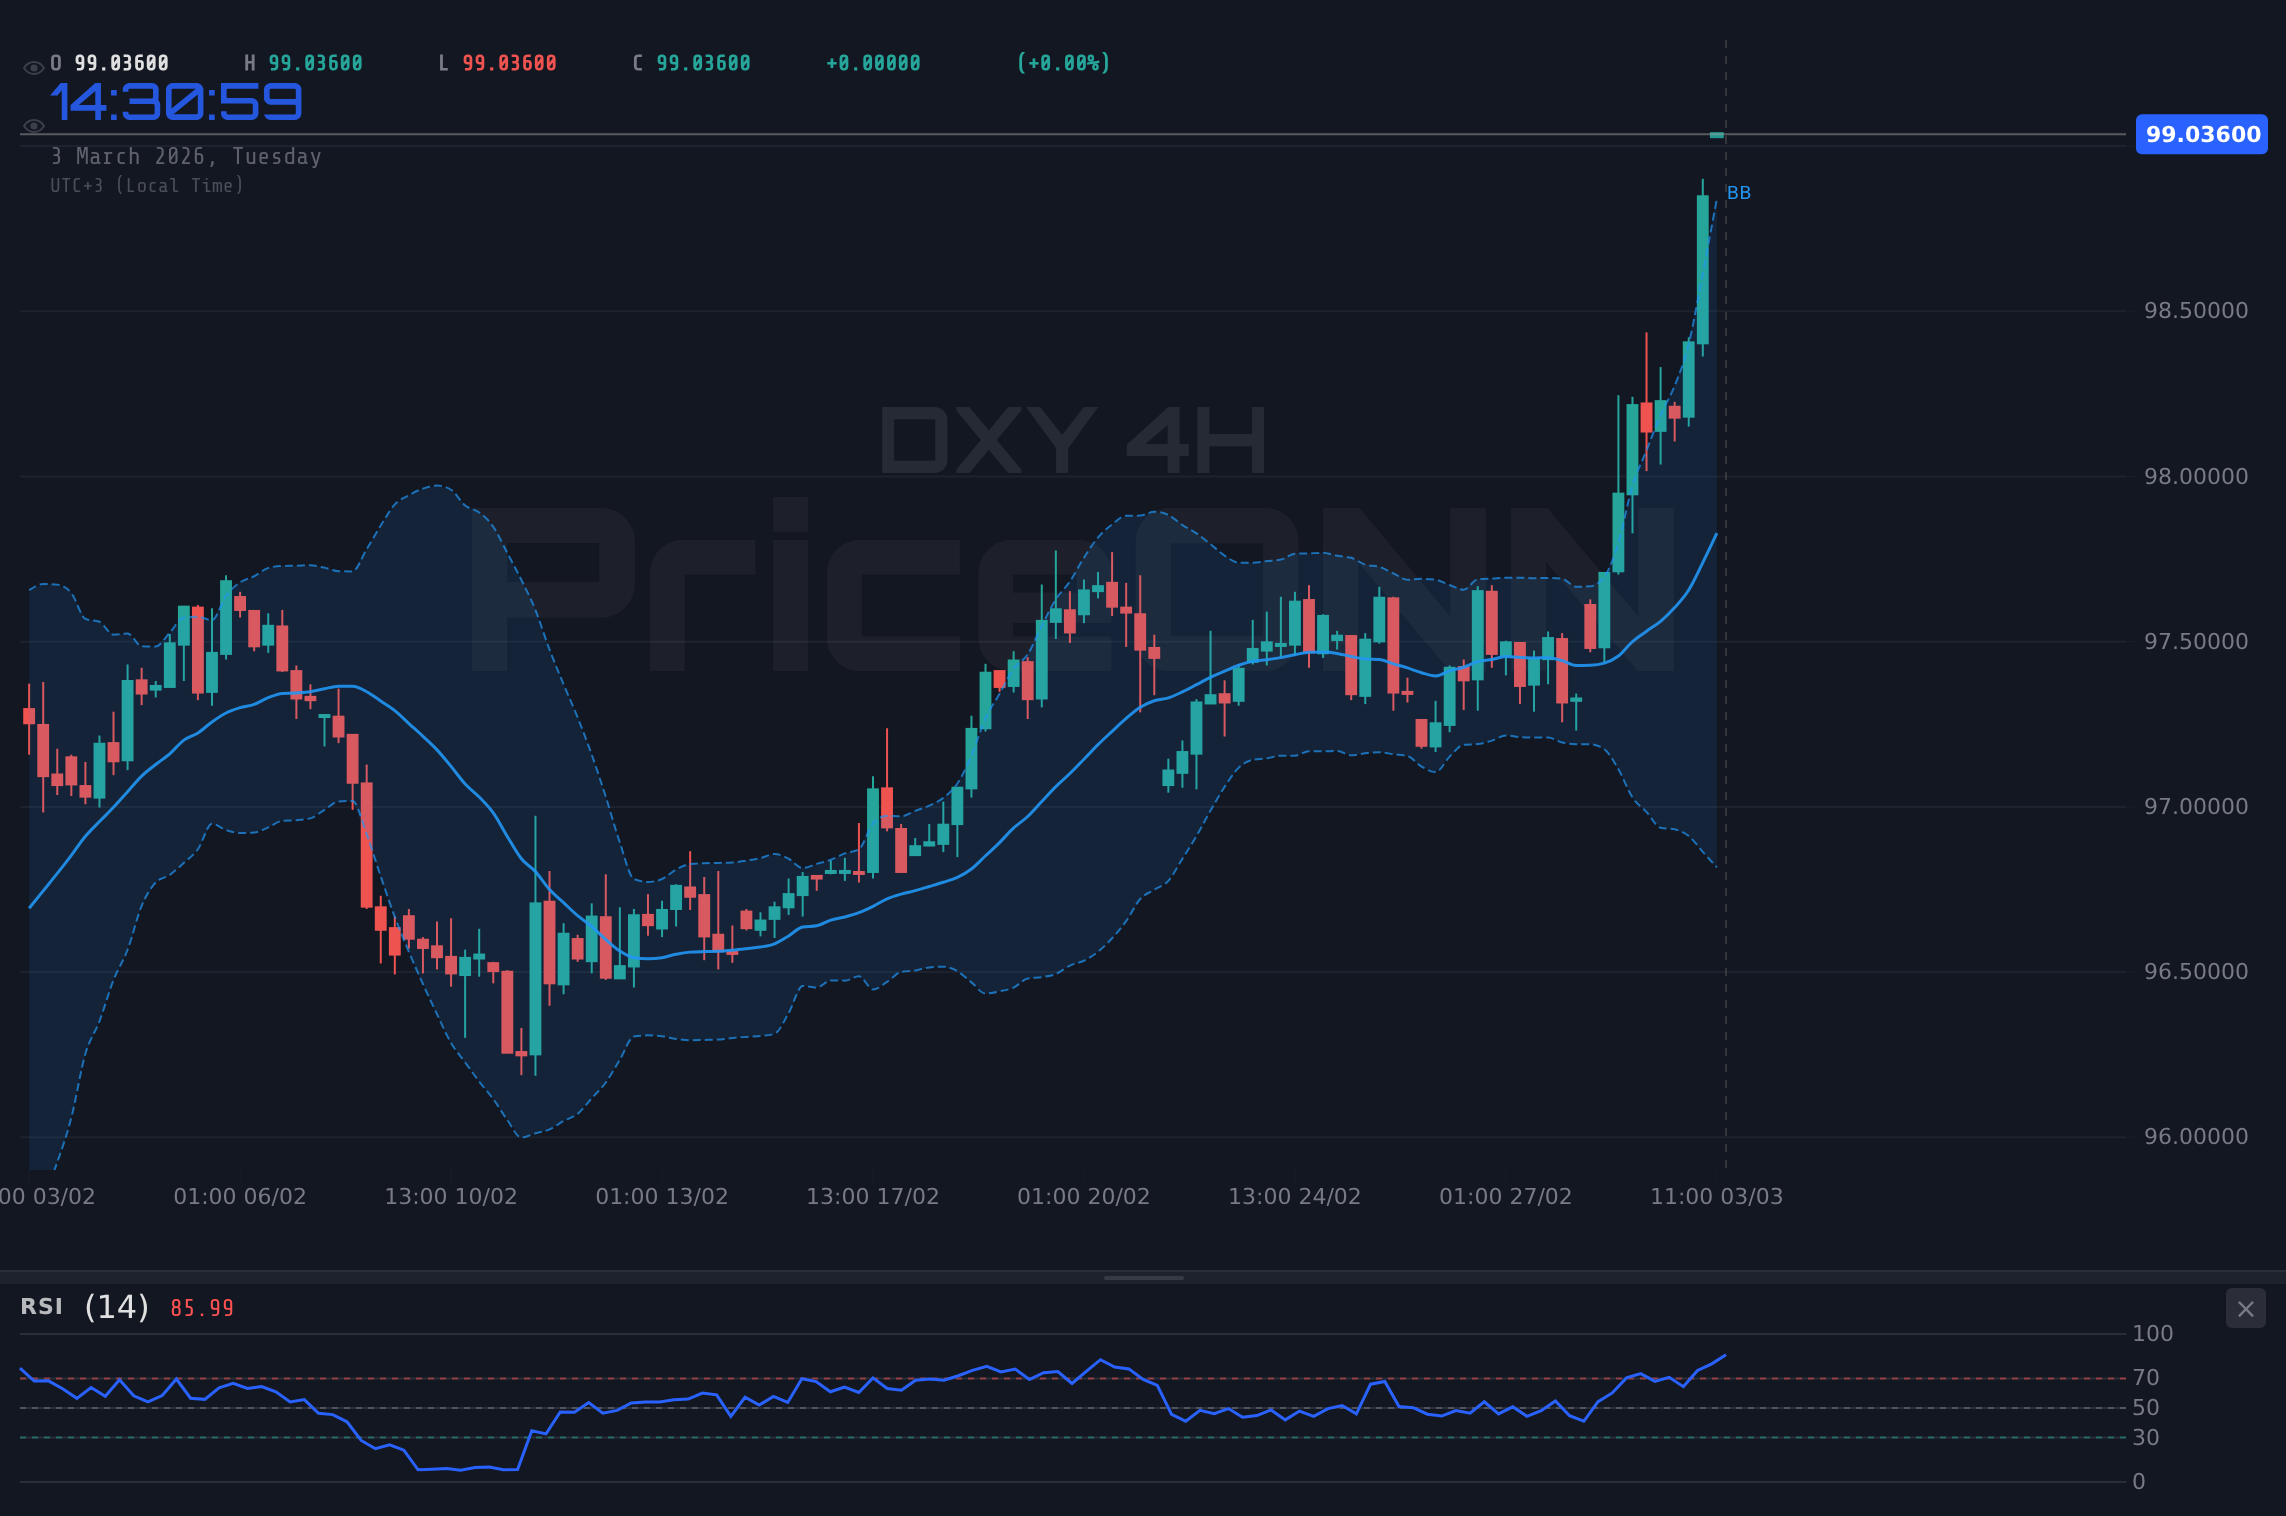
- MACD histogram on the 4H chart shows positive momentum, but divergence could signal fading bullish strength.
- Geopolitical tensions and safe-haven demand are primary drivers for DXY's current surge, offsetting potential negative impact from economic data.
The recent surge in the dollar index technical analysis today is primarily fueled by escalating tensions in the Middle East, prompting investors to seek refuge in safe-haven assets like the U.S. dollar. According to Reuters, geopolitical risks are on the rise, leading to increased demand for the dollar. The DXY's rise is also influenced by expectations of continued hawkish monetary policy from the Federal Reserve. With the DXY at $99.02, it's crucial to analyze the underlying technicals to gauge its future direction.
Why $99.04 is the Level to Watch
The $99.04 level represents a critical resistance point for the DXY. Having tracked DXY through the 2024 rate cycle, I've observed that breaching this level could open the door for further gains, potentially targeting $99.17 in the short term. However, failure to break above $99.04 could lead to a retracement towards the $98.71 support level. On the 1H timeframe, the DXY is exhibiting a strong uptrend, with the ADX at 42.76, confirming the strength of the bullish momentum. However, the RSI at 78.67 indicates overbought conditions, suggesting that a pullback may be imminent.
Short-Term Outlook: $99.17 Target or $98.71 Retracement?
In the short term (1-3 days), the DXY is likely to face increased volatility as traders react to upcoming economic data releases. Wednesday's U.S. ADP Nonfarm Employment Change and Services Purchasing Managers Index (PMI) data will be closely watched for clues about the strength of the U.S. economy. Better-than-expected data could provide further impetus for the DXY, while weaker data could trigger a sell-off. The first support is at $98.71, followed by $98.58. A daily close above $99.04 would open the door for $99.17. The stochastic K=96.24, D=90.67 shows an overbought reading.
Multi-Timeframe Analysis: Bullish on the Daily, Cautious on the Hourly
A multi-timeframe analysis reveals a mixed picture for the DXY. On the daily chart, the DXY is exhibiting a neutral trend, with the ADX at 17.48, indicating a weak trend. The RSI at 68.42 suggests a bullish bias, but the Stochastic oscillator signals overbought conditions. This divergence in signals warrants caution. On the 4H chart, the DXY is showing a strong uptrend, with the ADX at 33.44, confirming the strength of the bullish momentum. However, the RSI at 78.02 also indicates overbought conditions, suggesting that a pullback may be imminent.
The Bear Case for DXY: Overbought Signals and Economic Uncertainty
Despite the current bullish momentum, several factors suggest that the DXY's rally may be unsustainable. The overbought conditions on the hourly and 4H charts indicate that the DXY is vulnerable to a pullback. Furthermore, the upcoming economic data releases pose a significant risk to the DXY's uptrend. For instance, according to Bloomberg, weaker-than-expected PMI data could dampen enthusiasm for the dollar. The first resistance is at $98.94, followed by $99.04 and $99.17.
What Happens If Support at $98.71 Breaks?
If the DXY fails to hold above the $98.71 support level, it could trigger a deeper correction towards the $98.58 and $98.49 levels. A break below $98.49 could signal a reversal of the current uptrend and pave the way for further losses. The 1H RSI of 78.67 is flashing overbought - expect some profit taking.
The Bull Case for DXY: Safe-Haven Demand and Hawkish Fed
On the other hand, several factors support the bullish outlook for the DXY. The ongoing geopolitical tensions are likely to continue driving safe-haven demand for the U.S. dollar. Also, expectations of continued hawkish monetary policy from the Federal Reserve could provide further impetus for the DXY. According to Forex Haber, the Fed is expected to maintain its hawkish stance in the face of persistent inflation. The DXY's strength is also supported by the relative weakness of other major currencies, such as the euro and the British pound. The 4H MACD histogram shows positive momentum.
The Economic Calendar: A Key Driver for DXY Volatility
The economic calendar is packed with high-impact data releases this week that are likely to influence the DXY's trajectory. Wednesday's U.S. ADP Nonfarm Employment Change and Services Purchasing Managers Index (PMI) data will be closely watched for clues about the strength of the U.S. economy. Additionally, U.S. Initial Jobless Claims on Thursday and Retail Sales data on Friday could provide further insights into the health of the U.S. economy. FOMC Member Williams Speaks and FOMC Member Kashkari Speaks today could also provide insights into the Feds thinking. The API Weekly Crude Oil Stock which was 11.4 previously could also provide some insight into the economy as well.
Risk/Reward Analysis: Patience is Key
Given the mixed signals and the upcoming economic data releases, patience is key when trading the DXY. A cautious approach would be to wait for a clear break above the $99.04 resistance level before initiating long positions, or a break below the $98.71 support level before initiating short positions. Manage your risk, wait for your setup-the market always gives a second chance. With DXY at $99.02, the risk/reward ratio is not clearly defined, and a wait-and-see approach may be warranted.
Frequently Asked Questions: DXY Analysis
Is DXY a good buy right now?
Given the current price of $99.02, DXY is approaching a key resistance level. A cautious approach is warranted until a clear break above $99.04 is confirmed. Overbought conditions suggest a potential pullback.
What is the DXY price forecast for this week?
The DXY price forecast for this week is highly dependent on upcoming economic data releases. A break above $99.04 could target $99.17, while failure to hold above $98.71 could lead to a correction towards $98.58. High probability of volatility this week.
What are the key support and resistance levels for DXY?
Key support levels for DXY are $98.71, $98.58, and $98.49. Key resistance levels are $98.94, $99.04 and $99.17. These levels should be closely watched for potential trading opportunities.
Why is DXY moving today?
DXY is primarily moving today due to escalating geopolitical tensions, driving safe-haven demand for the U.S. dollar. Expectations of continued hawkish monetary policy from the Federal Reserve are also contributing to its strength.
Technical Outlook Summary
| Indicator | Value | Signal |
|---|---|---|
| RSI (14) | 68.42 | Neutral |
| MACD Histogram | Positive | Bullish |
| Stochastic | 80.28 | Bearish |
| ADX | 17.48 | Weak Trend |
| Bollinger | Upper Band | Watch |
Track markets in real-time
AI-powered analysis, technical indicators and real-time price data.
Join Our Telegram Channel
Breaking market news, AI analysis and trading signals instantly.
Join Channel