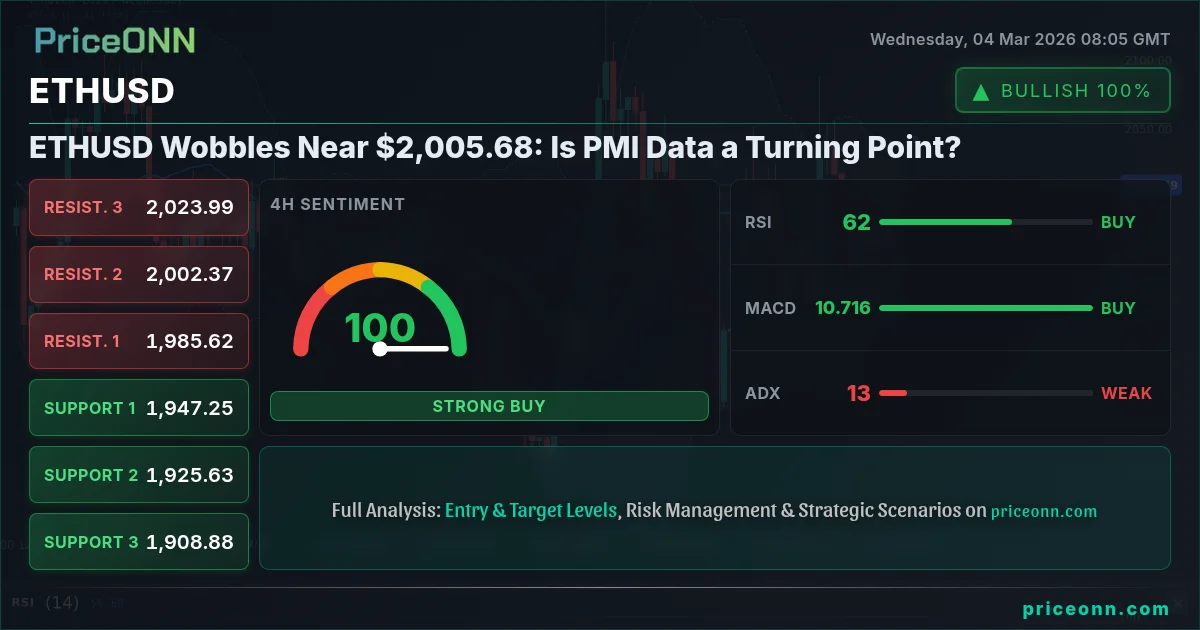
ETHUSD is currently trading near $2,005.68, and after tracking ETHUSD through the ebbs and flows of the market, one thing is clear: this current neutrality is unlikely to last. The question now is whether upcoming PMI data will be the catalyst that finally breaks this impasse. Having tracked ETHUSD through the 2024 rate cycle, this current pattern reminds me of the calm before the storm - a period of consolidation before a significant directional move.
- ETHUSD is trading near $2,005.68, awaiting a catalyst for directional movement.
- Key support lies at $1,964.23, a level tested multiple times in the past week.
- The Stochastic oscillator on the 1H chart signals a potential bullish move with K=68.4 and D=44.81.
- Upcoming PMI data is expected to heavily influence ETHUSD's correlation with the DXY.
ETHUSD: Calm Before the Storm?
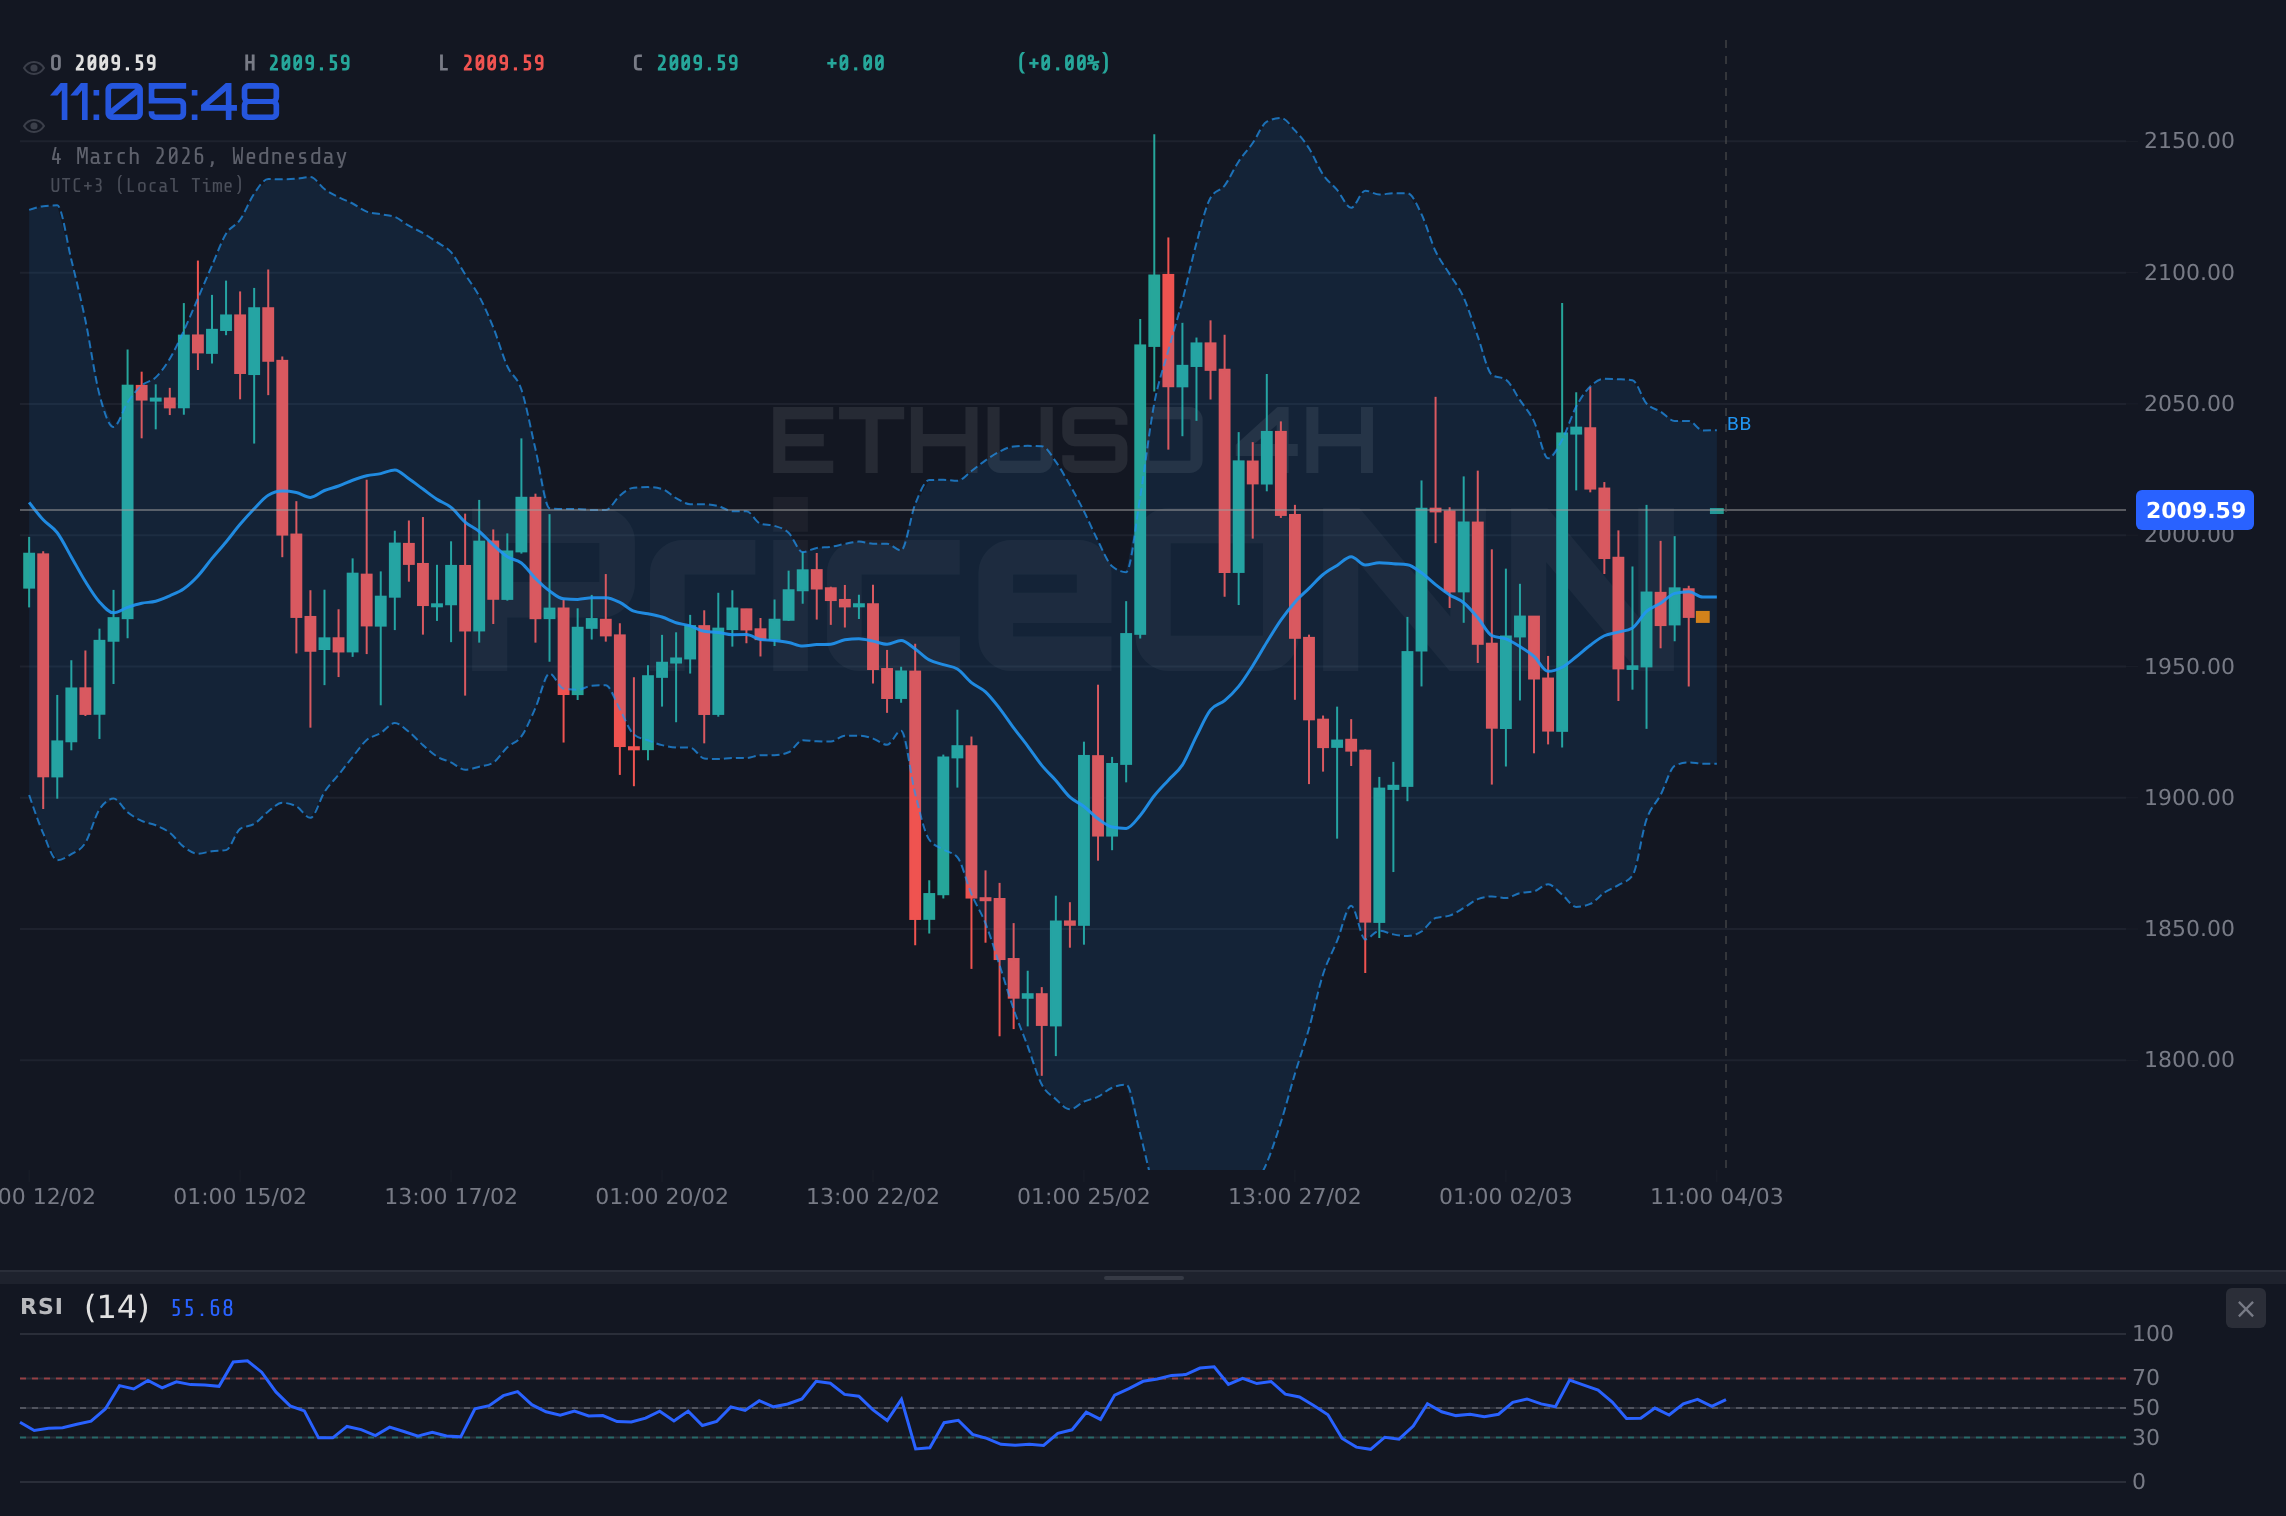
The current market sentiment surrounding ETHUSD can best be described as cautious optimism. While the daily chart indicates a neutral trend, the hourly chart paints a slightly more bullish picture. The price action is range-bound, oscillating between $1,942.37 and $2,007.74. This consolidation phase often precedes a significant breakout, and the direction of this breakout will likely be determined by the upcoming economic data releases, specifically the PMI figures. It's important to remember that markets rarely move in straight lines; pullbacks and consolidations are a natural part of the process. The key is to identify the underlying trend and position oneself accordingly.
Technical Signals: A Mixed Bag
A deep dive into the technical indicators reveals a mixed bag of signals. On the hourly timeframe, the RSI sits at 60, indicating neither overbought nor oversold conditions. This suggests that the bulls and bears are currently in equilibrium. However, the MACD histogram shows positive momentum, hinting at a potential bullish crossover. The ADX, however, presents a different story. With a value of 10.97, the ADX indicates a weak trend, suggesting that the current consolidation phase may continue for some time. A weak-trend reading like this means the breakout hasn't committed yet - it could go either way. It's crucial to remember that no single indicator is foolproof; it's essential to consider multiple indicators in conjunction to gain a more comprehensive understanding of the market.
Key Levels to Watch: Support and Resistance
Identifying key support and resistance levels is crucial for any ETHUSD trader. On the hourly chart, immediate support lies at $1,964.23. A break below this level could pave the way for a test of the next support level at $1,950.55. On the upside, immediate resistance is at $1,988.01. A decisive break above this level could trigger a rally towards the next resistance level at $1,998.11. These levels are not arbitrary; they represent areas where buyers and sellers have historically shown a strong presence. For scalpers, these levels can provide opportunities for quick in-and-out trades. Swing traders, on the other hand, may use these levels to identify potential entry and exit points for longer-term positions.
The PMI Data Wildcard: A Fundamental Perspective
While technical analysis provides valuable insights into price action, it's crucial to consider the fundamental drivers behind market movements. In the case of ETHUSD, the upcoming PMI data releases are expected to play a significant role in determining the pair's direction. The recent forex news indicates that geopolitical risks are driving Euro inflation concerns, impacting the EURUSD pair. Given ETHUSD's correlation with other risk assets, any significant shift in risk sentiment could have a ripple effect on the cryptocurrency. The forex news also indicates that the NZD/USD pair is under pressure amid China data and geopolitical risks, which could further influence the risk sentiment in the broader market.
DXY and ETHUSD: An Inverted Relationship
The DXY (Dollar Index) often exhibits an inverse relationship with ETHUSD. A strengthening dollar typically puts downward pressure on ETHUSD, while a weakening dollar tends to support the cryptocurrency. Currently, the DXY stands at 98.72, with an overall bullish trend on the 1H, 4H, and 1D timeframes, according to the current market data. This potentially signals the risk of downward pressure on ETHUSD. This means that traders need to pay close attention to any shifts in the DXY's trajectory. A decisive break above 98.77 on the DXY could signal further dollar strength, potentially triggering a sell-off in ETHUSD. Conversely, a pullback below 98.54 could provide some relief for ETHUSD bulls.
Scalpers, Swing Traders, and Long-Term Investors: What to Watch For
Different types of traders have different strategies and time horizons. Scalpers, who aim to profit from small price movements, should focus on the hourly chart and key support and resistance levels. Swing traders, who hold positions for several days or weeks, should pay attention to the daily chart and the overall trend. Long-term investors, who are less concerned with short-term fluctuations, should focus on the fundamental drivers of ETHUSD and the long-term outlook for the cryptocurrency market. For scalpers, the immediate resistance at $1,988.01 and support at $1,964.23 are crucial levels to watch. Swing traders should monitor the daily trend and look for potential entry points on pullbacks. Long-term investors should consider the long-term growth potential of Ethereum and the potential impact of regulatory developments.
Historical Perspective: Echoes of the Past
Analysing ETHUSD's historical price action reveals recurring patterns. For instance, similar consolidation phases have often preceded significant breakouts. In early 2025, ETHUSD experienced a prolonged period of sideways movement before eventually breaking out to the upside. This historical precedent suggests that the current consolidation phase could also lead to a similar outcome. However, it's important to remember that past performance is not necessarily indicative of future results. The market is constantly evolving, and new factors can emerge to influence price action. Having tracked ETHUSD through the 2024 rate cycle, this current pattern reminds me of the calm before the storm - a period of consolidation before a significant directional move.
Geopolitical Tensions and Inflation: A Double-Edged Sword
The current geopolitical tensions and rising inflation are creating a complex environment for ETHUSD. On one hand, geopolitical uncertainty often drives demand for safe-haven assets, which could indirectly benefit cryptocurrencies like Ethereum. On the other hand, rising inflation could lead to tighter monetary policy from central banks, which could put downward pressure on risk assets like ETHUSD. The forex news highlights the impact of geopolitical tensions and inflation data on EURUSD and other currency pairs, which indirectly influences ETHUSD through its correlation with broader market sentiment. The key is to assess the relative strength of these competing forces and adjust one's trading strategy accordingly.
Navigating the Uncertainty: A Cautious Approach
In light of the current uncertainty surrounding ETHUSD, a cautious approach is warranted. Traders should avoid over-leveraging their positions and should always use stop-loss orders to limit potential losses. It's also crucial to stay informed about the latest economic data releases and geopolitical developments. The market is constantly evolving, and traders need to be adaptable and flexible in their approach. Remember, patience is often rewarded in the market. Waiting for the right setup and managing risk effectively are essential for long-term success.
Frequently Asked Questions: ETHUSD Analysis
Is ETHUSD a good buy right now?
Given ETHUSD's current price of $2,005.68 and the neutral signals across multiple timeframes, it's not a clear-cut buy. A decisive break above the $1,988.01 resistance level on the hourly chart could signal a potential buying opportunity, but caution is advised until a clear trend emerges.
What is the ETHUSD price forecast for this week?
The ETHUSD price forecast for this week is highly dependent on the upcoming PMI data. If the data is positive, we could see a rally towards $1,998.11 and potentially $2,011.79. However, if the data disappoints, we could see a pullback towards $1,964.23 and potentially $1,950.55.
What are the key support and resistance levels for ETHUSD?
Key support levels for ETHUSD are $1,964.23, $1,950.55, and $1,940.45. Key resistance levels are $1,988.01, $1,998.11, and $2,011.79. These levels represent areas where buyers and sellers have historically shown a strong presence.
Why is ETHUSD moving today?
ETHUSD's movement today is primarily driven by anticipation of the upcoming PMI data and overall risk sentiment in the market. Geopolitical tensions and inflation concerns are also playing a role, creating a complex environment for the cryptocurrency.
- ETHUSD is trading near $2,005.68, awaiting a catalyst for directional movement.
- Key support lies at $1,964.23, a level tested multiple times in the past week.
- The Stochastic oscillator on the 1H chart signals a potential bullish move with K=68.4 and D=44.81.
- Upcoming PMI data is expected to heavily influence ETHUSD's correlation with the DXY.
Volatility creates opportunity-those prepared will be rewarded. The market always gives a second chance, so manage your risk and wait for your setup.
Track markets in real-time
AI-powered analysis, technical indicators and real-time price data.
Join Our Telegram Channel
Breaking market news, AI analysis and trading signals instantly.
Join Channel