EURUSD is currently trading near $1.16, a level that has proven to be a stubborn pivot. The pair's inability to sustain a clear directional move reflects the current market's hesitancy amid mixed economic signals and persistent geopolitical risks. Will this consolidation phase end with a breakout, or will selling pressure intensify?
EURUSD Today Analysis: A Choppy Landscape
The "eurusd price prediction this week" hinges on several factors. The pair's movements are heavily influenced by economic data releases, central bank policies, and the overall risk sentiment in the market. Currently, the EURUSD is navigating a choppy landscape, with neither buyers nor sellers able to establish a sustained advantage. The lack of a clear trend is reflected in the technical indicators, which paint a mixed picture.
Why $1.16 is the Line in the Sand
The $1.16 level is critical for EURUSD. A sustained break above this mark could signal a renewed bullish sentiment, potentially targeting higher resistance levels. However, failure to hold above $1.16 may invite further selling pressure, pushing the pair towards lower support levels. As of today, the price action suggests indecision, with the market awaiting a catalyst to trigger a more decisive move.
Having tracked EURUSD through the 2024 rate cycle, it's clear that these consolidation periods often precede significant breakouts. The key is identifying the trigger. With the DXY at 98.59, EURUSD is under pressure, but not decisively so.
The Bear Case: Selling Pressure Persists
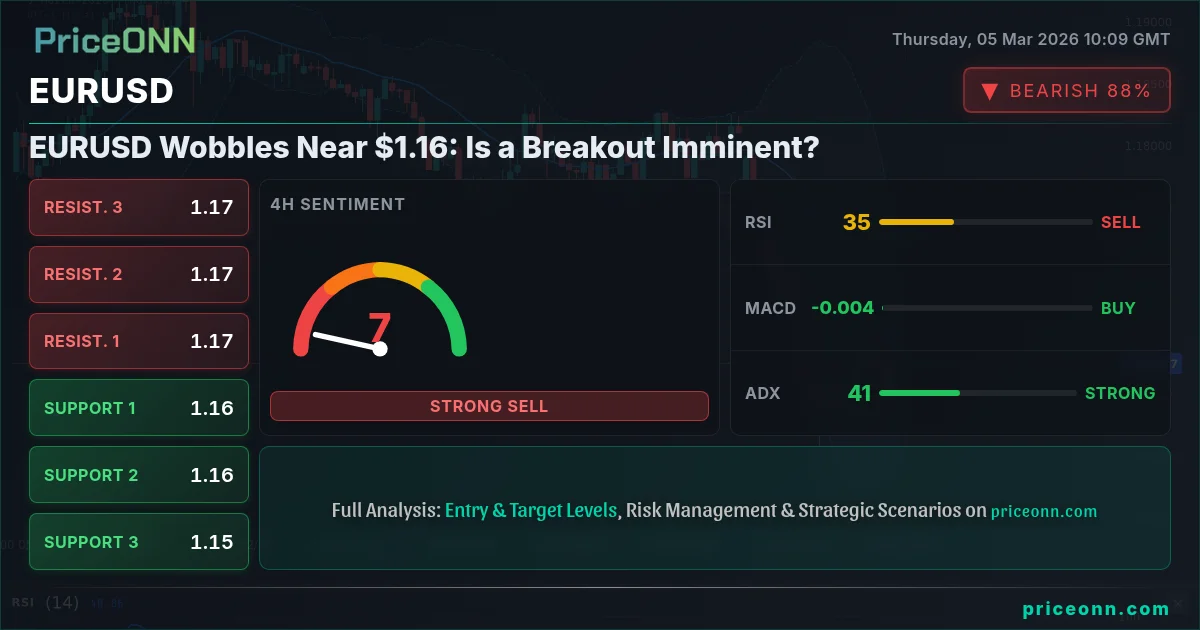
The bear case for EURUSD is predicated on several factors. First, the overall trend on the daily chart remains neutral, with a slight bearish bias. Second, the MACD histogram shows negative momentum, suggesting that selling pressure is still present. Third, the ADX at 22.95 indicates a moderate bearish trend, reinforcing the notion that sellers have a slight edge.
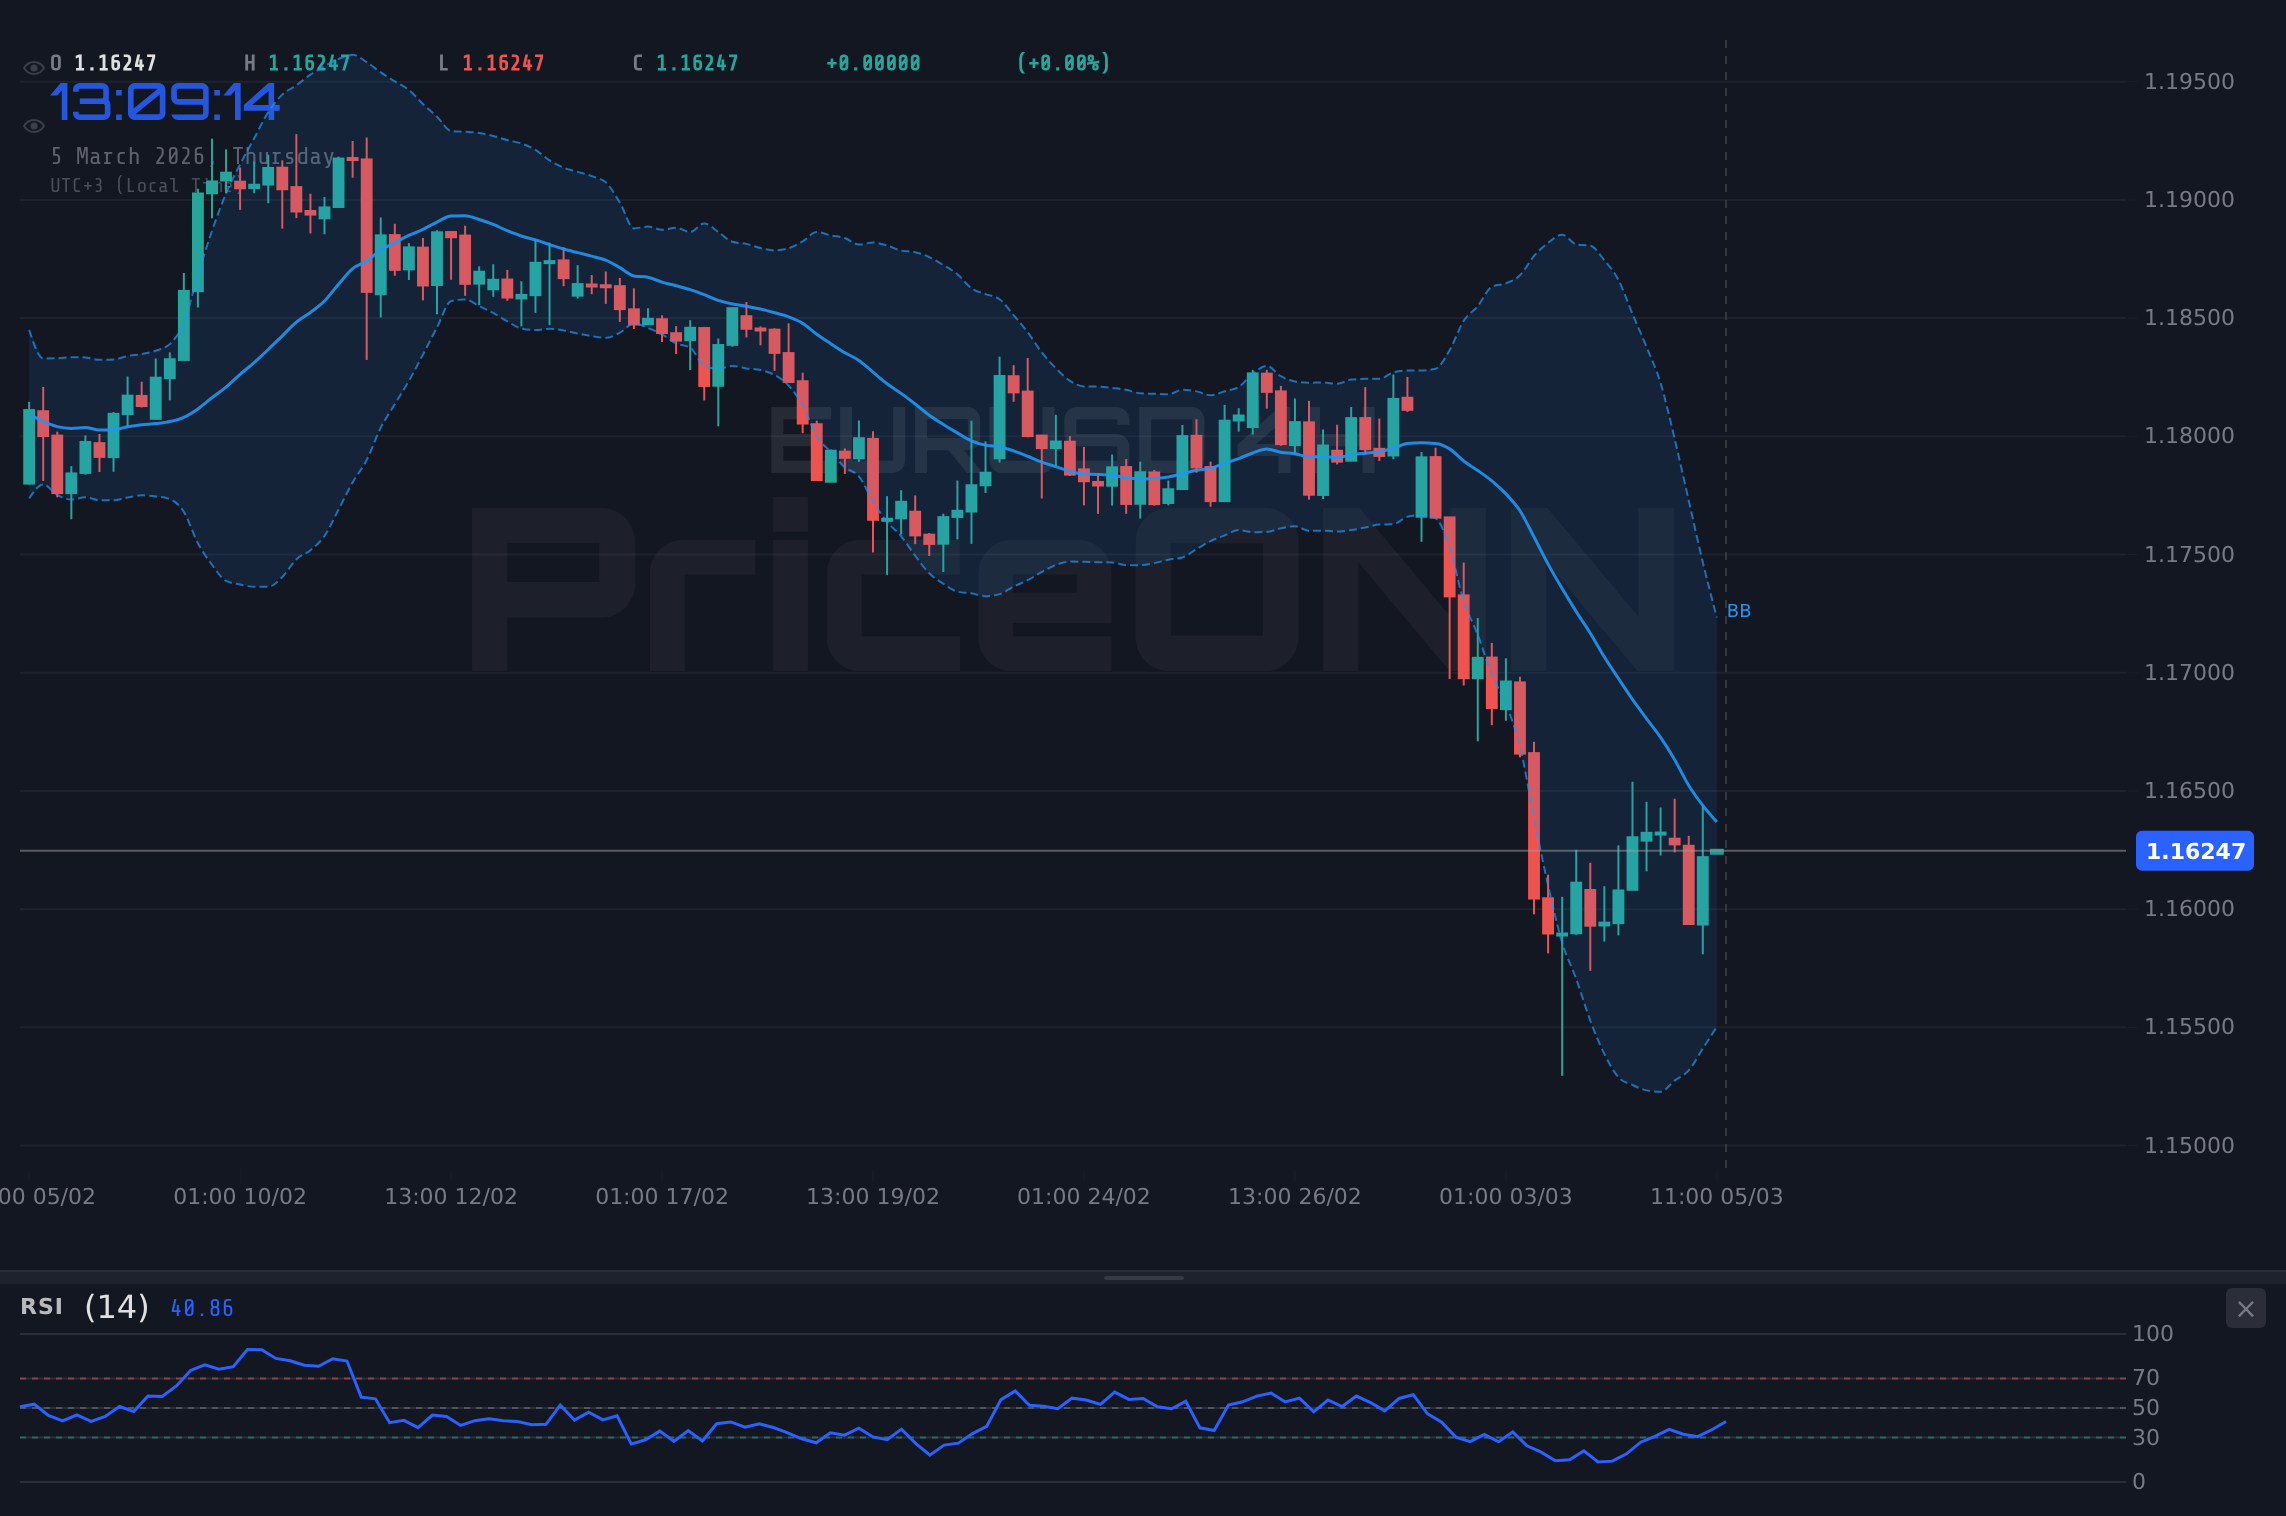
The 4H chart reveals a bearish picture, with the ADX registering a strong downtrend at 41.74. The EURUSD is currently below the middle Bollinger Band on this timeframe, which serves as a dynamic resistance. The Stochastic oscillator, with K=54.52 and D=61.98, points to further downside potential as %K
The Bull Case: Is a Recovery Possible?
Despite the prevailing bearish sentiment, there are reasons to believe that EURUSD could stage a recovery. On the 1H chart, the RSI is at 51, suggesting that the pair is not oversold. The Stochastic oscillator indicates a potential upside with K=39.19 > D=19.68. These signs of waning bearish momentum could pave the way for a short-term bounce. The 1H chart shows the price trading above the middle Bollinger Band, signaling potential for further gains.
Historically, when the RSI reaches this zone on EURUSD, the outcome has been a short-term bounce, followed by a continuation of the prevailing trend. This pattern last appeared in January 2026, when the price subsequently retraced before resuming its downward trajectory.
Economic Data Looms: What to Expect
The economic calendar is packed with key releases that could significantly impact EURUSD. Investors are keenly awaiting the upcoming PMI data, which will provide insights into the health of the Eurozone and US economies. According to Reuters, Fed officials have emphasized that future policy decisions will be data-dependent. Any surprises in the PMI numbers could trigger a sharp reaction in the currency markets.
On Tuesday, March 3, a GBP event is expected, potentially influencing EURUSD indirectly through cross-currency effects. Also on Tuesday, a EUR event is scheduled, with a previous value of 1.7. Any deviation from this figure could lead to increased volatility in the euro. On Wednesday, March 4, a number of USD events are on the horizon, including one with a previous value of 22, another with a forecast of 52.3, and others with previous values of 66.6 and 53.8. These events are likely to be closely watched by market participants.
Amid the current DXY strength, the upcoming economic data releases will be crucial in determining the near-term direction of EURUSD. Be bold when the market is fearful, cautious when euphoric-this golden rule applies today.
USD Weakness Despite Data: Geopolitical Risks and Gold's Safe Haven Appeal
According to recent news, the US Dollar unexpectedly weakened despite strong economic data, as geopolitical tensions overshadowed positive news. This risk-off environment is supporting safe-haven assets like gold, while weighing on riskier currencies like the euro. The AUD/USD pair is closely tied to Australian trade data, RBA policy, and commodity prices. Upcoming trade balance figures could provide further clues about the pair's future direction.
EURUSD decoupled from its usual inverse relationship with the DXY as geopolitical turmoil took center stage. This highlights the importance of monitoring broader market dynamics when trading currency pairs.
Key Levels to Watch for Different Trader Types
Different trader types should watch specific levels for EURUSD. Scalpers should focus on intraday support and resistance levels, such as 1.15849 and 1.1608, for quick profit-taking opportunities. Swing traders should monitor the 4-hour and daily charts for potential breakout patterns, with key levels at 1.1581 and 1.16662. Long-term investors should pay attention to the weekly and monthly charts, with crucial support at 1.15062 and resistance at 1.17462.
What the MACD Signal Tells Us About EURUSD Trend Analysis
The MACD signal provides valuable insights into EURUSD trend analysis. On the 1H chart, the MACD histogram shows negative momentum, suggesting that the recent rally may be losing steam. However, the MACD line is still above the signal line, indicating that the overall trend remains bullish. On the 4H chart, the MACD histogram shows positive momentum, but the MACD line is below the signal line, signaling a potential bearish crossover. On the daily chart, the MACD histogram shows negative momentum, and the MACD line is below the signal line, confirming the prevailing bearish trend.
With RSI at 51, bulls are losing steam-not in full reversal territory yet, but worth watching. The ADX at 17.54 is the real story here. A weak-trend reading like this means the breakout hasn't committed yet-it could go either way.
The Volatility Analysis and Potential Breakout
EURUSD volatility analysis suggests that a breakout is imminent. The Bollinger Bands are narrowing on the 1H and 4H charts, indicating a period of consolidation. Historically, such periods of consolidation are often followed by a sharp breakout in either direction. Traders should be prepared for increased volatility and potential whipsaws as the market attempts to establish a new trend.
The narrowing Bollinger Bands are a classic sign of a range-bound squeeze, with momentum fading. Manage your risk, wait for your setup-the market always gives a second chance.
Frequently Asked Questions: EURUSD Analysis
Is EURUSD a good buy right now?
EURUSD is not a clear buy right now, trading around $1.16 with mixed signals. The price needs to break above 1.16467 resistance or hold above 1.15809 support for a clearer direction.
What is the EURUSD price forecast for this week?
The EURUSD price forecast this week is uncertain, with targets at 1.16662 if it breaks higher and 1.15862 if it declines. The probability of a breakout either way is about 50%, given the current consolidation.
What are the key support and resistance levels for EURUSD?
Key support levels for EURUSD are at 1.15849, 1.1581 and 1.15862. Resistance levels are at 1.1608, 1.16187 and 1.16662.
Why is EURUSD moving today?
EURUSD's movement today is influenced by mixed economic data and geopolitical tensions, leading to a lack of clear direction. DXY strength adds downward pressure, while some technical indicators suggest a potential bounce.
Track markets in real-time
AI-powered analysis, technical indicators and real-time price data.
Join Our Telegram Channel
Breaking market news, AI analysis and trading signals instantly.
Join Channel