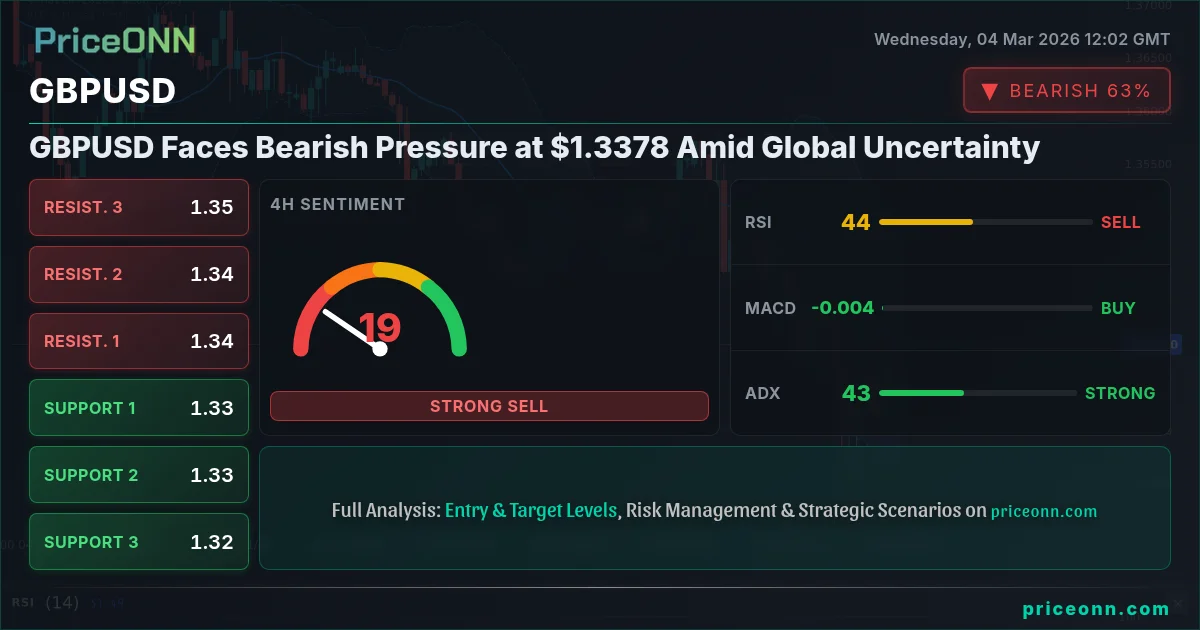
GBPUSD is currently trading at $1.3378, facing bearish pressure as global uncertainty weighs on the market. The currency pair is navigating a complex landscape amidst escalating geopolitical tensions and fluctuating risk sentiment, making it crucial for traders to monitor key support and resistance levels for potential trading opportunities.
- GBPUSD at $1.3378 faces bearish pressure amid global uncertainty.
- Key support level at 1.33588 must hold to prevent further downside.
- RSI at 58.19 suggests potential for a pullback, but not yet oversold.
- ADX at 22.77 indicates a moderate bullish trend on the 1H timeframe, conflicting with the longer-term bearish outlook.
The GBPUSD pair is experiencing a tug-of-war between short-term bullish signals and longer-term bearish pressures. As highlighted in the GBPUSD today analysis, the 1-hour chart shows a moderate bullish trend with an ADX of 22.77 and an RSI of 58.19, suggesting potential for further upside momentum in the short term. However, the 4-hour and 1-day timeframes paint a different picture, with strong bearish trends indicated by ADX values of 44.12 and 25.75, respectively. This multi-timeframe analysis reveals a complex scenario where short-term gains may be capped by underlying bearish sentiment.
The strength of the US dollar, as indicated by the DXY at 98.53, is exerting downward pressure on GBPUSD. According to recent forex news, heightened geopolitical tensions in the Middle East are fueling risk-off sentiment, driving investors towards the safe-haven dollar. The inverse correlation between the DXY and GBPUSD is evident, as a stronger dollar typically translates to a weaker pound. Traders should closely monitor the DXY for further clues about the direction of GBPUSD.
Key support and resistance levels are crucial for understanding potential price movements. Immediate support lies at 1.33588 on the 1-hour chart, followed by 1.33401 and 1.33203. These levels represent areas where buying pressure may emerge, potentially halting the decline. On the upside, immediate resistance is at 1.33973, followed by 1.34171 and 1.34358. A breakout above these resistance levels could signal a shift in momentum, potentially leading to further gains.
The Stochastic oscillator on the 1-hour chart shows a K value of 76.88 and a D value of 58.31, indicating a bullish signal. However, the 4-hour Stochastic presents a different picture, with a K value of 46.38 and a D value of 35.86, signaling potential for a pullback. This divergence in Stochastic signals underscores the conflicting forces at play in the GBPUSD market.
The MACD histogram on the 1-hour chart shows positive momentum, supporting the short-term bullish outlook. However, the 4-hour and 1-day MACD histograms indicate negative momentum, suggesting that the overall trend remains bearish. This discrepancy highlights the need for caution when interpreting short-term signals in the context of longer-term trends.
GBPUSD faces significant headwinds from global macroeconomic factors. Concerns about economic growth in the UK, coupled with expectations of a dovish stance from the Bank of England, are weighing on the pound. The upcoming economic data releases, including the GBP data scheduled for Tuesday, will provide further insights into the health of the UK economy and may influence the direction of GBPUSD.
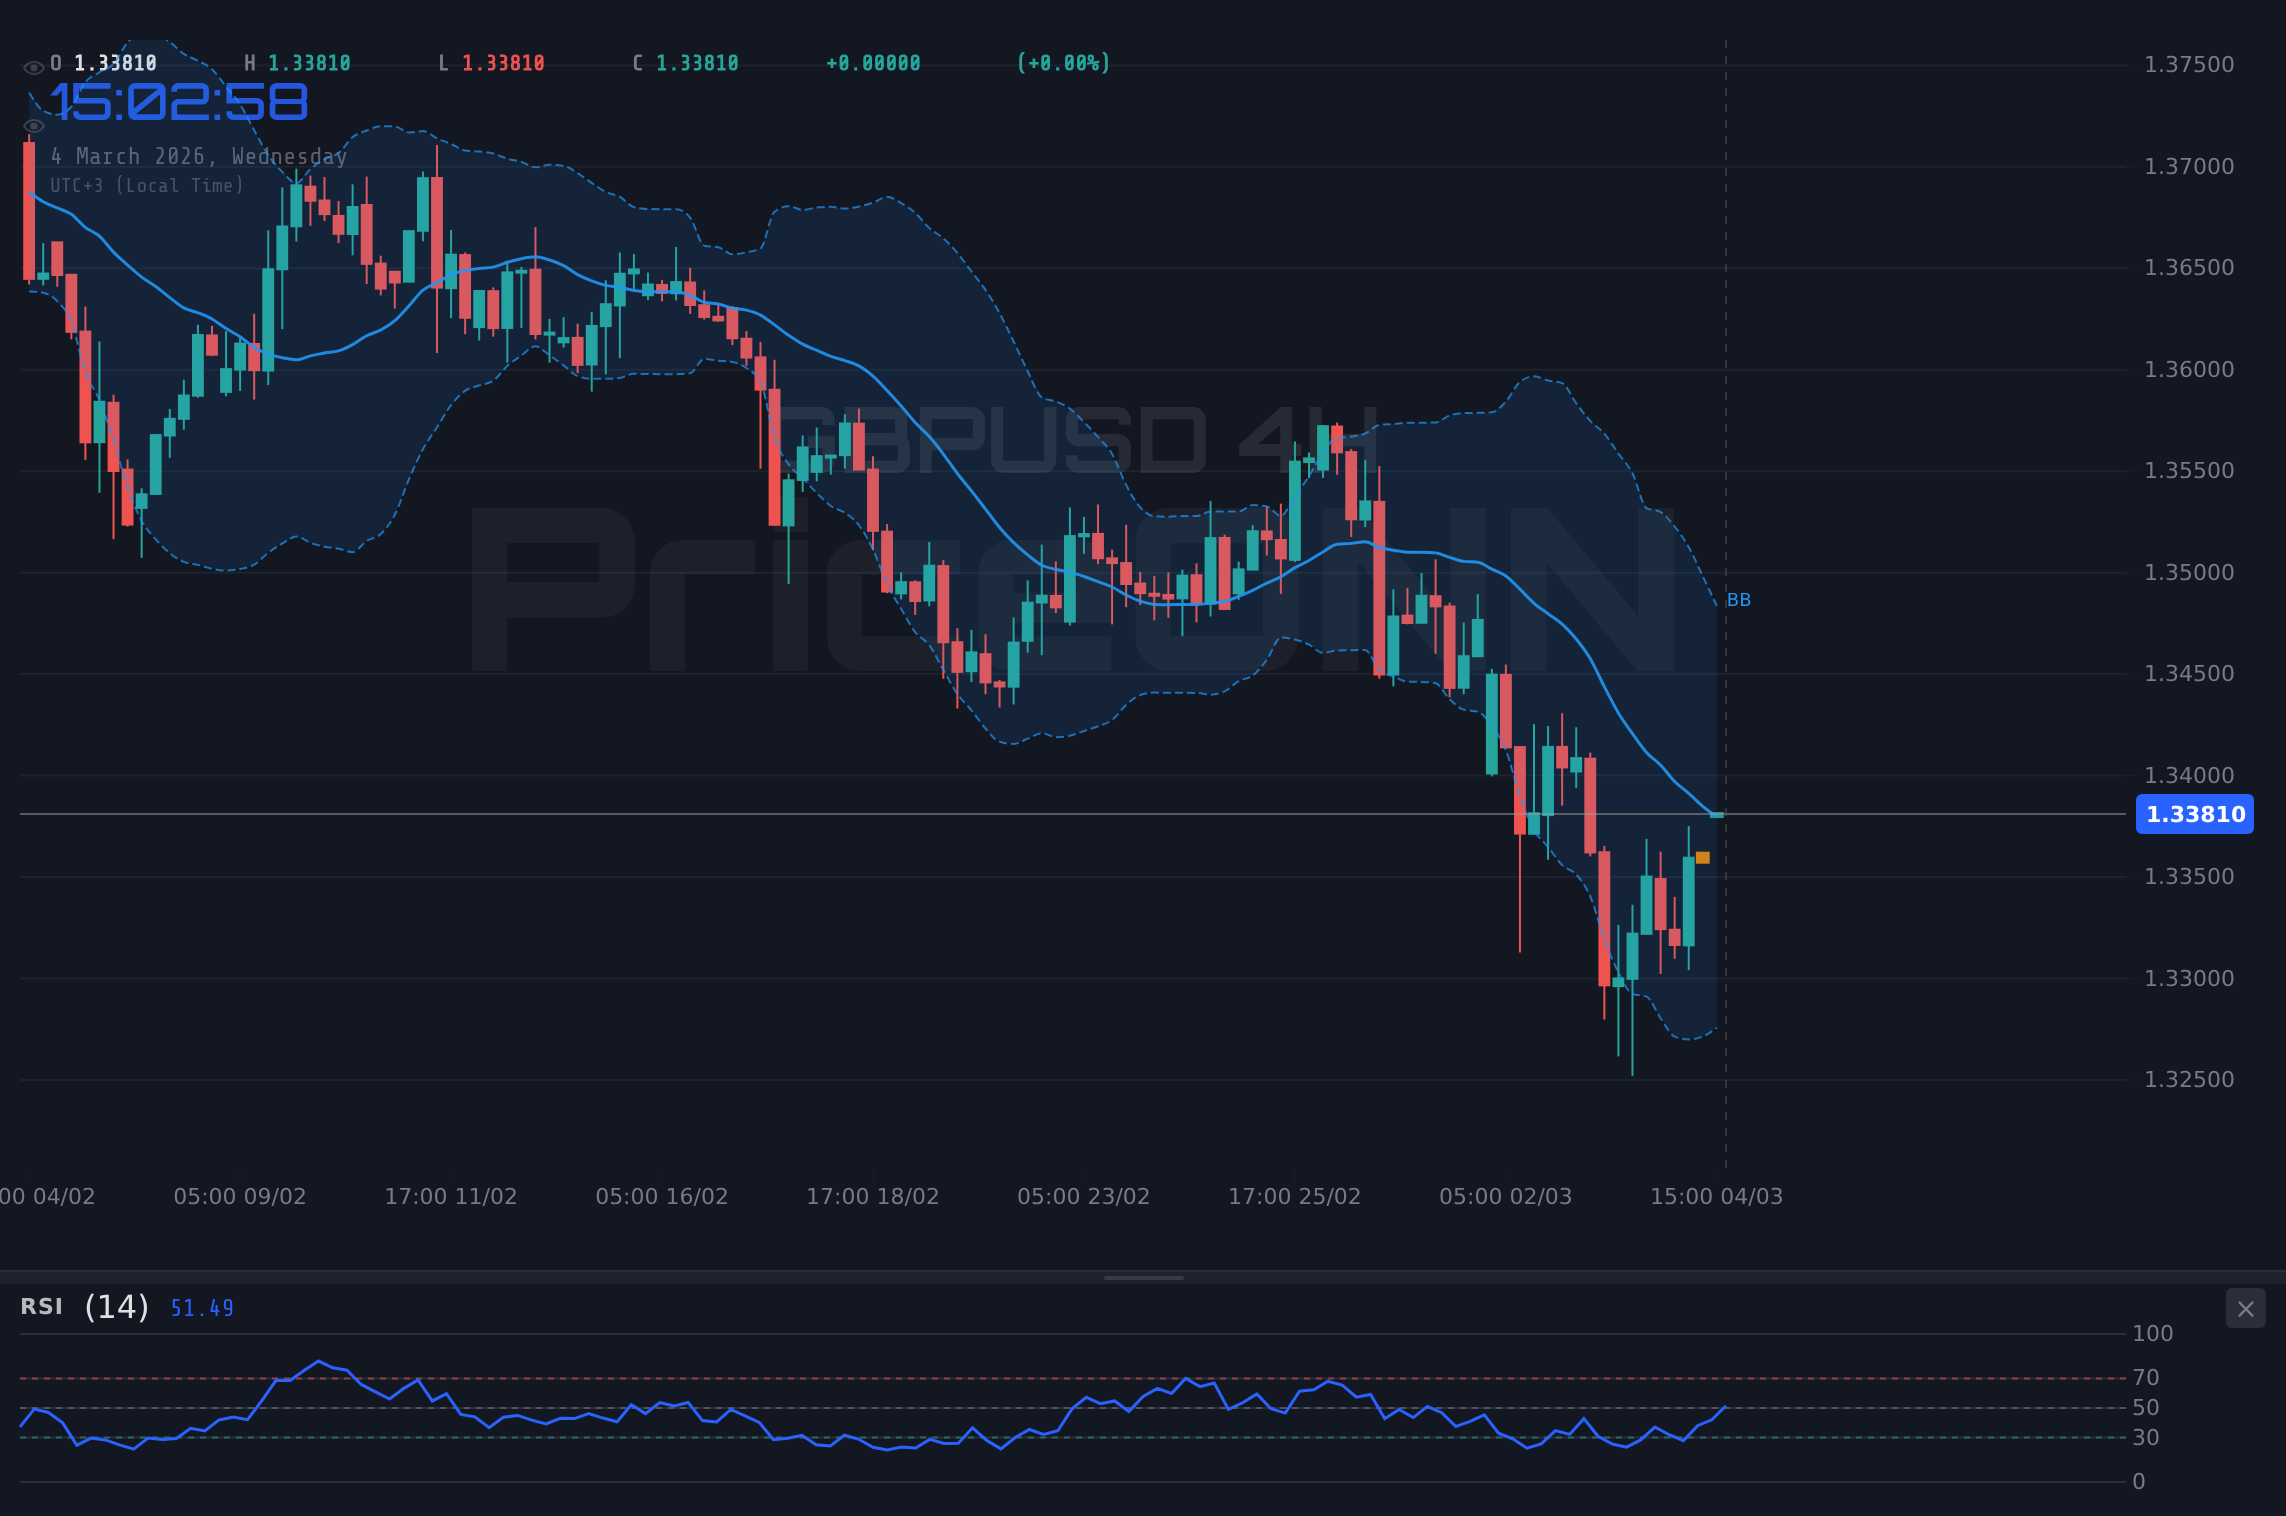
The daily chart shows a bearish trend with the price trading below the middle band of the Bollinger Bands. The ADX on the daily chart is at 25.75, indicating a strong downtrend. The RSI on the daily chart is at 38.38, which is approaching oversold territory but not yet signaling a reversal. This suggests that the bearish trend may continue in the short term.
The 4-hour chart shows a similar bearish trend with the price trading below the middle band of the Bollinger Bands. The ADX on the 4-hour chart is at 44.12, indicating a very strong downtrend. The RSI on the 4-hour chart is at 43.27, which is not yet oversold but trending downwards. This further reinforces the bearish outlook for GBPUSD.
The 1-hour chart, however, presents a slightly different picture. The price is trading above the middle band of the Bollinger Bands, and the RSI is at 58.19, indicating a possible short-term bullish retracement. However, this is likely to be limited by the strong bearish trends on the higher timeframes.
Given the conflicting signals, a cautious approach is warranted. Traders should monitor key support and resistance levels and wait for confirmation of a trend before entering a position. A break below the immediate support at 1.33588 could trigger further downside, while a break above the immediate resistance at 1.33973 could signal a short-term bullish reversal.
The EUR/USD pair is also facing downward pressure, as escalating tensions in the Middle East drive investors towards the safe-haven dollar. This correlation between EUR/USD and GBP/USD is not uncommon, as both currency pairs are often influenced by similar macroeconomic and geopolitical factors. Traders should monitor the EUR/USD for further clues about the direction of GBP/USD.
The USD/JPY Faces Downward Pressure Amidst Global Uncertainty. This further reinforces the risk-off sentiment, which is driving investors towards the safe-haven dollar. Traders should monitor the USD/JPY for further clues about the direction of GBP/USD.
Having tracked GBPUSD through various market cycles, I've learned that patience is key. Waiting for clear confirmation signals and managing risk effectively are essential for navigating the complexities of the forex market. Historically, when RSI reaches this zone on GBPUSD, the outcome has been varied, underscoring the need for caution and confirmation.
GBPUSD breaks below the immediate support at 1.33588, triggering further downside towards 1.33401 and 1.33203. The bearish trend is reinforced by a stronger dollar and continued risk-off sentiment.
GBPUSD breaks above the immediate resistance at 1.33973, signaling a short-term bullish reversal. The upside momentum is supported by a weaker dollar and improved risk sentiment.
The ADX at 44.12 indicates a strong downtrend on the 4H timeframe. A weak-trend reading like this means the breakout hasn't committed yet - it could go either way.
| Indicator | Value | Signal | Interpretation |
|---|---|---|---|
| RSI (14) | 58.19 | Neutral | Potential for a pullback, but not yet oversold. |
| MACD Histogram | Positive | Bullish Momentum | Positive momentum on the 1H chart supports short-term upside. |
| Stochastic | 76.88 | Bullish | Bullish signal on the 1H chart suggests further upside potential. |
| ADX | 22.77 | Weak | Indicates a moderate bullish trend on the 1H timeframe, conflicting with longer-term bearish outlook. |
| Bollinger Bands | Middle Band | Neutral | Price trading above the middle band on the 1H chart suggests short-term upside potential. |
Frequently Asked Questions: GBPUSD Analysis
Is GBPUSD a good buy right now?
Given the current trading price of $1.3378, GBPUSD presents a mixed picture. Short-term indicators suggest potential for a bullish retracement, but longer-term trends remain bearish, making a buy position risky without further confirmation.
What is the GBPUSD price forecast for this week?
The GBPUSD price forecast for this week is cautiously bearish, with potential for a test of support levels at 1.33588 and 1.33401. A break below these levels could lead to further downside towards 1.33203.
What are the key support and resistance levels for GBPUSD?
Key support levels for GBPUSD are at 1.33588, 1.33401, and 1.33203, while key resistance levels are at 1.33973, 1.34171, and 1.34358, based on the current market data.
Why is GBPUSD moving today?
GBPUSD is moving today due to a combination of factors, including a stronger US dollar driven by risk-off sentiment and concerns about the UK economic outlook. Geopolitical tensions are also contributing to the market volatility.
Track markets in real-time
AI-powered analysis, technical indicators and real-time price data.
Join Our Telegram Channel
Breaking market news, AI analysis and trading signals instantly.
Join Channel