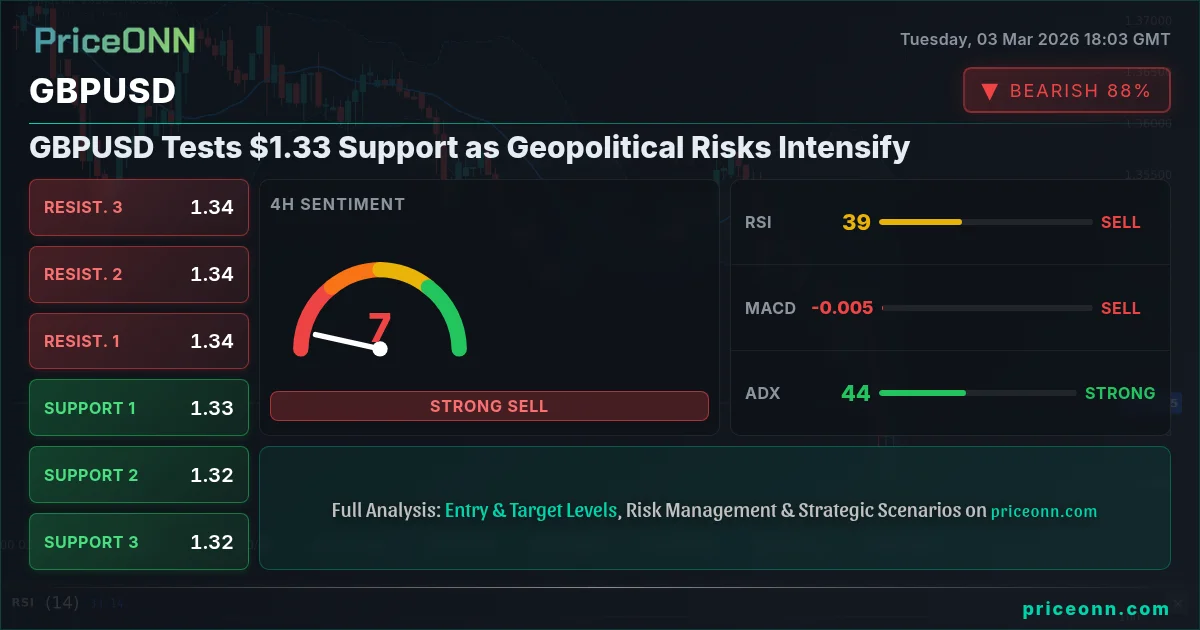
GBPUSD is under pressure, currently trading near $1.33, as escalating tensions in the Middle East drive investors towards safe-haven assets. The rise in the dollar index (DXY), now at 98.91, is further weighing on the pound, as risk aversion grips the market. This geopolitical uncertainty is overshadowing domestic economic factors, pushing GBPUSD into a precarious position.
- RSI at 33.44 on the 4H chart signals oversold conditions, suggesting a potential bounce.
- Critical support sits at 1.32656, a break below which could trigger further downside.
- MACD histogram on the 1H chart shows positive momentum, hinting at a possible short-term recovery.
- DXY strength at 98.91 is driving GBPUSD correlation, limiting upside potential.
The escalation of conflict in the Middle East, as reported by Reuters, is fueling safe-haven demand for the US dollar, pushing the DXY higher. This directly impacts GBPUSD, creating a challenging environment for bullish momentum. Traders are closely monitoring developments in the region, as further escalation could lead to a deeper correction in risk assets.
From a gbpusd technical analysis perspective, the pair is exhibiting a strong bearish trend on the 4H timeframe. The ADX indicator, currently at 43.25, confirms the strength of the downtrend, suggesting that the bearish momentum is likely to persist. The RSI, while in neutral territory at 33.44, indicates that the pair is approaching oversold conditions, potentially leading to a short-term bounce. However, the overall technical picture remains bearish, with the pair trading below the 200-day moving average.

The daily chart paints a similar picture, with GBPUSD trading below its 50-day and 100-day moving averages. The MACD histogram is showing negative momentum, further confirming the bearish sentiment. The stochastic oscillator, while in oversold territory, has not yet generated a bullish crossover, suggesting that the downside pressure may continue. The next key level to watch is the support at 1.32656, a break below which could open the door for a move towards 1.32312.
GBPUSD: Navigating the Geopolitical Landscape
The strength of the dollar index (DXY) is a crucial factor influencing GBPUSD's trajectory. Currently at 98.91, the DXY exhibits a strong bullish trend, driven by safe-haven demand and expectations of further interest rate hikes by the Federal Reserve. As long as the DXY remains elevated, GBPUSD is likely to face continued downside pressure. Traders should closely monitor the DXY for any signs of weakness, which could provide a much-needed boost for the pound.
The upcoming U.S. ADP Nonfarm Employment Change data on Wednesday will be a key event to watch. A strong reading could further fuel dollar strength, while a weaker-than-expected number could provide some relief for GBPUSD. Similarly, the U.S. ISM Non-Manufacturing PMI data, also due on Wednesday, will provide valuable insights into the health of the U.S. economy and its potential impact on the dollar.
Escalating tensions in the Middle East are adding another layer of complexity to the market outlook. As reported by several sources, the conflict is driving investors towards safe-haven assets, including the US dollar and gold. This risk-off sentiment is further weighing on GBPUSD, creating a challenging environment for bullish traders. Traders should remain vigilant and closely monitor geopolitical developments, as any further escalation could lead to increased volatility and downside pressure on the pair.
Technical Breakdown: Key Levels and Indicators
From a technical standpoint, GBPUSD is currently facing significant headwinds. The pair is trading below its 50-day, 100-day, and 200-day moving averages, indicating a clear bearish trend. The MACD histogram is showing negative momentum, further confirming the bearish sentiment. The RSI, while in neutral territory, is approaching oversold conditions, suggesting that a short-term bounce may be possible.
However, the overall technical picture remains bearish, with the pair trading below its key resistance levels. The next key level to watch is the support at 1.32656, a break below which could open the door for a move towards 1.32312. On the upside, the first resistance level is at 1.33304, followed by 1.33608. A break above these levels would be needed to signal a potential trend reversal.
The stochastic oscillator, while in oversold territory on the daily chart, has not yet generated a bullish crossover, suggesting that the downside pressure may continue. Traders should closely monitor the stochastic for any signs of a bullish reversal, which could provide a confirmation signal for a potential long entry.
Key Levels
Support Levels
Resistance Levels
Trade Plan: Riding the Bearish Wave
Given the strong bearish trend and the confluence of negative factors, a short trading strategy may be appropriate for GBPUSD. However, traders should exercise caution and manage their risk carefully, as the pair is approaching oversold conditions and a short-term bounce may be possible.
If GBPUSD can break above the resistance at 1.33387 and sustain the move, it could target 1.33508. A sustained break above 1.33721 would signal a potential trend reversal.
If GBPUSD breaks below the support at 1.33053, it could target 1.3284. A sustained break below 1.32719 would confirm the bearish trend and open the door for a move towards 1.32312.
Technical Outlook Summary
| Indicator | Value | Signal |
|---|---|---|
| RSI (14) | 34.43 | Neutral |
| MACD Histogram | Negative | Bearish |
| Stochastic | 26.48 | Bearish |
| ADX | 24.08 | Strong Downtrend |
| Bollinger | Lower Band | Watch |
The upcoming U.S. ADP Nonfarm Employment Change and U.S. ISM Non-Manufacturing PMI data on Wednesday could trigger significant volatility in GBPUSD. Traders should exercise caution and adjust their positions accordingly.
Frequently Asked Questions: GBPUSD Analysis
Is GBPUSD a good buy right now?
Given the current geopolitical tensions and DXY strength, GBPUSD is not a good buy right now. The pair is facing significant downside pressure, and a break below the support at 1.33053 could trigger further losses.
What is the GBPUSD price forecast for this week?
The GBPUSD price forecast for this week is bearish, with a potential target of 1.32312. However, a short-term bounce may be possible, given the oversold conditions. Traders should closely monitor the upcoming U.S. economic data releases for further clues.
What are the key support and resistance levels for GBPUSD?
The key support levels for GBPUSD are 1.33053, 1.3284 and 1.32719. The key resistance levels are 1.33387, 1.33508 and 1.33721, according to the current market data.
Why is GBPUSD moving today?
GBPUSD is moving lower today due to escalating geopolitical tensions in the Middle East and the strength of the US dollar, driven by safe-haven demand. This risk-off sentiment is weighing on the pound, creating a challenging environment for bullish traders.
While the technical picture remains mixed, attractive levels are forming. Patient investors always find opportunities - the key is waiting for the right moment.
Track markets in real-time
AI-powered analysis, technical indicators and real-time price data.
Join Our Telegram Channel
Breaking market news, AI analysis and trading signals instantly.
Join Channel