Gold Tests $4,566.70 Resistance Amid Shifting Market Sentiment
Gold hovers near $4,566.70 as mixed signals emerge from technical indicators, with traders watching key support and resistance levels for direction.
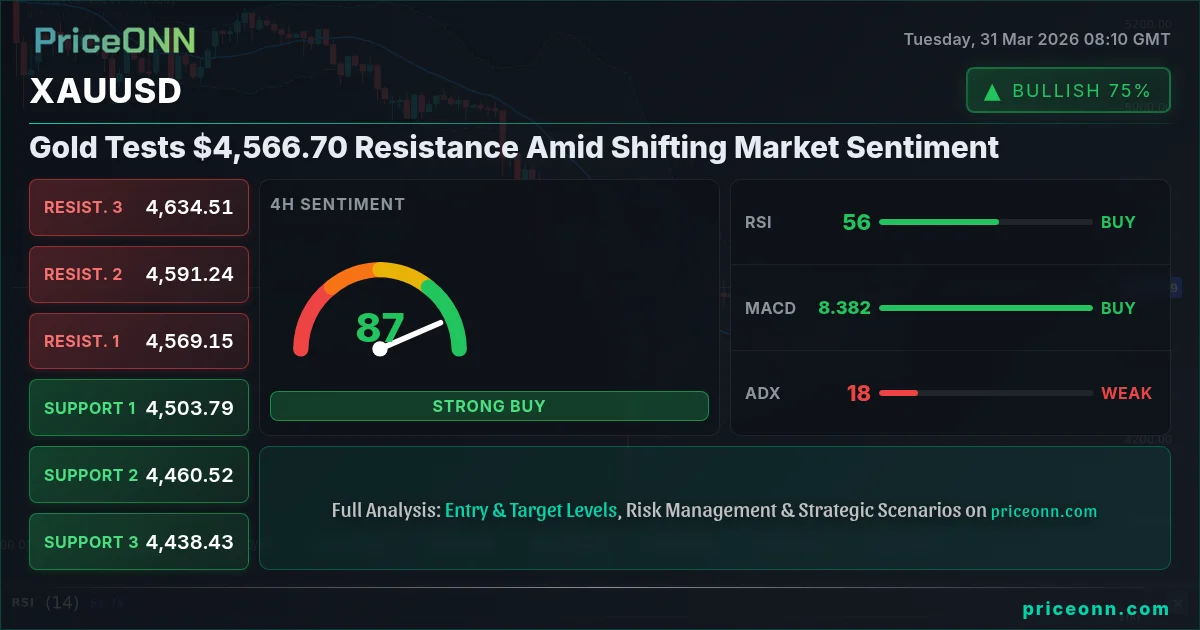
Gold, or XAUUSD, is currently navigating a critical juncture, trading at precisely $4,566.70. This price point places it near a significant resistance level, making the current market conditions a focal point for traders and analysts alike. The precious metal has shown resilience, but conflicting signals across different timeframes suggest a period of consolidation or a potential shift in momentum is on the horizon. Understanding the interplay between technical indicators, macroeconomic drivers, and geopolitical undercurrents is paramount for deciphering gold's next move.
- RSI at 67.36 on the 1-hour chart signals approaching overbought territory, suggesting potential selling pressure.
- The critical resistance level to watch is $4,581.98, a break above which could fuel further upside.
- Conversely, support at $4,550.52 needs to hold to prevent a steeper pullback.
- The DXY's strength, currently at 100.26, adds headwinds for gold, typically inversely correlated.
The daily chart for XAUUSD paints a complex picture. While the overall trend is classified as neutral with a 50% power rating, indicating a lack of decisive direction, the ADX at 33.15 suggests a strong trend is present, albeit a downward one on the daily timeframe. This divergence between the general trend classification and the strong ADX reading warrants close attention. Furthermore, the MACD on the daily chart is showing negative momentum, sitting below its signal line, which typically points to bearish pressure. However, the Stochastic indicator on the daily timeframe is flashing a bullish signal (%K > %D), indicating a potential rebound from oversold conditions. This conflicting data highlights the uncertainty currently surrounding gold's valuation.
Delving into the shorter timeframes provides a more nuanced view. On the 1-hour chart, the trend is also neutral, with a 50% power rating, but the ADX at 24.21 suggests a moderately strong uptrend is in play. The RSI at 57.42 is in the neutral zone, leaning towards bullish, and the MACD exhibits positive momentum. The Stochastic oscillator here shows %K below %D, a bearish signal, but the overall signal across the 1-hour timeframe leans towards 'BUY'. This is corroborated by the 4-hour chart, where the trend is also neutral with 50% power, but the ADX at 17.53 indicates a weak trend, suggesting sideways movement. The RSI at 56.08 remains in neutral territory, and the MACD shows positive momentum. The Stochastic on the 4-hour, however, also shows %K below %D, a bearish signal, yet the overall signal leans towards 'BUY'.
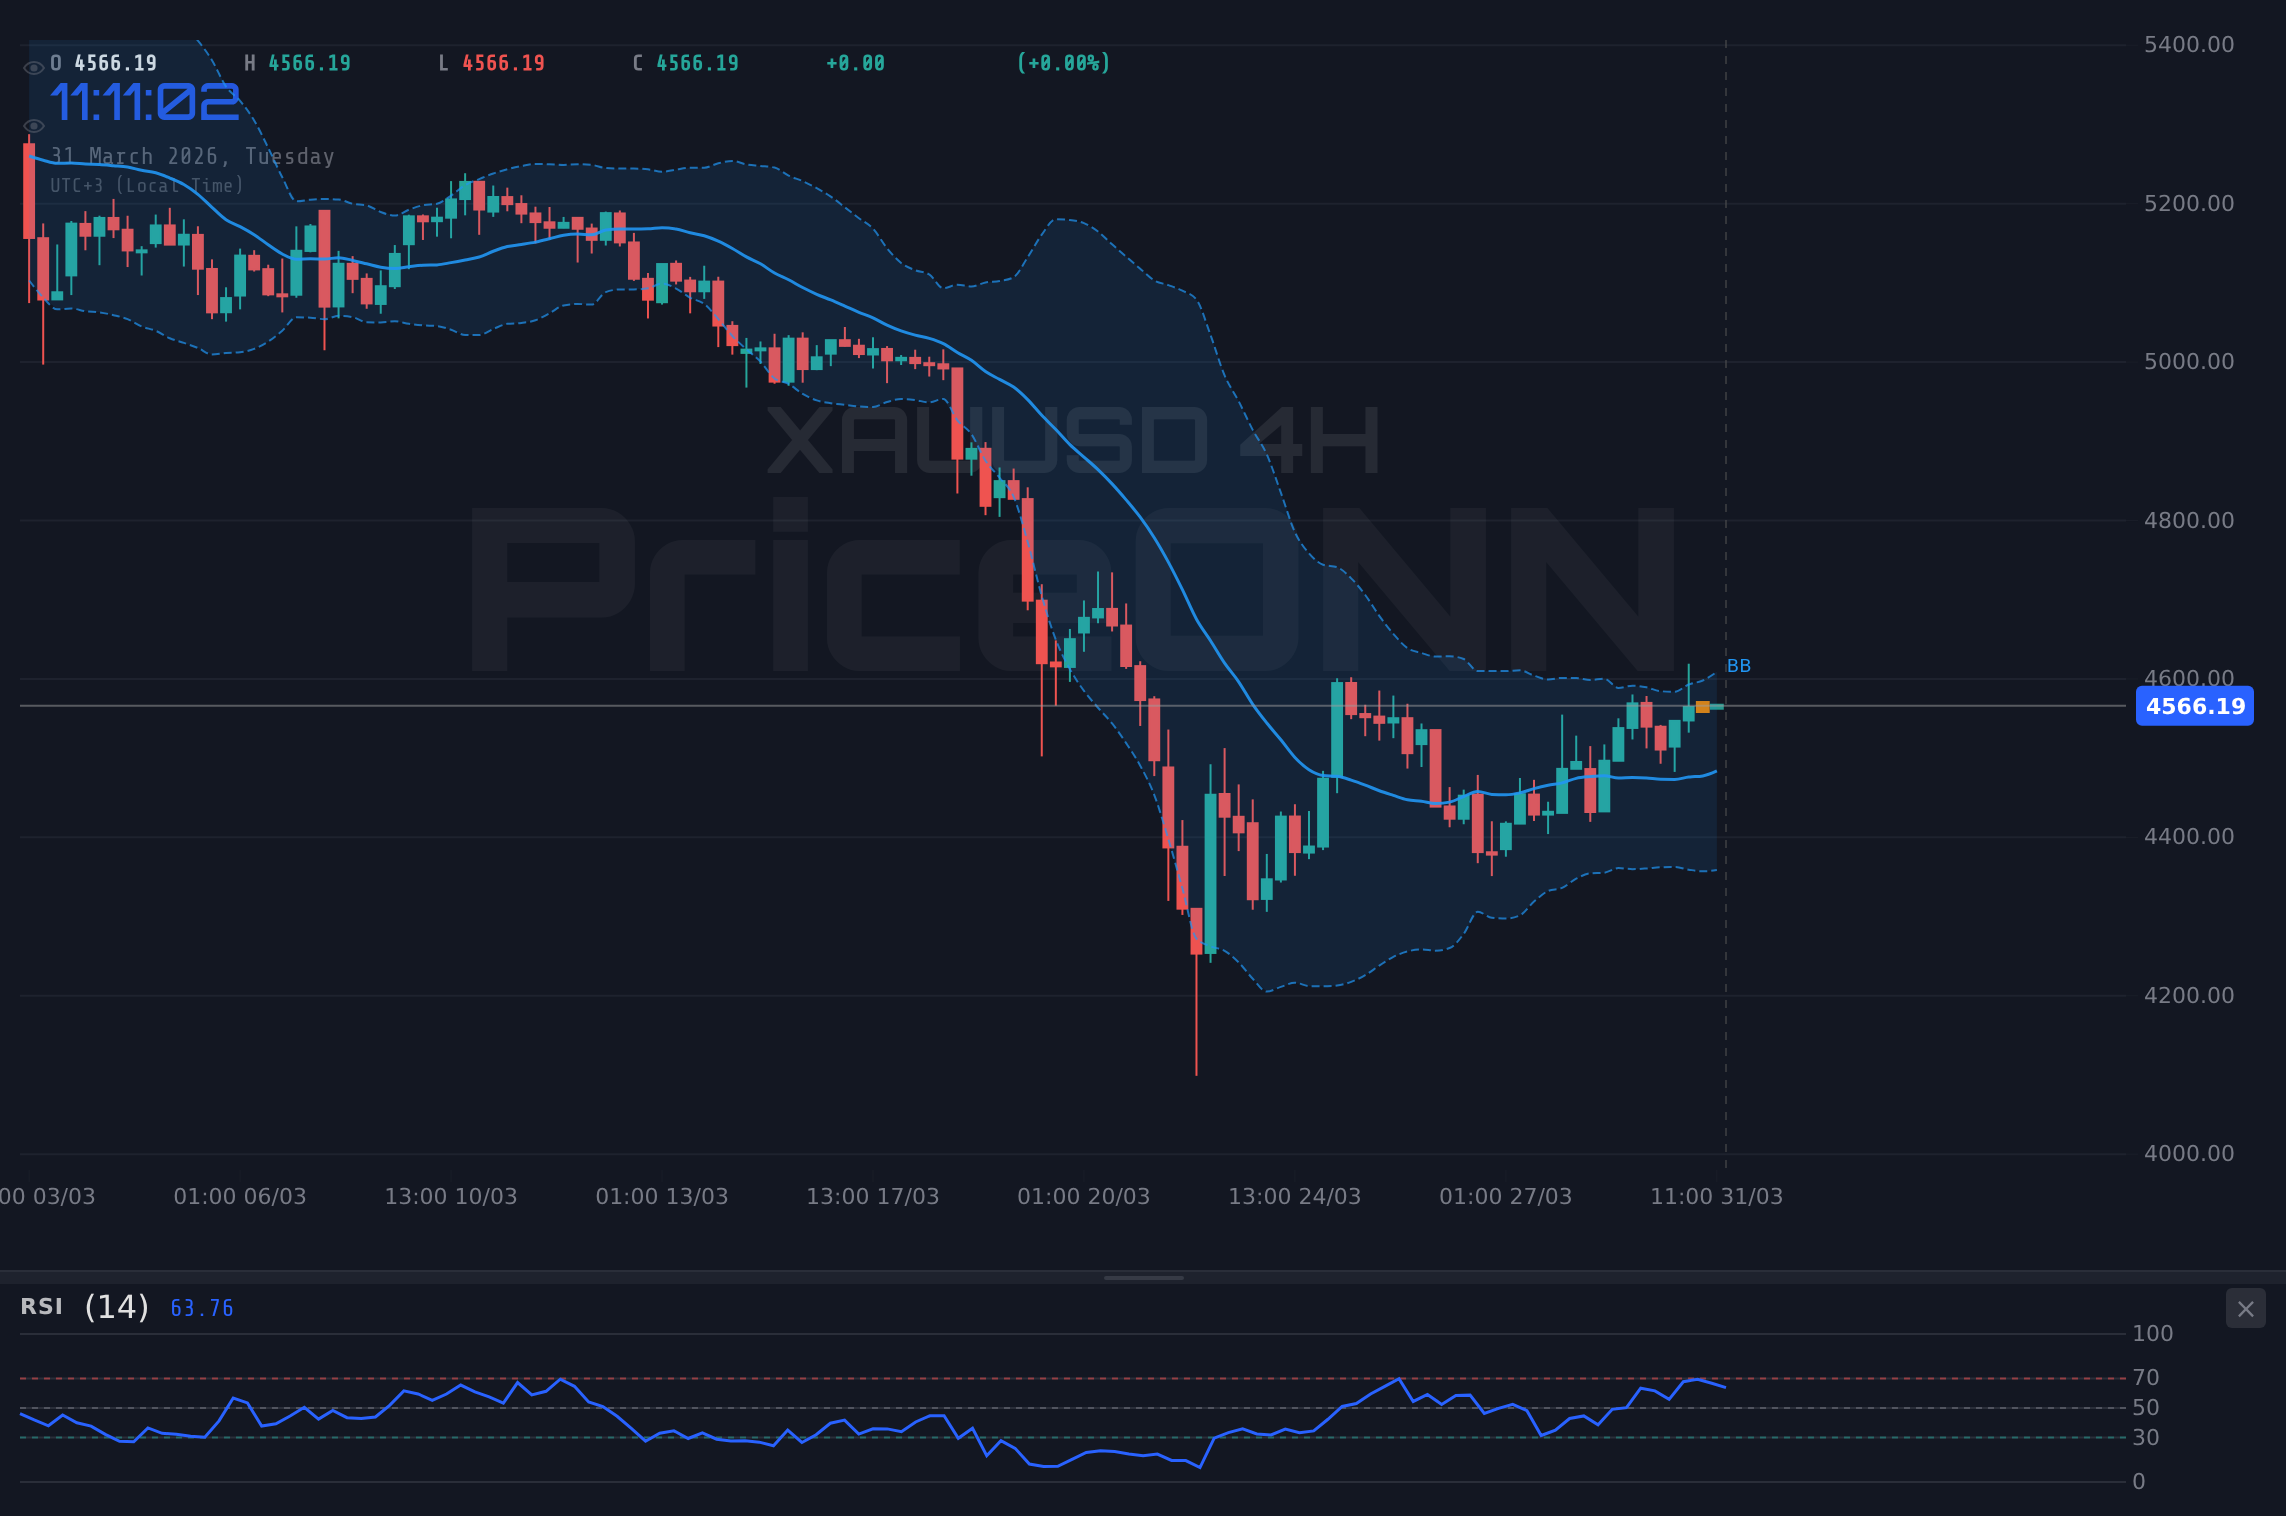
The current price of $4,566.70 sits precariously close to the 1-hour resistance level of $4,566.25. A decisive break above this immediate hurdle, followed by further confirmation above $4,575.46, could indeed signal a continuation of the intraday bullish momentum. However, the daily chart's bearish undertones cannot be ignored. The ADX reading of 33.15 on the daily timeframe indicates a strong trend, and its downward bias suggests that any rallies might be met with significant selling pressure. This is a classic scenario where short-term optimism clashes with longer-term bearish signals, creating a volatile trading environment.
The interplay between gold and the US Dollar Index (DXY) is a crucial factor to consider. The DXY is currently trading at 100.26, showing a strong upward trend on all analyzed timeframes, with an ADX of 42.49 on the 1-hour chart indicating a robust trend. Historically, a strengthening dollar often acts as a headwind for gold, as both are considered safe-haven assets, and a stronger dollar makes gold more expensive for holders of other currencies. The current upward momentum in the DXY, coupled with its RSI at 70.29 (entering overbought territory), suggests that the dollar might be due for a correction, which could, in turn, provide some relief to gold prices. However, if the DXY continues its ascent, it will undoubtedly add to the downward pressure on XAUUSD.
Geopolitical tensions, a perennial driver for gold, remain elevated. The ongoing conflicts in the Middle East and Eastern Europe continue to fuel demand for safe-haven assets. Reports indicate that crude oil prices have surged past $100 a barrel amidst these tensions, defying global growth fears. This surge in oil prices, as reported by sources like CNBC and Bloomberg, directly impacts inflation expectations. Higher inflation typically supports gold prices, as investors seek to preserve purchasing power. However, the market's reaction is nuanced; while inflation fears may support gold, aggressive central bank responses to inflation, such as interest rate hikes, can strengthen the dollar and dampen gold's appeal. The current market data shows Brent crude at $110.03 and WTI at $102.51, both indicating significant upward pressure, which should theoretically support gold.
The economic calendar, though sparse on high-impact events today, holds crucial data releases for the upcoming week. Investors are keenly watching for any signals from central banks, particularly the US Federal Reserve and the European Central Bank (ECB), regarding their monetary policy stance. Inflationary pressures remain a key concern, and any hawkish commentary or data suggesting persistent inflation could lead to higher interest rate expectations. This would likely bolster the US dollar and put further pressure on gold. Conversely, signs of cooling inflation or a more dovish central bank tone could provide a tailwind for the precious metal. The current RSI level on gold's daily chart at 40.21 indicates it's not yet in oversold territory, leaving room for potential declines if bearish factors intensify.
From a market structure perspective, the confluence of indicators on the daily chart presents a challenge. The strong ADX (33.15) suggests a trending market, but the MACD's negative momentum and the Stochastic's bullish signal create an environment of indecision. On shorter timeframes, the signals are more mixed, with the 1-hour chart showing a 'BUY' signal despite a bearish Stochastic, and the 4-hour chart also leaning 'BUY' with conflicting Stochastic signals. This suggests that while intraday traders might find opportunities on the long side, longer-term investors should exercise caution and await clearer directional confirmation. The presence of significant support levels at $4,550.52 and $4,544 on the 1-hour chart provides a buffer against immediate downside, but a close below these levels would significantly alter the short-term outlook.
The correlation with other markets also provides valuable context. The S&P 500 is currently trading at 6411.65, showing a daily increase of 1.14%, indicating a risk-on sentiment in equities. However, the Nasdaq 100 is also up 1.23% at 23203.63. This general rise in risk assets might seem counterintuitive to gold's safe-haven status, but it can also reflect broader economic optimism that indirectly supports commodities. The 1-day ADX for S&P 500 is a staggering 50.27, indicating a very strong downtrend on the daily chart, despite the intraday gains. This suggests underlying weakness in equities that could eventually spill over and boost gold's safe-haven appeal if risk aversion returns strongly.
The current neutral RSI at 57.42 on the 1-hour chart suggests that gold is neither overbought nor oversold in the immediate term, leaving room for price appreciation. However, the Stochastic oscillator's bearish cross (%K < %D) on both the 1-hour and 4-hour charts cannot be overlooked. This indicates that momentum might be shifting downwards, and a failure to break decisively above the $4,566.25 immediate resistance could lead to a test of the $4,550.52 support. The strength of the trend, as indicated by the ADX, is moderate on the 1-hour (24.21) and weak on the 4-hour (17.53), implying that any move might lack strong conviction initially.
Looking ahead, the market will be closely monitoring upcoming economic data, particularly inflation figures and central bank commentary. The geopolitical landscape remains a wild card, capable of introducing significant volatility. For gold traders, the $4,566.25 level is the immediate battleground. A confirmed break and hold above this level could open the door for a move towards $4,575.46 and potentially higher. Conversely, a failure to overcome this resistance, coupled with a weakening of the intraday bullish signals and a strengthening dollar, could see prices retreat towards the $4,550.52 support. The conflicting signals across different timeframes underscore the need for a cautious approach, focusing on price action confirmation at key levels.
Bearish Scenario: Consolidation Under Resistance
65% ProbabilityNeutral Scenario: Range-Bound Trading
25% ProbabilityBullish Scenario: Breakout Above Resistance
10% ProbabilityFrequently Asked Questions: XAUUSD Analysis
What happens if XAUUSD breaks above the $4,566.25 resistance level?
A confirmed break above $4,566.25, especially with strong volume, could signal further upside potential. The next immediate target would be $4,575.46, with a more significant hurdle at $4,581.98. However, this bullish scenario carries a lower probability (10%) given the conflicting daily chart signals.
Is the RSI at 67.36 a sell signal for XAUUSD right now?
An RSI of 67.36 on the 1-hour chart is approaching overbought territory but is not yet a definitive sell signal. It indicates building upward momentum that could lead to profit-taking. The daily chart's RSI at 40.21 suggests there's still room for price appreciation before extreme overbought conditions are met on longer timeframes.
How will the DXY's current level of 100.26 affect XAUUSD this week?
The DXY at 100.26, showing strong upward momentum, typically exerts downward pressure on gold prices due to their inverse correlation. If the dollar continues to strengthen, it could limit gold's upside potential and contribute to a bearish outlook, especially if key support levels for XAUUSD begin to falter.
Should traders consider buying XAUUSD at current levels around $4,566.70?
Buying at current levels carries significant risk due to the proximity to resistance and conflicting daily chart signals. A more prudent approach would be to wait for a clear breakout above $4,566.25 with confirmation, or a pullback to a stronger support level like $4,550.52, where risk management can be more effectively applied.
The path forward for gold hinges on its ability to decisively break through immediate resistance levels or hold key support amidst a generally strengthening US dollar and mixed technical signals. While short-term momentum on lower timeframes shows some bullish inclination, the longer-term daily chart presents a more cautious outlook. Patience and disciplined risk management will be crucial for navigating this uncertain environment.
| Indicator | Value | Signal | Interpretation |
|---|---|---|---|
| RSI (14) | 67.36 | Neutral | Approaching overbought on 1H, neutral on 4H, leaning bearish on 1D. |
| MACD Histogram | +1.05 | Bullish | Positive momentum on 1H, but negative on 1D. |
| Stochastic (%K) | 59.70 | Bearish | Bearish cross on 1H and 4H, suggesting potential pullback. |
| ADX | 24.21 | Bullish | Moderate trend strength on 1H, weak on 4H, strong downtrend on 1D. |
| Bollinger Band | Middle Band | Watch | Price is above the middle band on 1H and 4H, but below on 1D. |
Track markets in real-time
AI-powered analysis, technical indicators and real-time price data.
Join Our Telegram Channel
Breaking market news, AI analysis and trading signals instantly.
Join Channel