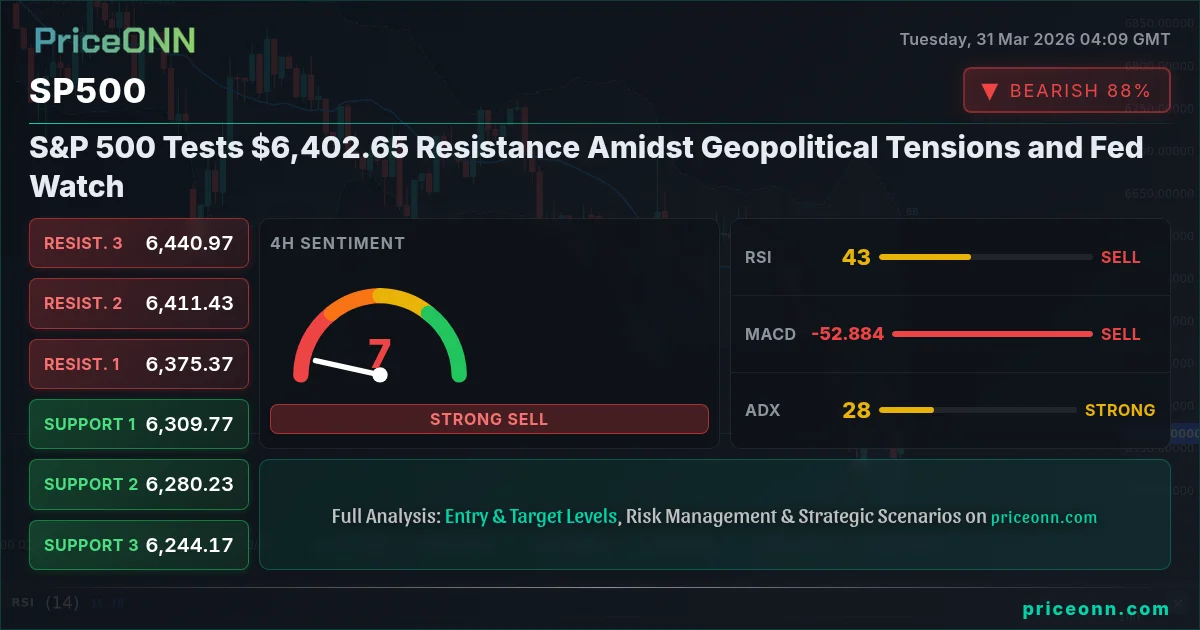
S&P 500 Tests $6,402.65 Resistance Amidst Geopolitical Tensions and Fed Watch
The S&P 500 hovers near $6,402.65 resistance. Escalating Middle East conflict and rising oil prices ($110.79 Brent) fuel inflation fears, while traders eye upcoming Fed commentary.
The S&P 500 is currently battling a critical resistance level at $6,402.65. This pivotal moment arrives as global markets grapple with a complex interplay of escalating geopolitical risks, particularly the ongoing Middle East conflict which has sent Brent crude oil prices soaring to $110.79 per barrel, and the ever-present anticipation of central bank policy shifts. The resilience shown by the index, managing to climb to these heights despite the headwinds, is a testament to underlying market strength, yet the proximity to resistance and the looming shadow of potential inflation pressures demand cautious optimism. This isn't just a technical level; it's a crossroads where economic data, geopolitical events, and monetary policy expectations converge, creating a challenging environment for traders and investors alike.
- The S&P 500 is currently testing a significant resistance level at $6,402.65, a key area to watch for potential price action.
- Escalating geopolitical tensions in the Middle East have pushed Brent crude oil to $110.79, increasing inflationary pressures and market uncertainty.
- The US Dollar Index (DXY) is showing strength, trading at 100.25, which typically puts pressure on commodities and emerging markets.
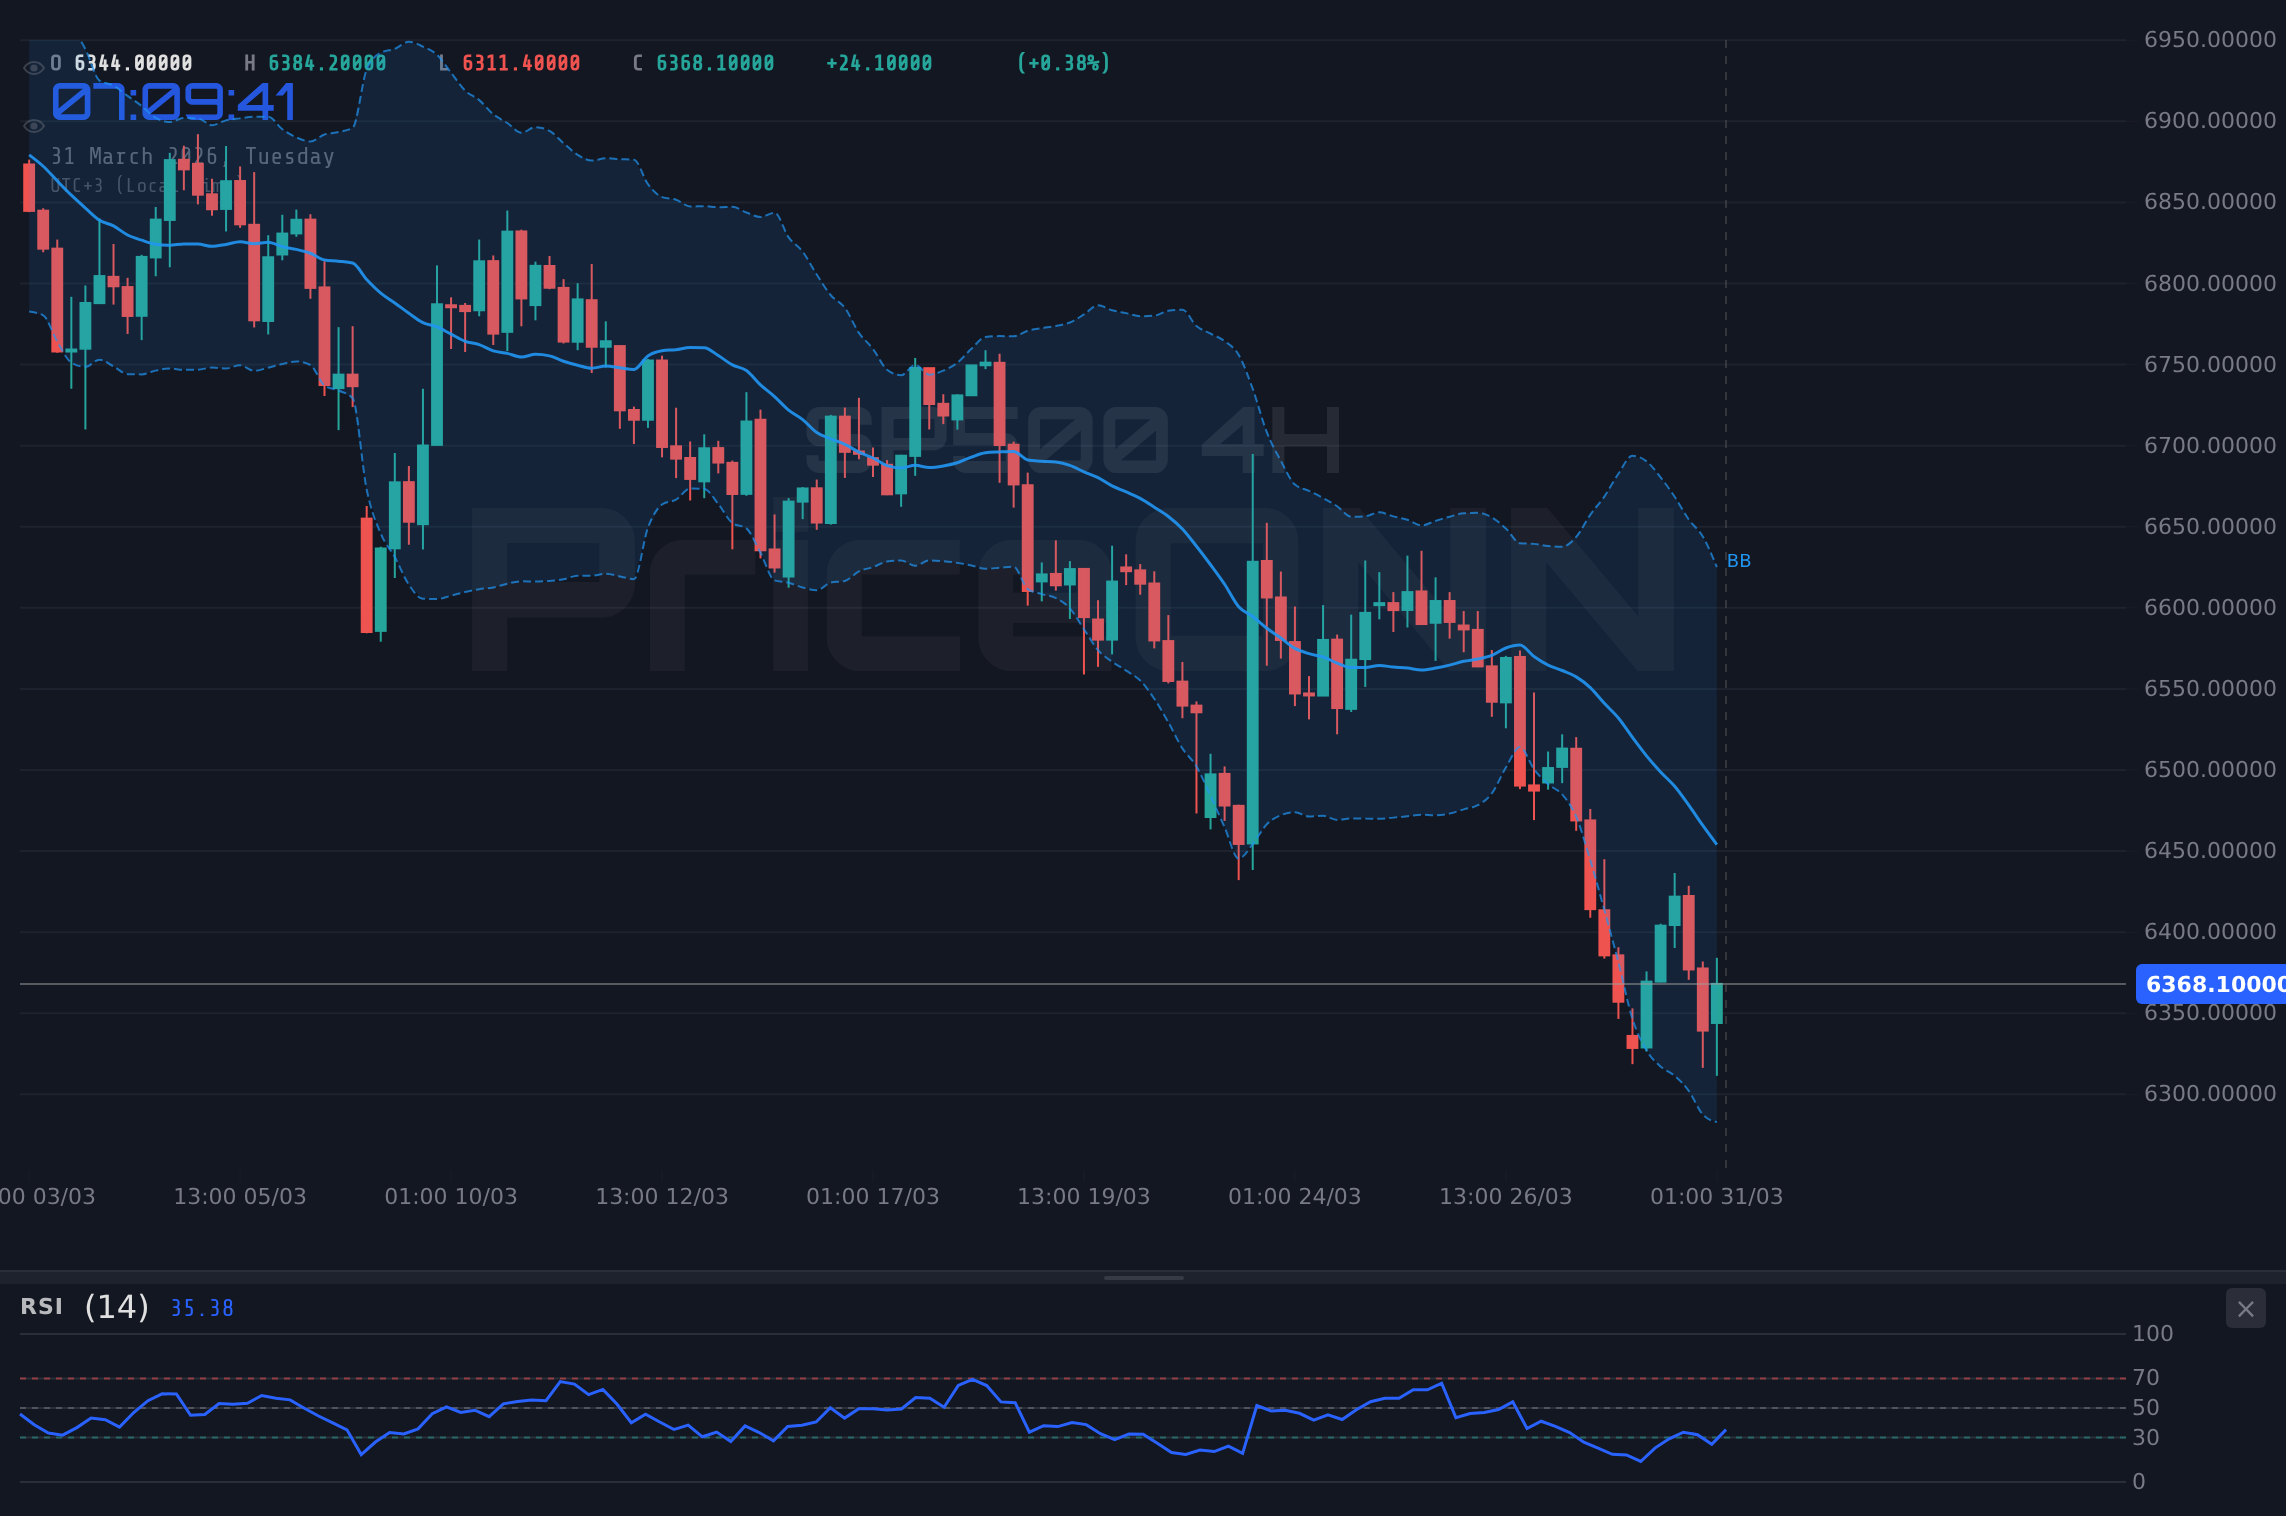
- Technical indicators on the 4-hour chart suggest a bearish bias for the S&P 500, with RSI at 42.65 and MACD showing negative momentum, despite a recent upward push.
- Upcoming economic data and Federal Reserve commentary will be crucial in determining whether the S&P 500 can overcome current resistance or faces a retracement.
Having navigated a challenging period, the S&P 500's ascent to $6,402.65 is noteworthy. This price point represents a significant hurdle, and its ability to hold or break through will offer crucial insights into the market's immediate direction. The daily chart paints a picture of a strong downward trend with an ADX reading of 50.27, indicating robust bearish momentum previously. However, the recent upward movement, pushing the index towards this resistance, introduces a layer of complexity. The divergence between short-term strength and the longer-term bearish technical signals is a classic sign of market indecision, where bulls attempt to regain control against prevailing downward forces. It’s this tug-of-war that makes current levels so critical for traders looking to position themselves ahead of major economic announcements.
The current market sentiment is heavily influenced by external shocks. The Middle East conflict, now seeing a Russian tanker venture into Cuban waters testing U.S. policy, adds another layer of geopolitical friction to an already tense global landscape. This has directly impacted energy markets, with Brent crude oil surging to $110.79 and WTI following suit, reaching $102.69. This surge in oil prices is a stark reminder of the inflationary pressures that central banks, particularly the Federal Reserve, are trying to tame. Higher energy costs can ripple through the economy, affecting everything from transportation to manufacturing, and ultimately influencing consumer spending and corporate earnings. The market's reaction to these inflationary inputs will be a key determinant of the S&P 500's path forward.
Navigating the Inflationary Storm
The surge in oil prices is more than just a headline; it's a fundamental driver that could alter the economic outlook. When energy costs rise significantly, as seen with Brent at $110.79 and WTI at $102.69, it directly impacts the cost of goods and services. This creates a challenging environment for central banks like the Federal Reserve, which are already battling elevated inflation. The dilemma is stark: tighten monetary policy further to combat inflation, potentially stifling economic growth and pressuring equity markets like the S&P 500, or risk allowing inflation to become entrenched. The market is currently pricing in a complex outlook, with the DXY at 100.25 showing a strengthening dollar, which could provide some buffer against imported inflation but also adds pressure on export-oriented companies within the index.
The technical indicators on the S&P 500 present a mixed, albeit leaning bearish, picture on longer timeframes. While the 1-hour chart shows a positive MACD momentum and RSI at 55.32, suggesting a recent bullish push, the 4-hour and daily charts tell a different story. The 4-hour chart displays a bearish trend with an ADX of 28.29, RSI at 42.65, and negative MACD momentum. The daily view is even more telling, with a very strong bearish trend indicated by an ADX of 50.27, RSI hovering at 32.43, and MACD firmly in negative territory. This divergence suggests that the current push towards $6,402.65 resistance might be a temporary bounce within a larger downtrend, rather than a sign of sustained strength. The Stochastic indicator on the daily chart shows K=10.52 and D=26.8, signaling an oversold condition that could precede a bounce, but the overall trend strength points to caution.
The Dollar's Influence
The US Dollar Index (DXY) currently stands at 100.25, reflecting a strengthening dollar. Historically, a stronger dollar tends to put downward pressure on commodities like gold (currently at $4,561.81) and silver ($72.10), and can also impact the earnings of multinational corporations listed on the S&P 500 by making their products more expensive for foreign buyers. However, the relationship isn't always straightforward, especially when the dollar strengthens due to global risk aversion, which can sometimes coincide with a flight to safety in US assets, including equities. In this current environment, with geopolitical tensions high, the DXY's strength might be a double-edged sword – offering some stability but also potentially signaling underlying global economic fragility that could eventually weigh on US market performance.
The interplay between the S&P 500 and other major indices provides further context. While the S&P 500 is testing resistance, the Nasdaq 100, often seen as a bellwether for growth stocks, is also showing a similar pattern. On the 1-hour chart, it exhibits a bullish signal, but the 4-hour and daily charts are firmly bearish, with a strong ADX of 31.54 on the 4-hour and 49.33 on the daily. The Dow Jones Industrial Average, while showing some intraday strength, also faces significant bearish signals on longer timeframes, with a daily ADX of 43.38. This broad weakness across major US indices suggests that the current upward momentum might be fragile and susceptible to a sharp reversal if key technical or fundamental levels fail. The Dow Jones's recent rebound of 415 points, attributed to hints of geopolitical easing, highlights the sensitivity of these markets to global events.
Key Levels and Trader Psychology
At $6,402.65, the S&P 500 faces a level that has historically acted as a significant barrier. The support levels on the 4-hour chart are noted at 6,309.77, 6,280.23, and 6,244.17, while resistance levels are seen at 6,375.37, 6,411.43, and 6,440.97. For the bulls to regain control, a decisive break above $6,402.65, ideally followed by a hold above $6,411.43, would be necessary. Such a move would need to be supported by strong volume and positive fundamental news to overcome the prevailing bearish technical indicators on the daily chart. Conversely, a failure to break higher, followed by a close below the 1-hour support at 6,394.93, could signal a resumption of the downtrend, with traders likely targeting the lower support levels.
The market sentiment is currently a delicate balance. On one hand, there's resilience evidenced by the S&P 500's ability to approach resistance levels despite significant global headwinds. This could be interpreted as a sign of underlying strength in the US economy or simply short-covering ahead of key data. On the other hand, the persistent bearish signals on longer timeframes, coupled with rising oil prices and a strengthening dollar, suggest that the path of least resistance may still be downwards. Traders are likely weighing the potential for a short-term relief rally against the risk of a more substantial correction if inflation proves stubborn or if geopolitical tensions escalate further. The absence of a clear bullish trigger, combined with the strong bearish trend on the daily ADX (50.27), suggests that upside potential might be limited in the short term.
The Federal Reserve Factor
The Federal Reserve's stance on monetary policy remains a central theme. While specific Fed commentary isn't provided in the live data, the general expectation of interest rate policy will heavily influence market direction. If upcoming data, such as the projected surge in German inflation, signals persistent price pressures globally, it could reinforce expectations of a hawkish Fed. Conversely, signs of economic cooling or significant market turmoil might lead to expectations of a more dovish approach. The current DXY level of 100.25 could reflect anticipation of Fed action or a global preference for dollar safety. Any indication from Fed officials regarding their reaction function to inflation and growth data will be closely scrutinized by S&P 500 traders.
Looking at the broader commodity markets, gold is trading at $4,561.81, showing a bullish trend on the 1-hour and 4-hour charts, but a bearish signal on the daily timeframe. Silver, at $72.10, echoes this sentiment with a stronger bullish inclination on shorter timeframes. The fact that gold is trading higher amid rising oil prices and geopolitical tensions, even with a strengthening dollar, suggests that safe-haven demand might be a dominant factor. This can sometimes decouple gold's performance from traditional correlations, especially when inflation concerns are paramount. The S&P 500's reaction to these commodity movements will be closely watched, as sustained inflation could force the Fed into more aggressive tightening, posing a risk to equity valuations.
Scenario Analysis: What Lies Ahead?
Given the current technical setup and macroeconomic backdrop, several scenarios are plausible for the S&P 500. The immediate battleground is the $6,402.65 resistance. A decisive breach above this level, supported by strong volume and positive fundamental news, could open the door for further upside, potentially targeting the next resistance at $6,411.43 and then $6,440.97. This bullish scenario would require a significant shift in market sentiment, perhaps driven by dovish signals from the Fed or a de-escalation of geopolitical tensions. However, the prevailing bearish indicators on longer timeframes suggest this is a less probable outcome without a strong catalyst.
Bearish Scenario: Resistance Holds Strong
65% ProbabilityNeutral Scenario: Consolidation Near Resistance
25% ProbabilityBullish Scenario: Breakout and Momentum
10% ProbabilityFrequently Asked Questions: S&P 500 Analysis
What happens if the S&P 500 fails to break above the $6,402.65 resistance level?
If the S&P 500 fails to decisively break above $6,402.65 resistance, a retracement is likely. The immediate target would be the 4-hour support at $6,375.37, followed by $6,309.77. This bearish outlook is supported by the daily chart's strong ADX of 50.27.
Should traders buy the S&P 500 at current levels near $6,402.65 given the mixed technical signals?
Caution is advised for buying at current levels near $6,402.65. While the 1-hour chart shows some bullish momentum (RSI 55.32), the longer-term daily indicators present a bearish bias (ADX 50.27, RSI 32.43). A confirmed break above $6,411.43 on strong volume would be needed to validate a bullish entry.
Is the RSI reading of 42.65 on the S&P 500's 4-hour chart a sell signal?
An RSI of 42.65 on the 4-hour chart indicates a bearish leaning but is not yet in oversold territory. It reflects downward momentum, aligning with the overall bearish trend suggested by the daily ADX of 50.27. This reading supports a cautious approach rather than an immediate sell signal.
How might rising oil prices above $110 for Brent crude impact the S&P 500's outlook?
Rising oil prices above $110 for Brent crude ($110.79) exacerbate inflation concerns, potentially forcing the Federal Reserve into a more hawkish stance. This could pressure the S&P 500, especially if it leads to a sustained move above the $6,402.65 resistance without strong fundamental support, potentially triggering a sell-off.
The path forward for the S&P 500 hinges on its ability to decisively overcome the $6,402.65 resistance in the face of significant geopolitical and inflationary pressures. While short-term resilience is evident, the longer-term technical picture and the looming threat of persistent inflation necessitate a disciplined approach. Traders must remain vigilant, adhering to risk management principles and waiting for clear signals. The market is dynamic, and while current conditions present challenges, they also pave the way for opportunities for those who are patient and well-prepared. Volatility creates opportunity - those prepared will be rewarded.
Track markets in real-time
AI-powered analysis, technical indicators and real-time price data.
Join Our Telegram Channel
Breaking market news, AI analysis and trading signals instantly.
Join Channel