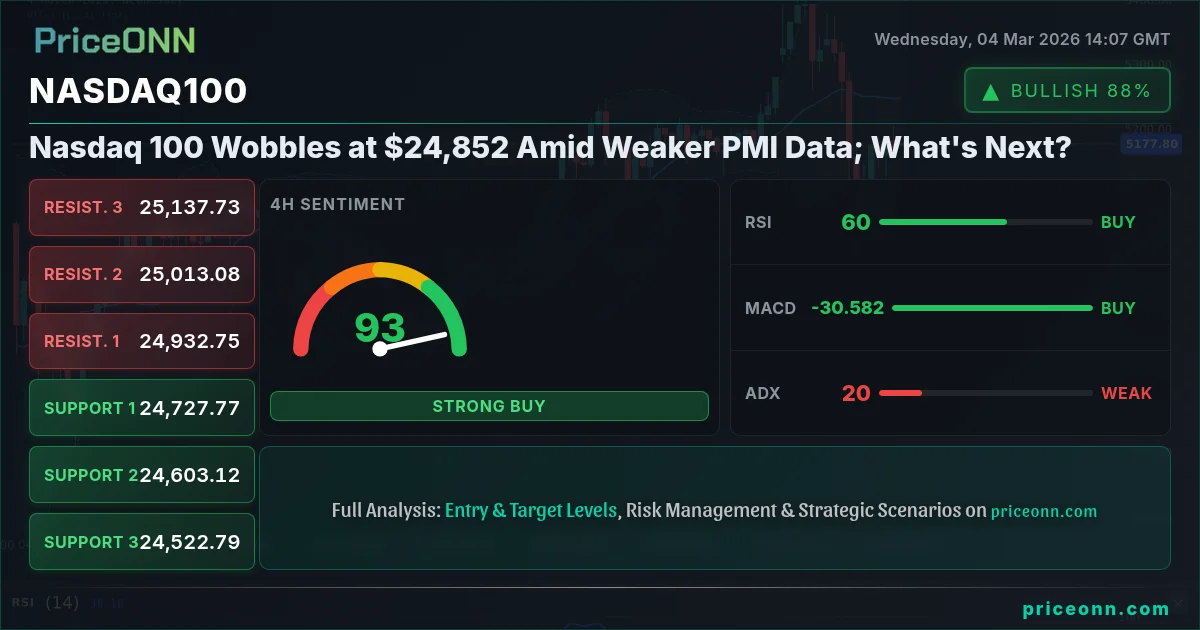
The Nasdaq 100 is currently hovering around $24,852, struggling to maintain its upward momentum after facing headwinds from weaker-than-expected PMI data. This comes despite some positive earnings reports, creating a mixed picture for investors as they weigh the potential for continued growth against emerging economic concerns. The key question now is whether this is a temporary pause or the start of a more significant correction.
- RSI at 62.92 indicates increasing buying pressure, though not yet in overbought territory.
- Critical support sits at 24,695.62, tested multiple times in the last few sessions.
- MACD histogram shows positive momentum, but the signal is weakening.
- Concerns about the impact of weaker PMI data on tech sector earnings are driving Nasdaq100 correlation with broader economic growth.
Nasdaq100 today analysis reveals a market at a crossroads, with technical indicators presenting a somewhat conflicting picture. While the 1-hour RSI sits at 62.92, suggesting continued buying pressure, it's important to note that it's not yet in overbought territory, indicating that there's still room for potential upside. The ADX, however, tells a different story; at 15.65, it signifies a weak trend, suggesting that the current upward movement may lack conviction and could be susceptible to reversals. This divergence in signals necessitates a cautious approach, urging traders to look for further confirmation before committing to a specific direction.
Examining the MACD signal provides further insight into the underlying dynamics of the Nasdaq 100. Although the MACD histogram currently displays positive momentum, indicating that buyers are still present in the market, it's crucial to observe that the signal is beginning to weaken. This suggests that the bullish sentiment may be gradually diminishing, and the bears could be preparing to make a comeback. Traders should closely monitor the MACD for a potential crossover, which could serve as an early warning sign of a trend reversal. The Stochastic oscillator, with K at 81.55 and D at 72.47, is showing a potential overbought condition suggesting the bulls may be tiring.
The key level to watch is the support at 24,695.62. This level has been tested multiple times in the last few sessions, demonstrating its importance as a critical area of demand. A sustained break below this level could trigger a wave of selling pressure, potentially leading to a deeper correction. On the upside, resistance is found at 24,818.09, representing the immediate obstacle for bulls. A successful breach of this resistance could pave the way for a test of higher levels, but the overall market sentiment suggests that this may be a challenging task. Investors need to consider the impact of the global uncertainty with the USD/JPY pair experiencing downward pressure due to geopolitical tensions in the Middle East.
The fundamental drivers behind the recent price action in the Nasdaq 100 are multifaceted, with economic data releases playing a significant role. The recent PMI data, which came in below expectations, has raised concerns about the health of the US economy and its potential impact on corporate earnings. This has led to a shift in market sentiment, with investors becoming more cautious and risk-averse. The previous PMI was at 52.7 and the market will be looking at the next release to determine if it is an outlier.
Looking ahead, several key economic events could influence the direction of the Nasdaq 100. The recent forex news highlights the USD/JPY facing downward pressure amidst global uncertainty adding to the market concerns. Traders will be closely watching the upcoming announcements, which could provide further clues about the future path of monetary policy. Any signs of a more hawkish stance from the Fed could weigh on the Nasdaq 100, as higher interest rates tend to dampen economic growth and reduce corporate profitability.
Nasdaq 100 support and resistance levels play a crucial role in determining potential entry and exit points for traders. The immediate support level, as previously mentioned, lies at 24,695.62. A break below this level could open the door to further downside, with subsequent support found at 24,544. On the resistance side, the initial hurdle is at 24,818.09, followed by a more significant barrier at 24,989.92. These levels should be closely monitored, as they could act as catalysts for price breakouts or reversals.
The longer-term outlook for the Nasdaq 100 remains uncertain, with various factors potentially influencing its trajectory. While the index has demonstrated remarkable resilience in the face of economic headwinds, the recent PMI data serves as a reminder that the global economy is not immune to challenges. Investors should remain vigilant and adapt their strategies accordingly, focusing on risk management and diversification to navigate the potentially volatile market environment.
Several factors may influence the Nasdaq 100 market sentiment. A surge in Silver prices to $85 amidst the Middle East tensions could indicate a shift toward safe-haven assets, potentially impacting Nasdaq 100 negatively. The consolidation of the USD as Middle East tensions fuel risk-off sentiment may also lead to a cautious approach among investors. These external factors may contribute to the bearish sentiment surrounding the index.
The Dow Jones 30 is showing a similar pattern to the Nasdaq 100 with the 1D chart showing a neutral trend. The index has support at 47,742 and resistance at 48,990. The RSI is at 42.8 showing a potential for further downside. This may put further downward pressure on the Nasdaq 100. The SP500 also has a similar pattern.
With the DXY at 98.6, there is some pressure on the Nasdaq 100. The dollar index is showing some strength and investors may be moving to the safety of the dollar. With the 4H chart showing a strong bullish trend, there is a potential for the DXY to move higher putting further pressure on the Nasdaq 100.
Frequently Asked Questions: Nasdaq100 Analysis
Is Nasdaq100 a good buy right now?
Given the current price of $24,852 and the weak ADX, it's risky to buy Nasdaq100 now. Wait for a confirmed breakout above 24,818.09 or a pullback to the 24,695.62 support level before considering a long position.
What is the Nasdaq100 price forecast for this week?
The Nasdaq100 price forecast for this week is uncertain. If the index breaks above 24,818.09, it could reach 24,989.92. However, a break below 24,695.62 could lead to a test of 24,544.
What are the key support and resistance levels for Nasdaq100?
Key support for Nasdaq100 is at 24,695.62 and 24,544. Key resistance levels are at 24,818.09 and 24,989.92, based on the current price of $24,852.
Why is Nasdaq100 moving today?
Nasdaq100 is moving today due to weaker-than-expected PMI data, which has raised concerns about economic growth. The consolidation of the USD as Middle East tensions fuel risk-off sentiment may also lead to a cautious approach among investors.
Technical Outlook Summary
| Indicator | Value | Signal |
|---|---|---|
| RSI (14) | 62.92 | Neutral |
| MACD Histogram | Positive | Bullish |
| Stochastic | K=81.55, D=72.47 | Neutral |
| ADX | 15.65 | Weak Trend |
| Bollinger | Upper Band | Watch |
Key Levels
Support Levels
Resistance Levels
Track markets in real-time
AI-powered analysis, technical indicators and real-time price data.
Join Our Telegram Channel
Breaking market news, AI analysis and trading signals instantly.
Join Channel