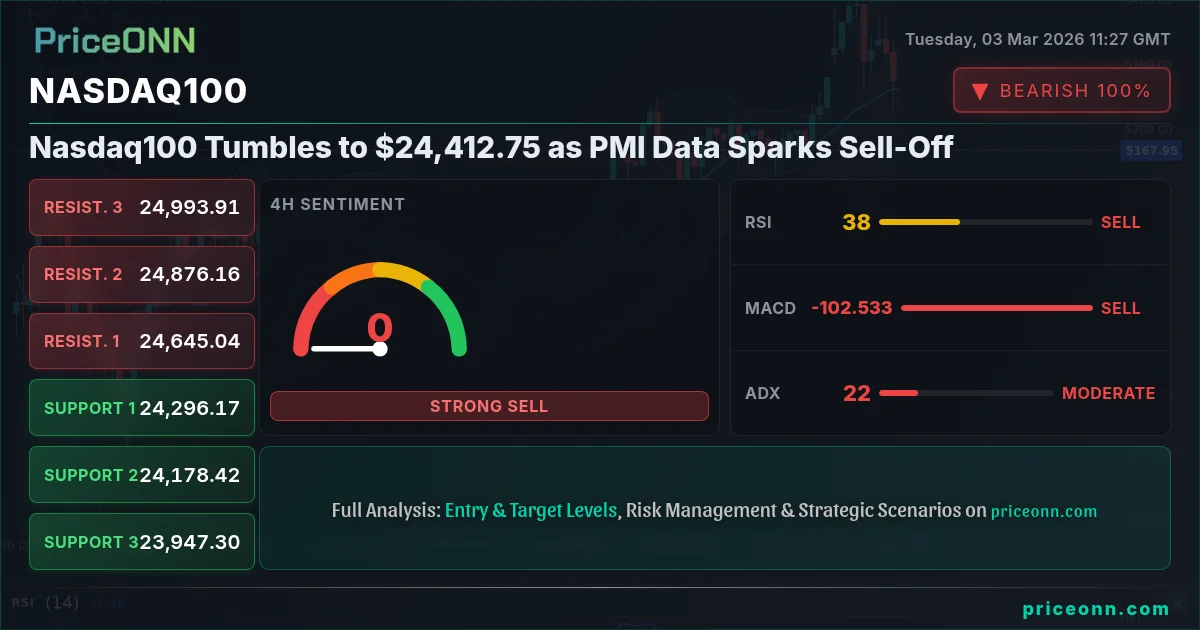
The Nasdaq 100 is under pressure, tumbling to $24,412.75 as concerns over economic growth intensify following weaker-than-expected PMI data. With the dollar index (DXY) at 99, the tech-heavy index faces headwinds. The question now is whether this pullback represents a buying opportunity or the beginning of a more significant correction. Nasdaq100 today analysis reveals the index is testing key support levels, and the coming days will be critical in determining its next direction.
- RSI at 27.55 signals oversold conditions, but the downtrend remains strong.
- Critical support sits at 24,193.31, a break below which could trigger further selling.
- MACD histogram shows increasing negative momentum, indicating bearish pressure.
- Fed rate expectations, coupled with DXY strength, are driving Nasdaq100 correlation with safe-haven assets.
Having tracked the Nasdaq100 through multiple economic cycles, it's clear that sentiment can shift rapidly. The current weakness stems from a confluence of factors, including disappointing economic data and rising geopolitical tensions. As Reuters reported this morning, escalating tensions in the Middle East are contributing to a flight to safe-haven assets, further pressuring riskier assets like equities. The Nasdaq100's performance is closely tied to the broader economic outlook, and recent PMI data has raised concerns about a potential slowdown. The index's decline also aligns with the S&P 500's current dip to 6753.75, reinforcing a risk-off sentiment in the market.
The 1-hour chart paints a bearish picture, with the Nasdaq100 trading firmly below its 200-period moving average. The RSI of 27.55 suggests the index is oversold, but this doesn't necessarily signal an immediate reversal. In fact, the ADX at 27.35 indicates a strong downtrend, meaning the oversold RSI could persist for some time. The stochastic oscillator, with K=5.07 and D=4.38, is also deeply oversold, but the lagging nature of this indicator means it may not provide a timely buy signal. Traders should be wary of relying solely on oversold readings, especially in the context of a strong downtrend.
Zooming out to the 4-hour chart, the bearish sentiment remains intact. The RSI, while slightly higher at 36.32, is still below the neutral 50 level, indicating continued downside momentum. The MACD histogram shows increasing negative momentum, further reinforcing the bearish outlook. Key support to watch is at 24,193.31, representing a critical level that, if breached, could open the door to further declines. Resistance, on the other hand, sits at 25,195.79, representing the initial hurdle for any potential bullish recovery.
On the daily timeframe, the Nasdaq100 trend analysis reveals a more nuanced picture. While the overall trend is still bearish, the RSI at 39.92 suggests the index is not yet deeply oversold. The MACD, while still negative, is showing signs of potential divergence, which could signal a weakening downtrend. However, the ADX at 28.34 indicates a strong trend, suggesting the bearish momentum is likely to persist in the near term. Traders should pay close attention to the daily close, as a break below 24,193.31 could confirm a more significant correction.
Examining Nasdaq100 support and resistance levels, the immediate support lies at 24,368.74 on the 1-hour chart. This level, if broken, could lead to a test of the next support at 24,323.58. Below that, the 24,237.6 level becomes crucial. On the upside, resistance is found at 24,499.88, followed by 24,585.86 and 24,631.02. These levels represent potential areas where the index may encounter selling pressure. The Nasdaq100 key levels are essential for short-term traders looking to capitalize on intraday movements.
The weakness in the Nasdaq100 is mirrored by declines in other major indices, including the Dow Jones Industrial Average, which is down 1.8% today. This broad-based selling pressure suggests a wider risk-off sentiment in the market. The dollar index (DXY) is strengthening amid the risk-off environment, further pressuring the Nasdaq100. As geopolitical tensions escalate and economic data disappoints, investors are flocking to safe-haven assets, driving up the DXY and weighing on riskier assets like equities.
The upcoming economic calendar events could provide further catalysts for market volatility. On Wednesday, the U.S. ADP Nonfarm Employment Change and Services PMI data will be closely watched for clues about the health of the labor market and the broader economy. A weaker-than-expected ADP report could further weigh on the Nasdaq100, while a stronger-than-expected reading could provide a temporary boost. The ISM Non-Manufacturing PMI will also be important, as it provides insights into the service sector, which accounts for a significant portion of the U.S. economy. It is worth noting that the U.S. Initial Jobless Claims on Thursday and U.S. Retail Sales MoM on Friday will also be closely monitored.
A bounce from oversold conditions occurs, with price breaking above the initial resistance at 24,499.88. A sustained move above 25,195.79 would confirm a bullish reversal, targeting 25,437.39.
Price breaks below the critical support at 24,193.31, triggering further selling pressure. The next target would be the 23,951.71 level, with potential for further declines towards 23,500.
Given the current technical and fundamental backdrop, a bearish trade plan seems more prudent. The ADX indicates a strong downtrend, and the MACD histogram confirms increasing negative momentum. While the RSI is oversold, it's important to remember that oversold conditions can persist for extended periods, especially in a strong downtrend. Therefore, a short position with a well-defined stop-loss level may offer a favorable risk-reward opportunity.
Trade Plan: Nasdaq100 Short
Entry Trigger: Short entry at a break below 24,368.74
Target 1: 24,193.31
Target 2: 23,951.71
Stop/Invalidation: Stop-loss at 24,499.88
This trade plan assumes a continuation of the current bearish trend. However, traders should be aware of the risk of a potential bounce from oversold conditions. A break above the initial resistance at 24,499.88 would invalidate the bearish thesis and suggest a potential bullish reversal. Therefore, it's crucial to monitor price action closely and adjust the trade plan accordingly.
The U.S. ADP Nonfarm Employment Change and Services PMI data on Wednesday could significantly impact market sentiment. Traders should exercise caution and consider reducing their position size ahead of these releases.
Frequently Asked Questions: Nasdaq100 Analysis
Is Nasdaq100 a good buy right now?
Given the strong downtrend and negative momentum, Nasdaq100 is not a good buy right now. A break below 24,193.31 could signal further declines, making short positions more attractive.
What is the Nasdaq100 price forecast for this week?
The Nasdaq100 price forecast for this week is bearish, with a high probability of testing the 23,951.71 support level. A break below this level could lead to further declines towards 23,500.
What are the key support and resistance levels for Nasdaq100?
Key support levels for Nasdaq100 are 24,193.31, 23,951.71, and 23,500. Key resistance levels are 24,499.88, 25,195.79, and 25,437.39.
Why is Nasdaq100 moving today?
Nasdaq100 is moving lower today due to disappointing PMI data, which has fueled concerns about economic growth. The strengthening dollar index (DXY) is also contributing to the bearish sentiment.
AI technical analysis suggests caution as the Nasdaq100 navigates these choppy waters. Chart pattern recognition isn't showing a clear reversal pattern yet. Multi-timeframe analysis confirms the bearish pressure in the short to medium term. Price action analysis indicates a continuation of the downtrend. Market sentiment analysis reveals growing risk aversion. Volatility analysis shows increased price swings, adding to the uncertainty. Breakout scanners are currently flagging potential downside breakouts. Key level alerts are focused on the 24,193.31 support.
Technical Outlook Summary
| Indicator | Value | Signal |
|---|---|---|
| RSI (14) | 27.55 | Oversold |
| MACD Histogram | Negative | Bearish |
| Stochastic | 5.07/4.38 | Oversold |
| ADX | 27.35 | Strong Trend |
| Bollinger | Lower Band | Watch |
Key Levels
Support Levels
Resistance Levels
Track markets in real-time
AI-powered analysis, technical indicators and real-time price data.
Join Our Telegram Channel
Breaking market news, AI analysis and trading signals instantly.
Join Channel