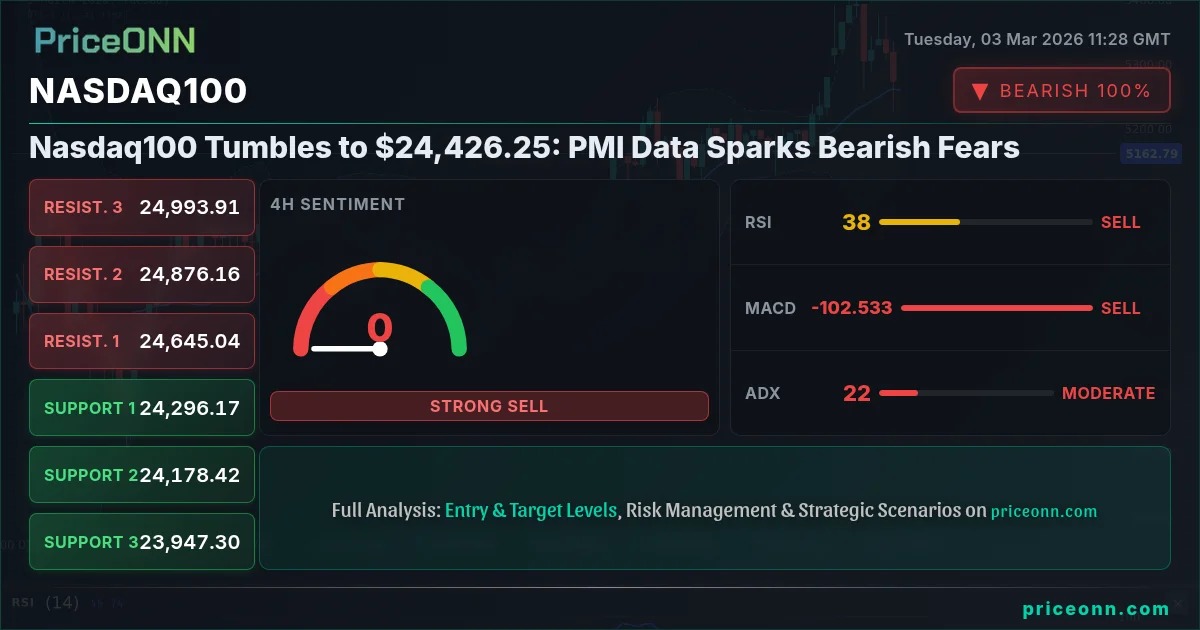
Nasdaq100 today analysis shows a concerning trend: the index has tumbled to $24,426.25, reacting sharply to the latest PMI data. Is this the start of a significant correction, or just a temporary pullback? It's a question on every trader's mind right now.
- RSI at 28.74 signals oversold conditions but further downside possible amid bearish momentum.
- Key support level at 24,323.58, a break below which could trigger further selling.
- MACD histogram shows increasing negative momentum: bearish trend is strengthening.
- Upcoming U.S. ADP Nonfarm Employment Change data on Wednesday could provide further clues.
Having tracked Nasdaq100 through numerous economic cycles, the current situation presents a unique blend of technical and fundamental challenges. The initial drop was triggered by weaker-than-expected PMI data, specifically the U.S. Services Purchasing Managers Index (PMI) due Wednesday, creating immediate selling pressure. The market is now pricing in a higher probability of a slower economic growth, impacting tech stocks disproportionately.
Why $24,323.58 is the Line in the Sand
From a technical perspective, the $24,323.58 level is critical. This support has been tested multiple times in recent weeks and a confirmed break below this level could open the door for a more substantial correction. The 1H chart shows a neutral trend, but with 93% strength signaling a continuation of the bearish movement. With the index now trading at $24,426.25, the bears are certainly pressing.
The Dollar Index (DXY) is also playing a significant role. As Reuters' news reported, the Dollar Index (DXY) has surged past 98.70 amid geopolitical tensions, the DXY currently sits at 99.01, putting additional pressure on risk assets like Nasdaq100. Historically, a strong dollar often correlates with underperformance in equities, especially in sectors with significant international exposure.
Deeper Dive: Multi-Timeframe Analysis
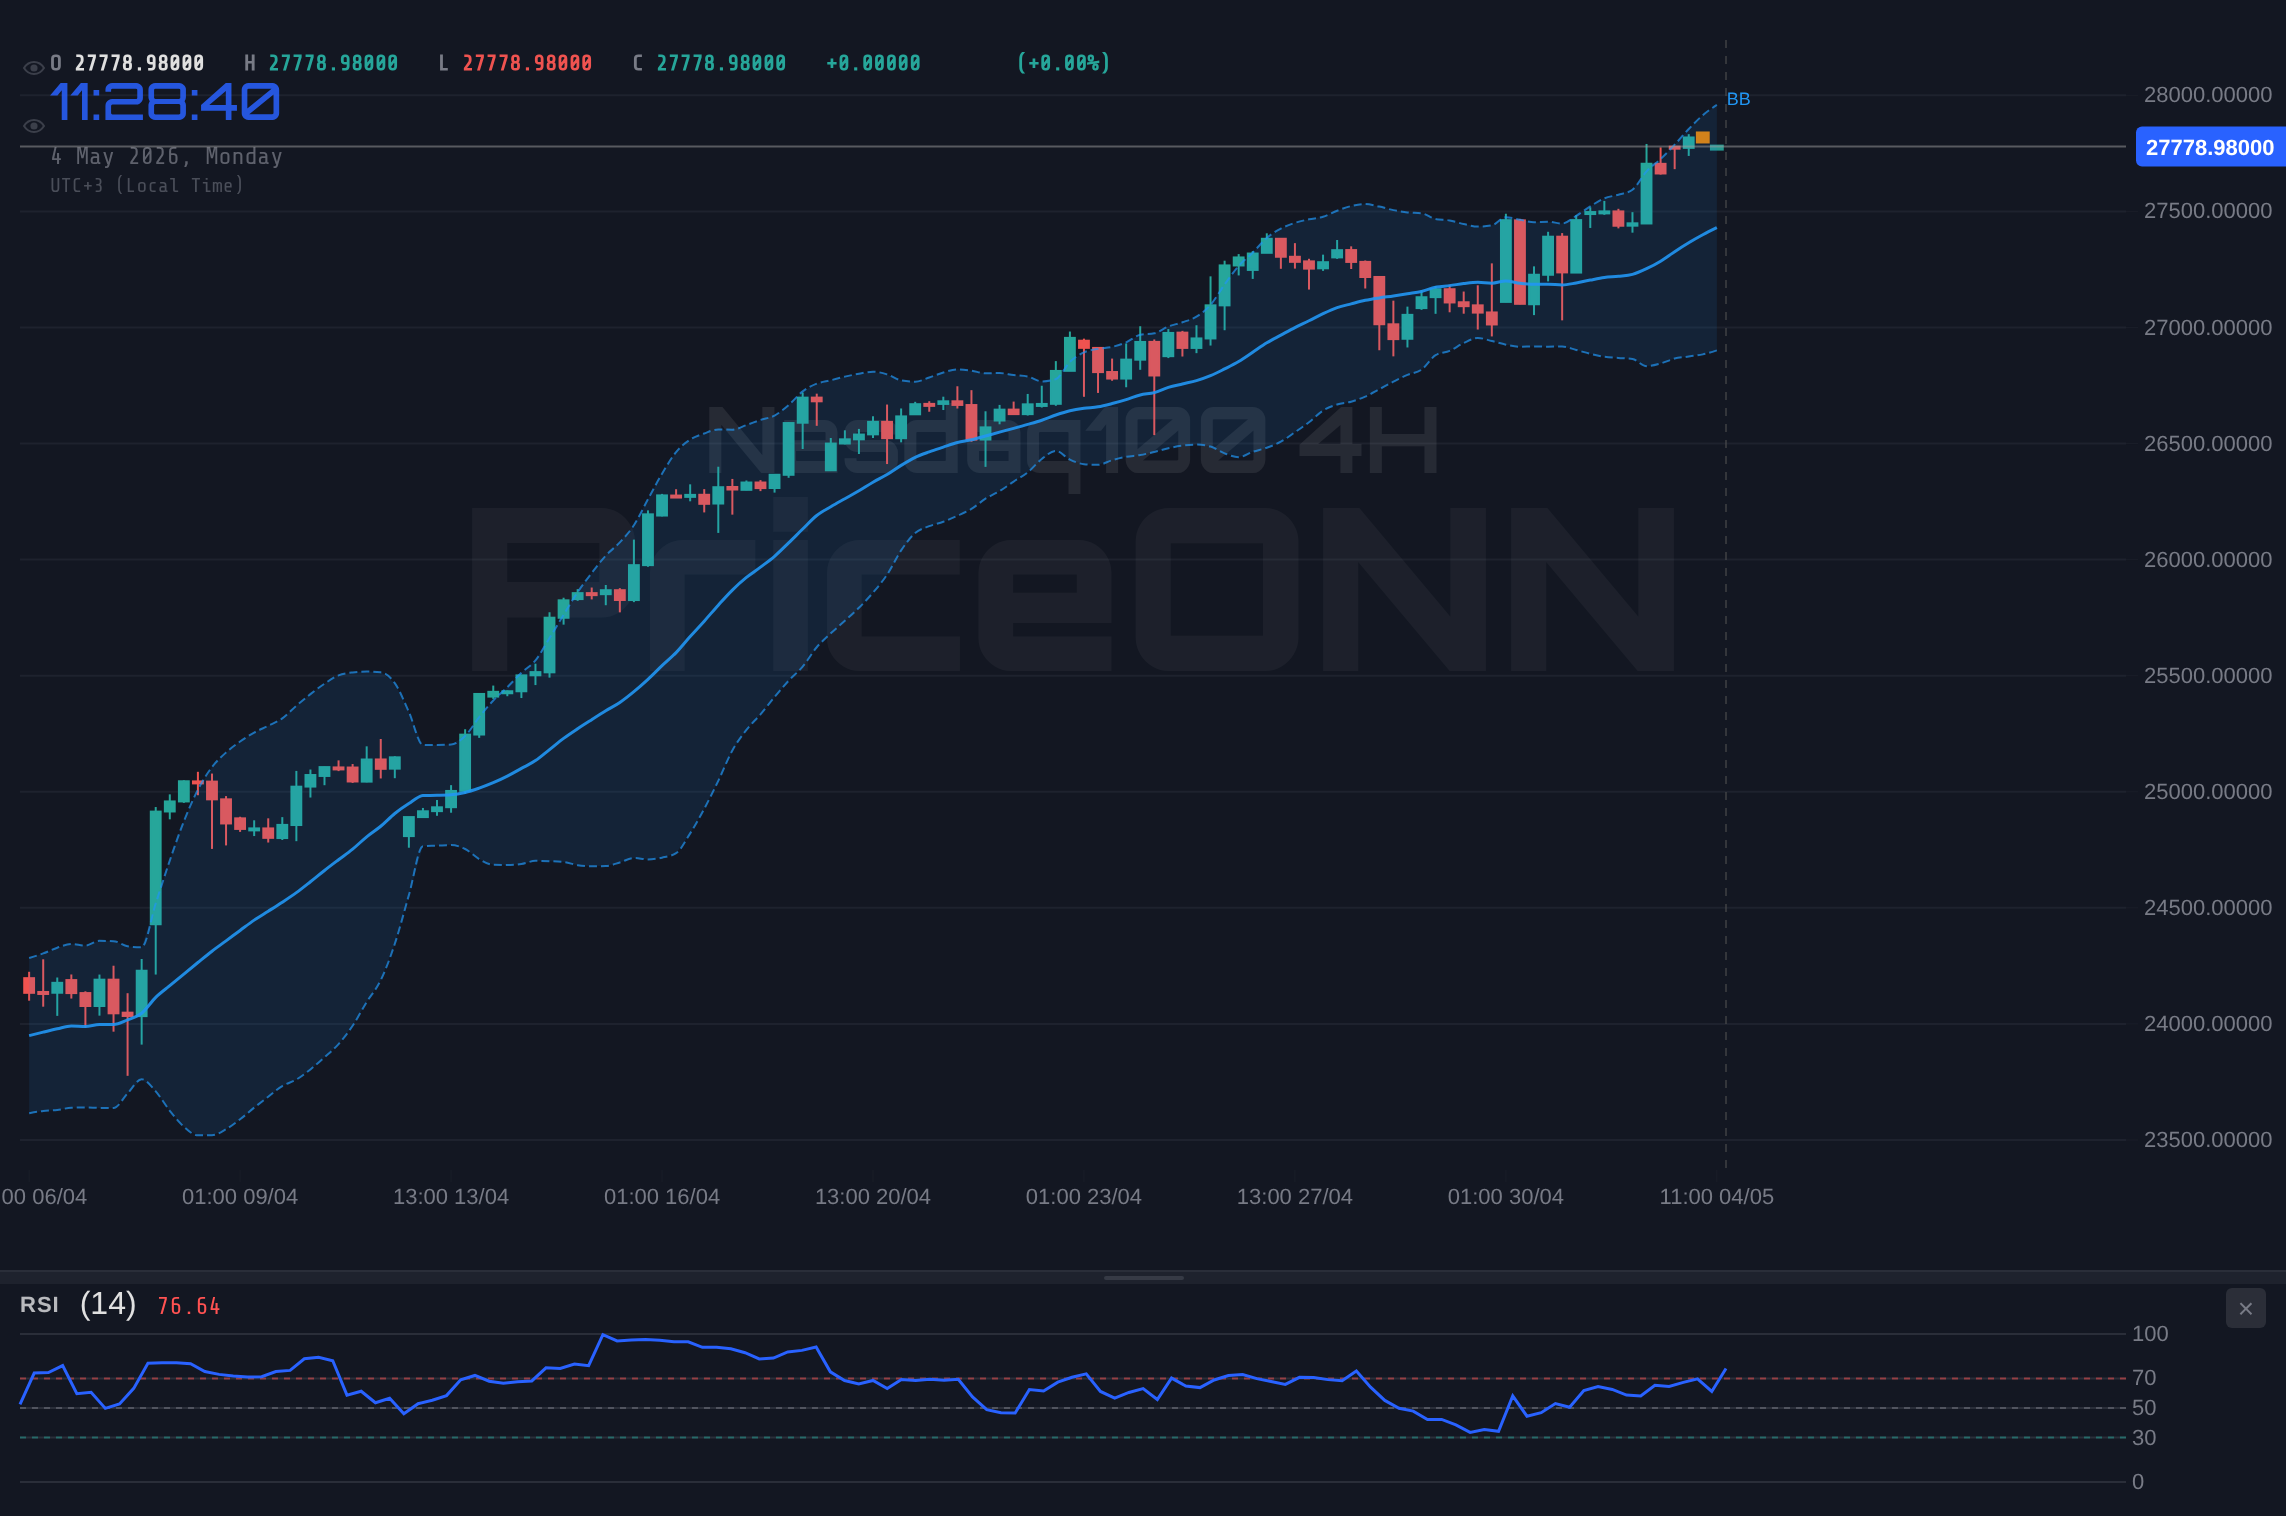
A multi-timeframe analysis provides a clearer picture of the current bearish sentiment. The 1-hour chart indicates a neutral trend, but the 4-hour and 1-day charts reveal a building downside momentum. The ADX on the 1-hour chart sits at 27.35, indicating a strong bearish trend, while the RSI at 28.74 suggests oversold conditions. However, the oversold RSI may simply indicate that the downward momentum is strong and not necessarily a buy signal. The market is clearly in a risk-off mode, correlating with the broader equity selloff.
The daily chart paints a more ominous picture. The ADX at 28.34 confirms the strong downward move, and the Stochastic oscillator at 38.04, 58.41 further reinforces the bearish sentiment. The market is clearly pricing in downside risk. Given the current technical picture, the short-term outlook remains bearish. The key is to watch for confirmation signals, such as a break below $24,323.58, which would likely trigger another wave of selling.
Geopolitical Tensions and Safe-Haven Demand
The escalating geopolitical tensions in the Middle East, as reported by various news outlets, are adding another layer of complexity to the market dynamics. As investors seek safe-haven assets, the demand for U.S. Treasuries increases, pushing yields lower and further impacting risk appetite. This flight to safety is evident in the performance of gold, which, despite the strong dollar, has managed to hold its ground. The S&P 500, currently at 6757.05, is also reflecting this risk-off sentiment, further influencing the Nasdaq100.
With DXY at 99.01, Nasdaq100 is under pressure. This inverse correlation is a key factor to consider when analyzing the current market dynamics. The strength in the dollar is not only impacting Nasdaq100 but also other risk assets, including emerging market currencies and commodities. The upcoming U.S. ISM Non-Manufacturing Purchasing Managers Index (PMI) data on Wednesday will be critical in determining the direction of the dollar and, consequently, the Nasdaq100.
What the MACD Signal Tells Us About Nasdaq100 Trend Analysis
The MACD (Moving Average Convergence Divergence) indicator provides further insight into the current trend. On the 1-hour chart, the MACD histogram is negative, indicating increasing downside momentum. This signal is consistent across multiple timeframes, suggesting that the bearish trend is not just a short-term phenomenon. The MACD signal line is below the zero line, reinforcing the bearish outlook.
However, it's important to note that the MACD is a lagging indicator and should be used in conjunction with other technical tools to confirm the trend. The fact that the RSI is oversold while the MACD shows increasing negative momentum suggests that the market is in a state of disequilibrium. This could mean that the selling pressure is overextended and a short-term bounce is possible. However, until the MACD starts to show signs of convergence, the overall trend remains bearish.
A Trade Plan for the Cautious Trader
Given the current technical and fundamental backdrop, a cautious approach is warranted. The most prudent strategy is to wait for confirmation signals before initiating any new positions. For those looking to short the Nasdaq100, a break below $24,323.58 would provide a clear entry trigger. A stop-loss order should be placed above the $24,499.88 level to protect against any unexpected upside moves. It’s always important to manage your risk, wait for your setup- the market always gives a second chance.
A break below $24,323.58 accelerates selling pressure, targeting $24,237.6 and $24,193.31. Further weakness if U.S. ADP Nonfarm Employment Change data disappoints Wednesday.
Key Economic Events on the Horizon
Several key economic events are on the horizon that could significantly impact the Nasdaq100. On Wednesday, the U.S. ADP Nonfarm Employment Change, U.S. Services Purchasing Managers Index (PMI), U.S. ISM Non-Manufacturing Prices, U.S. ISM Non-Manufacturing Purchasing Managers Index (PMI), and U.S. Crude Oil Inventories data will be released. These data points will provide further insight into the health of the U.S. economy and could influence the Federal Reserve's monetary policy decisions. The market is particularly sensitive to any signs of economic slowdown, as this could prompt the Fed to adopt a more dovish stance.
On Thursday, the U.S. Initial Jobless Claims data will be released, providing another glimpse into the labor market. And on Friday, the U.S. Retail Sales MoM and U.S. Core Retail Sales MoM data will be closely watched for signs of consumer spending. These events, combined with the geopolitical tensions, are creating a volatile and uncertain environment for the Nasdaq100. Amid the current DXY strength and risk-off sentiment, be extra vigilant.
Frequently Asked Questions: Nasdaq100 Analysis
Is Nasdaq100 a good buy right now?
Given the current bearish trend, oversold RSI, and negative MACD, Nasdaq100 is not a good buy right now. A break below the key support at $24,323.58 could trigger further downside. Wait for a confirmation of a trend reversal before considering a long position.
What is the Nasdaq100 price forecast for this week?
The Nasdaq100 price forecast for this week is bearish, with a high probability of testing the $24,237.6 and $24,193.31 levels. However, a short-term bounce is possible if the oversold conditions lead to profit-taking. Watch the upcoming economic data releases for further clues.
What are the key support and resistance levels for Nasdaq100?
Key support levels for Nasdaq100 are at $24,323.58, $24,237.6 and $24,193.31. Key resistance levels are at $24,499.88, $24,585.86 and $24,631.02. A break of either level will dictate the next move.
Why is Nasdaq100 moving today?
Nasdaq100 is moving lower today due to disappointing PMI data, geopolitical tensions, and a strengthening dollar. The combination of these factors is creating a risk-off environment, impacting the index negatively.
Volatility creates opportunity- those prepared will be rewarded. This is exactly where you need to pay attention. Manage your risk, wait for your setup- the market always gives a second chance.
Track markets in real-time
AI-powered analysis, technical indicators and real-time price data.
Join Our Telegram Channel
Breaking market news, AI analysis and trading signals instantly.
Join Channel