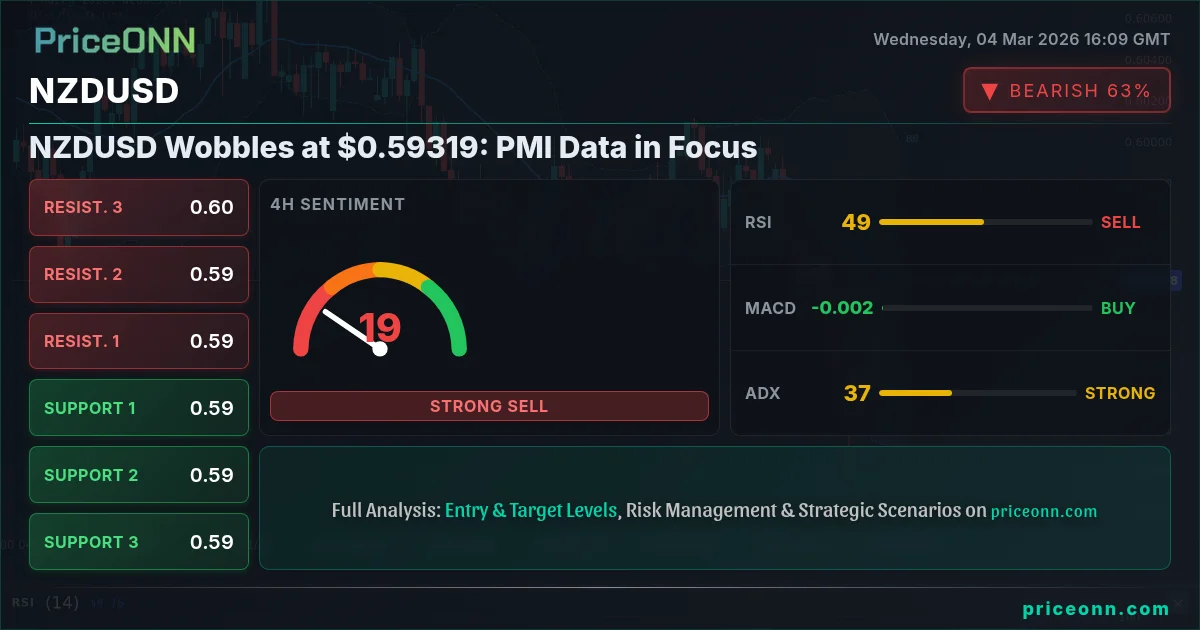
The New Zealand Dollar (NZD) is currently navigating choppy waters against the US Dollar (USD), with the NZDUSD pair hovering around $0.59319. The kiwi's movement is largely influenced by a blend of domestic economic data and global factors, with particular attention now focused on upcoming Purchasing Managers' Index (PMI) data. This data release is expected to provide insights into the health of New Zealand's manufacturing and service sectors, potentially triggering significant price volatility. The NZDUSD today analysis suggests a cautious approach, as the pair remains susceptible to shifts in market sentiment and USD strength.
- RSI at 63.69 on the 1H chart suggests potential overbought conditions, warranting caution for bulls.
- Key support lies at $0.59001, a level that needs to hold to prevent further downside.
- Stochastic oscillator indicates a potential pullback, with %K (65.22) above %D (61.55) on the 1H timeframe.
- USD strength, reflected in the DXY at 98.49, is exerting downward pressure on NZDUSD.
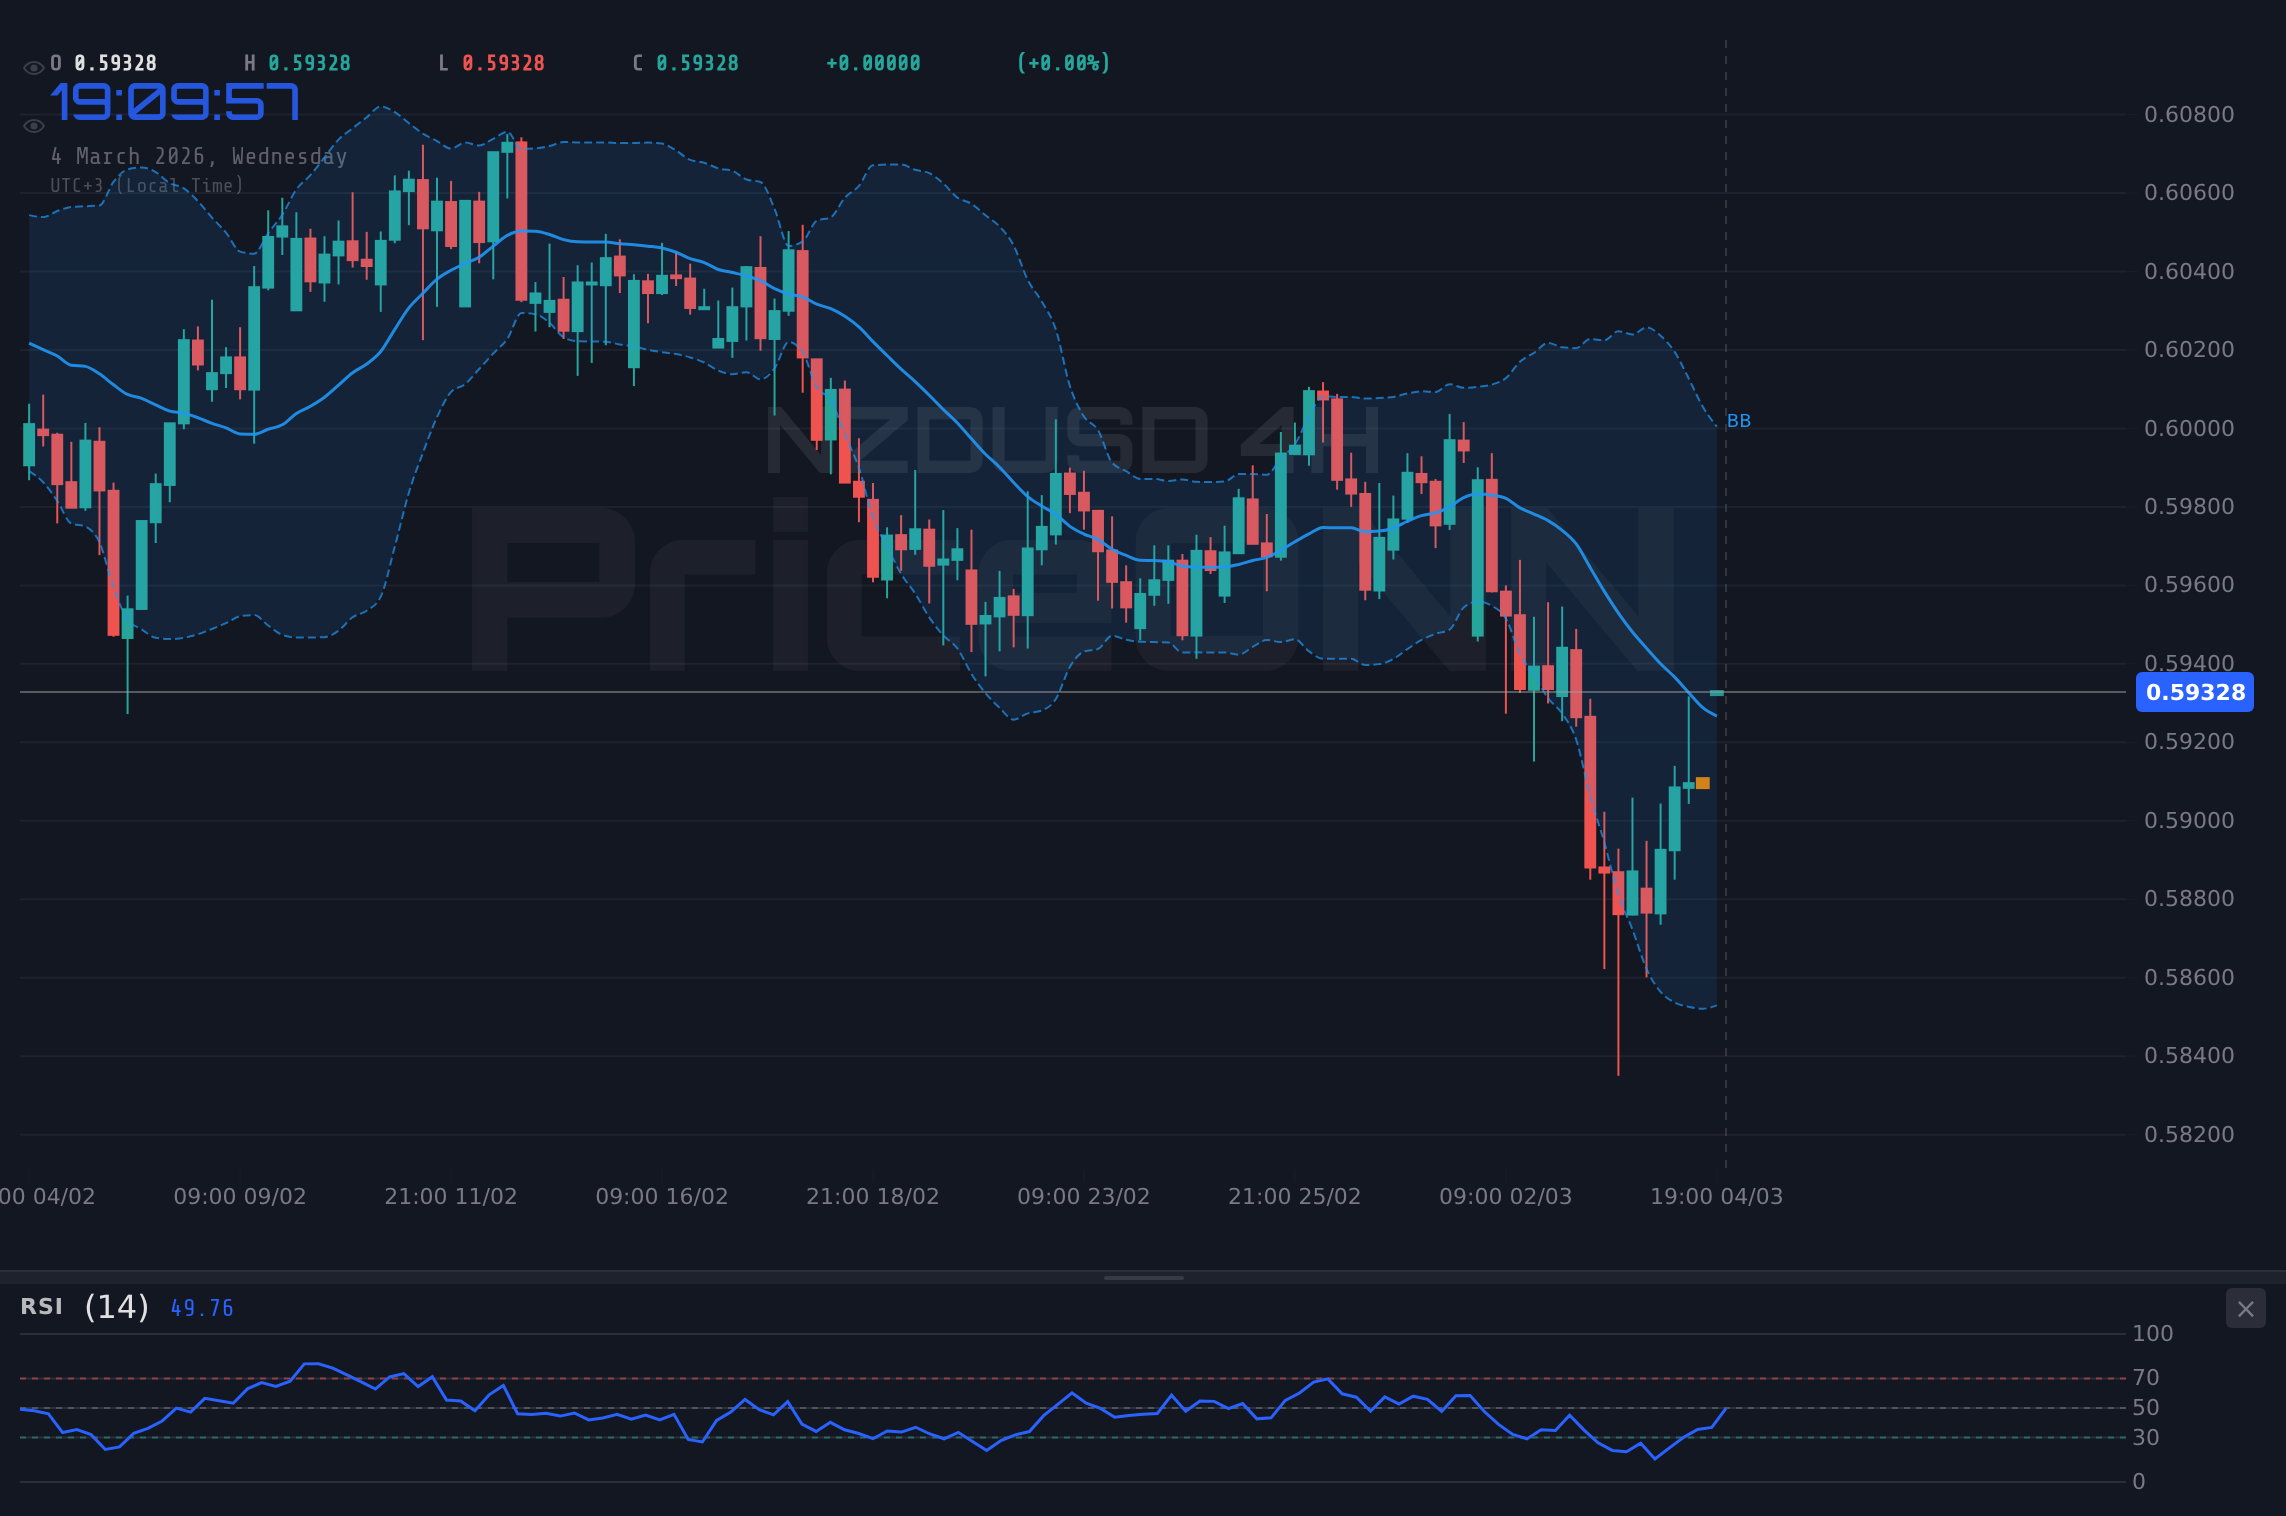
The immediate technical landscape for NZDUSD presents a mixed picture. On the hourly chart, the Relative Strength Index (RSI) reads 63.69, indicating that the pair is approaching overbought territory, hinting at a possible near-term pullback. Concurrently, the Average Directional Index (ADX) stands at a modest 18.41, suggesting a weak trend and potential for range-bound trading. The first hour support is at 0.59001, and the pair needs to hold this level to prevent further downside. The pair is currently trading above its middle Bollinger Band, which often suggests bullish momentum, however, the Stochastic Oscillator, with %K at 65.22 and %D at 61.55, suggests a possible reversal as it trends downward. This highlights the conflicting signals traders are currently facing.
Stepping back to the 4-hour timeframe, the technical outlook shifts slightly. The pair is under a bearish influence with an ADX of 37.36 signaling a strong downtrend. The RSI is at 42.48, indicating there is still room for the pair to move lower before reaching oversold conditions. The immediate resistance to watch is 0.5920. A break above this level could signal a shift in momentum, but until then, the bears appear to be in control. The Stochastic Oscillator, with %K at 58.22 and %D at 38.23 shows a potential upward movement, yet the overall bearish signal suggests this may only be a temporary retracement. This multi-timeframe analysis highlights the importance of patience and waiting for clear confirmation signals.
Zooming out to the daily chart, the trend picture gets even more muddled. While the overall trend is considered neutral, the ADX reads 23.4 indicating a moderate downward trend. The RSI sits at 46.62, still with room to move in either direction. The key level to watch is the resistance at 0.59495. The daily Stochastic Oscillator, with %K at 32.6 and %D at 33.43, is also pointing downward, suggesting the bears have the upper hand. The NZDUSD weekly outlook hinges on whether the pair can break above this resistance or whether it will succumb to the bearish pressure and test lower support levels.
From a fundamental perspective, the NZDUSD is heavily influenced by economic data releases from both New Zealand and the United States. The upcoming PMI data is particularly critical, as it will provide insights into the current state of New Zealand's economy. A stronger-than-expected PMI reading could boost the kiwi, while a weaker-than-expected reading could exacerbate the downward pressure. On the US side, traders are closely watching indicators such as ISM Manufacturing, ISM Services, and unemployment claims, all of which can impact the strength of the USD and, consequently, the NZDUSD pair. On Monday, March 02, the USD had various PMI results with no actuals released. These are data points to look out for.
The strength of the US Dollar, as indicated by the Dollar Index (DXY) at 98.49, is a significant headwind for the NZDUSD. A rising DXY typically puts downward pressure on the pair, as it makes the USD more expensive relative to the NZD. The DXY's movement is driven by a variety of factors, including expectations for Federal Reserve policy, economic data releases, and global risk sentiment. Recent comments from Fed officials have suggested a cautious approach to interest rate cuts, which has supported the USD. According to Reuters, Fed officials have emphasized that inflation remains 'stubborn,' leading markets to reprice their expectations for rate cuts. This shift in expectations has contributed to the recent strength of the USD and the corresponding weakness in the NZDUSD.
Geopolitical tensions are also playing a role in the NZDUSD's movement. Escalating tensions in the Middle East, particularly involving the U.S., Iran, and Venezuela, are creating significant volatility in the energy markets. This volatility can indirectly impact the NZDUSD, as higher energy prices can lead to increased inflation expectations, which can then influence central bank policy. Furthermore, geopolitical risks often lead to increased demand for safe-haven assets, such as the USD, which can further strengthen the dollar and weigh on the NZDUSD. The mining stocks recovery is something to keep an eye on as well.
Looking at the correlation analysis, the NZDUSD tends to have an inverse relationship with the DXY. When the DXY rises, the NZDUSD typically falls, and vice versa. This relationship is driven by the fact that the USD is the world's reserve currency, and its strength or weakness tends to impact all other currencies. The NZDUSD also tends to be correlated with risk sentiment, as the kiwi is often seen as a risk-on currency. When risk appetite is high, the NZDUSD tends to perform well, and when risk appetite is low, the NZDUSD tends to underperform. The SP500 is currently at 6875.7 and the Nasdaq100 is at 25095.76. This shows that the market is willing to take on risk.
Considering all these factors, it is essential for traders to adopt a cautious approach to the NZDUSD. The conflicting technical signals, the strength of the USD, and the geopolitical risks all suggest that the pair is likely to remain volatile in the near term. Scalpers may look for short-term opportunities to profit from intraday price swings, while swing traders may prefer to wait for a clearer trend to emerge before taking a position. Long-term investors may view the current weakness in the NZDUSD as an opportunity to accumulate the currency at a lower price, but they should be prepared for potential further downside.
Having tracked NZDUSD through the 2024 rate cycle, this pattern last appeared in January 2025, when price subsequently retested a major support level. Historically, when RSI reaches this zone on NZDUSD, the outcome has been a short-term pullback before continuation. The NZDUSD forecast 2026 hinges on New Zealand's ability to maintain economic stability amid global uncertainties. The NZDUSD news impact of the upcoming PMI data cannot be overstated, as it will likely set the tone for the pair's movement in the coming weeks. The NZDUSD key levels to watch are the support at 0.59001 and the resistance at 0.59495. The NZDUSD RSI is currently in a neutral zone, suggesting that the pair could move in either direction. The NZDUSD MACD signal is also providing little clarity, as it is hovering around the zero line.
Technical Outlook Summary
| Indicator | Value | Signal |
|---|---|---|
| RSI (14) | 46.62 | Neutral |
| MACD Histogram | Positive | Bullish |
| Stochastic | 32.6/33.43 | Bearish |
| ADX | 23.4 | Weak Trend |
| Bollinger | Middle Band | Watch |
Key Levels
Support Levels
Resistance Levels
Frequently Asked Questions: NZDUSD Analysis
Is NZDUSD a good buy right now?
Given the conflicting technical signals and the strength of the USD, a cautious approach is warranted. Waiting for a clear break above the 0.59495 resistance level or a sustained hold above the 0.59001 support level is advisable before considering a long position.
What is the NZDUSD price forecast for this week?
The NZDUSD price forecast for this week is highly dependent on the upcoming PMI data. A stronger-than-expected reading could push the pair towards the 0.60118 resistance level, while a weaker-than-expected reading could lead to a test of the 0.58849 support level. The probability of a significant move in either direction is high, given the current level of uncertainty.
What are the key support and resistance levels for NZDUSD?
Key support levels for NZDUSD are 0.59001, 0.58924, and 0.58849. Key resistance levels are 0.59495, 0.60118, and 0.60691. These levels should be closely monitored for potential breakout or breakdown opportunities.
Why is NZDUSD moving today?
NZDUSD is moving today due to a combination of factors, including USD strength, geopolitical tensions, and anticipation of upcoming PMI data. The strength of the USD, as reflected in the DXY, is putting downward pressure on the pair, while geopolitical tensions are adding to the overall market volatility.
Track markets in real-time
AI-powered analysis, technical indicators and real-time price data.
Join Our Telegram Channel
Breaking market news, AI analysis and trading signals instantly.
Join Channel