Having tracked XAGUSD through multiple economic cycles, the current plunge to $78.65 presents a compelling scenario for traders. The confluence of a strengthening Dollar Index (DXY) and disappointing Purchasing Managers Index (PMI) data has created significant downward pressure on silver, but is this a temporary setback or a sign of deeper troubles? A closer look at the technicals and fundamentals is warranted to gauge the potential for a rebound or further declines. This XAGUSD today analysis aims to provide clarity and actionable insights for traders navigating these volatile conditions.
- RSI at 24.6 signals oversold conditions on the 1H chart, hinting at a potential bounce.
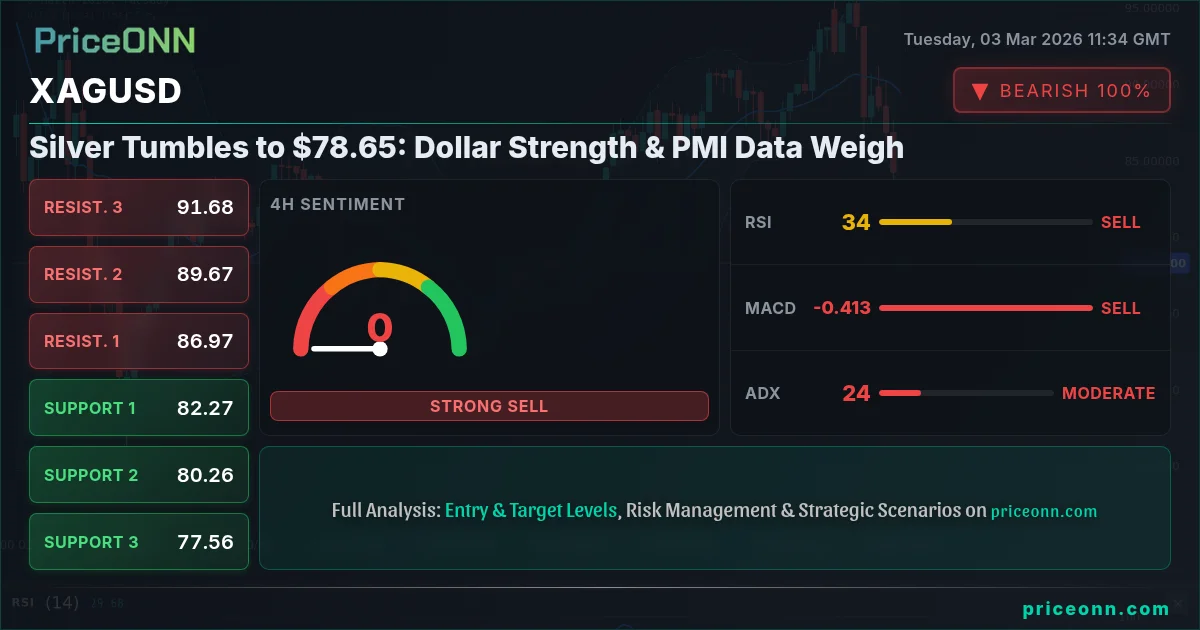
- Critical resistance sits at $85.48, a level bulls need to reclaim for upside momentum.
- MACD histogram confirms negative momentum, but divergence could signal bullish reversal.
- DXY's surge to 99.04 exerts downward pressure on XAGUSD, inverse correlation in play.
Silver Price Analysis Today: The Technical Picture
The hourly chart paints a clear picture of the immediate challenges facing XAGUSD. The Relative Strength Index (RSI) currently sits at 24.6, firmly within oversold territory. While this suggests that silver may be due for a bounce, oversold conditions can persist in strong downtrends. The key is to watch for confirmation signals, such as a break above the immediate resistance level of $85.48. A sustained move above this level would indicate that the bulls are regaining control.
However, the Moving Average Convergence Divergence (MACD) indicator tells a more cautious story. The MACD histogram remains negative, indicating that bearish momentum is still in play. Traders should be wary of false breakouts and wait for the MACD to turn positive before committing to long positions. Look for a potential bullish divergence- where price makes lower lows, but the MACD makes higher lows, signaling a potential weakening of the downtrend and a possible reversal.
The Average Directional Index (ADX) currently reads 36.96 on the 1H timeframe, signifying a strong downtrend. This means that any attempt to buck the trend could be met with significant resistance. The ADX is a measure of trend strength, not direction. An ADX above 25 generally indicates a strong trend, while an ADX below 20 suggests a weak or range-bound market. Therefore, with the ADX at 36.96, it's wise to respect the prevailing bearish momentum.
Diving Deeper: Multi-Timeframe Analysis of XAGUSD
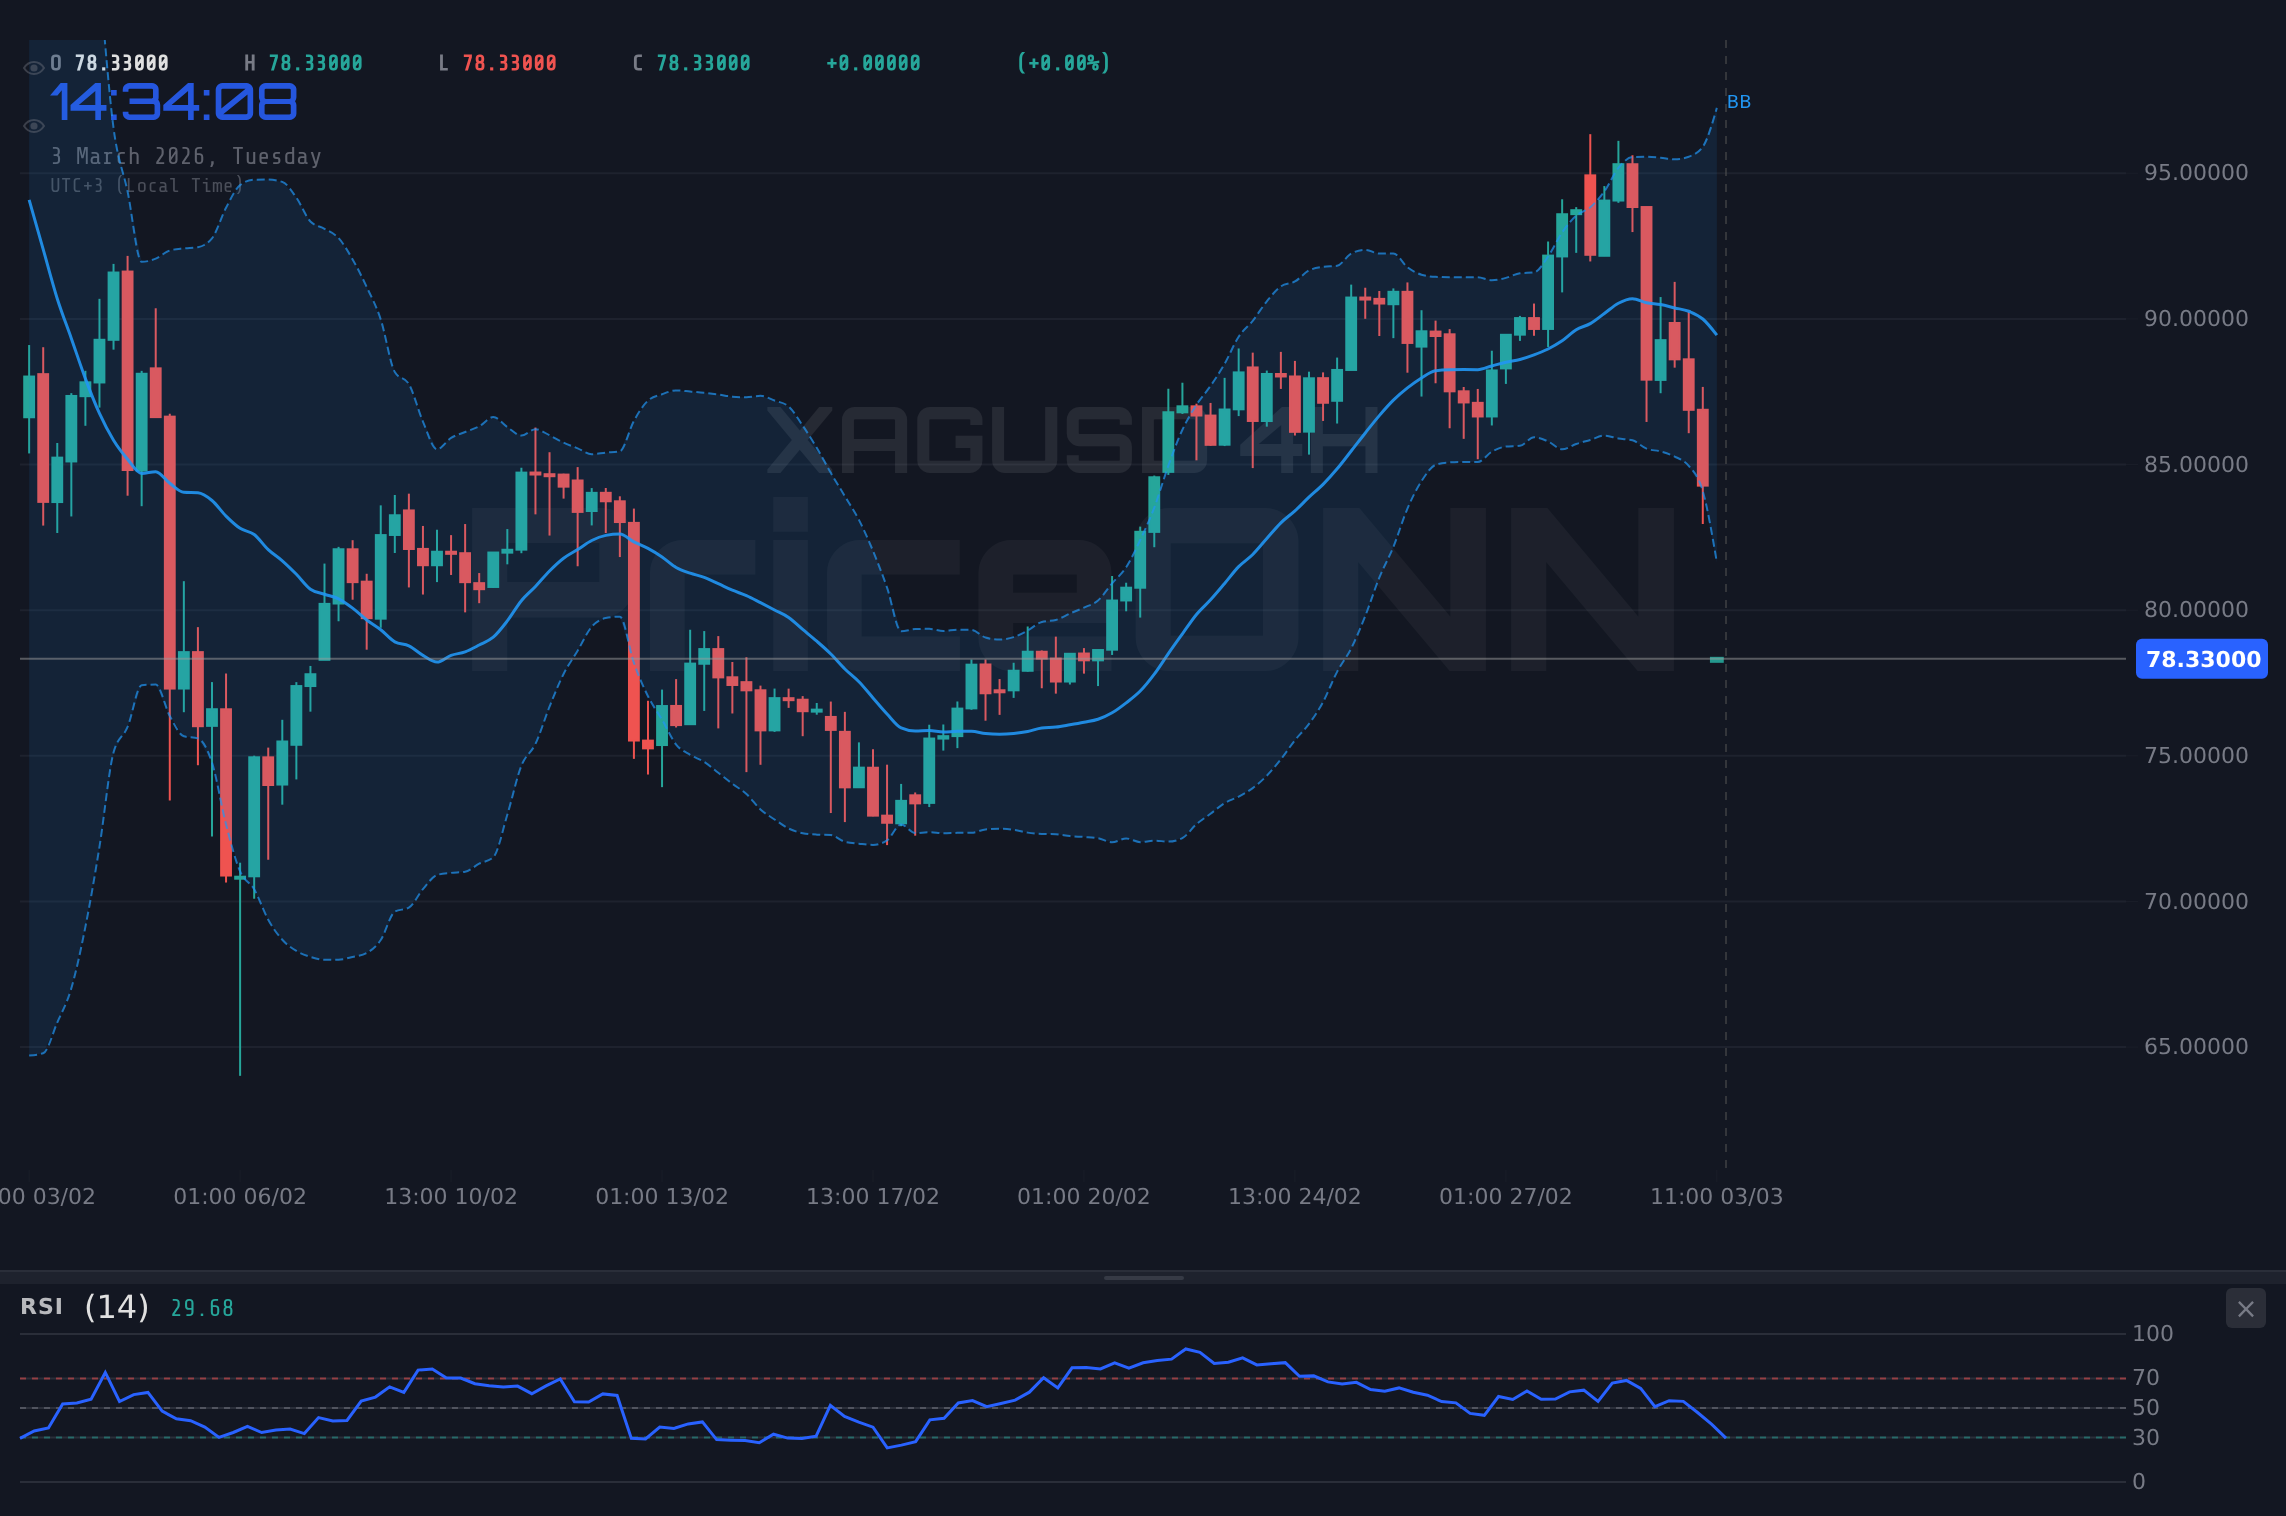
Zooming out to the 4-hour timeframe provides a broader perspective on the silver price action. The RSI here is also in oversold territory at 29.96, but not as extreme as the hourly chart. This suggests that the selling pressure may be starting to abate, but a sustained recovery is not yet confirmed.
The MACD on the 4-hour chart mirrors the hourly, with negative momentum still in control. The price is trading below the middle band of the Bollinger Bands, indicating a bearish trend. The lower band, currently near $75, could act as a support level, but a break below this level could open the door for further declines. Watch for the price to break above the middle band to signal a potential shift in momentum.
On the daily timeframe, XAGUSD presents a mixed picture. The RSI is neutral at 45.06, indicating neither overbought nor oversold conditions. The MACD is positive, suggesting that the longer-term trend may still be bullish, despite the recent selloff. However, the Stochastic oscillator signals a bearish crossover, indicating that the short-term momentum is to the downside. This conflicting signal suggests that caution is warranted, and traders should wait for further confirmation before making any major decisions.
Fundamental Drivers: DXY Strength and PMI Data
The recent weakness in XAGUSD can be attributed to two primary factors: a strengthening Dollar Index (DXY) and disappointing PMI data. The DXY, which measures the value of the U.S. dollar against a basket of other currencies, has surged to 99.04. This surge is largely driven by escalating geopolitical tensions in the Middle East, as highlighted by a recent Forex News report, leading to a flight to safe-haven assets like the U.S. dollar. As the dollar strengthens, it puts downward pressure on dollar-denominated commodities like silver.
Adding to the bearish sentiment is the release of weaker-than-expected PMI data. While specific PMI figures for the U.S. aren't available in the provided data, the upcoming U.S. Services Purchasing Managers Index (PMI) on Wednesday, March 4th, with an expected value of 52.3 (previous 52.7), is a key indicator to watch. A reading below 50 would indicate a contraction in the services sector, which could further weigh on risk appetite and boost the dollar, exacerbating the downward pressure on silver. The S&P Global Japan Services Purchasing Managers' Index (PMI) is also on the radar, with expectations set at 53.8.
Industrial demand for silver is another crucial factor to consider. Silver has both safe-haven and industrial properties, making it more volatile than gold. The percentage of industrial demand for silver versus gold is a key metric, as stronger industrial activity typically supports silver prices. Traders should monitor economic data and industry reports to gauge the strength of industrial demand for silver.
Key Levels to Watch for XAGUSD
Traders should pay close attention to key support and resistance levels to gauge the potential for future price movements. Immediate support lies at $83.02, followed by $81.76 and $80.55. A break below $80.55 could trigger a further selloff towards the $75 level. On the upside, immediate resistance is at $85.48, followed by $86.69 and $87.95. A sustained move above $87.95 would suggest that the bulls are regaining control, and a retest of recent highs could be in the cards.
On the 4H timeframe, support levels are identified at $85.22, $83.57, and $81.06, while resistance sits at $89.39, $91.89, and $93.55. The daily chart identifies support at $85.04, $80.81, and $75.16, with resistance at $94.92, $100.57, and $104.8. These levels can be used to identify potential entry and exit points, as well as to set stop-loss orders to manage risk.
Having tracked XAGUSD through volatile periods, it's clear that patience is essential. The conflicting signals across different timeframes and the influence of external factors like the DXY and PMI data make it challenging to pinpoint the exact timing of a reversal. However, by focusing on key levels and monitoring the technical indicators, traders can position themselves to capitalize on future opportunities.
Frequently Asked Questions: XAGUSD Analysis
Is XAGUSD a good buy right now?
Given the current downtrend and oversold conditions, XAGUSD may present a buying opportunity for contrarian traders. However, caution is warranted, and traders should wait for confirmation signals, such as a break above the $85.48 resistance level, before committing to long positions.
What is the XAGUSD price forecast for this week?
The XAGUSD price forecast for this week is highly dependent on upcoming economic data releases and geopolitical developments. A sustained break above $87.95 could pave the way for a retest of recent highs, while a break below $80.55 could trigger further declines towards the $75 level.
What are the key support and resistance levels for XAGUSD?
Key support levels for XAGUSD are identified at $83.02, $81.76, and $80.55, while key resistance levels are at $85.48, $86.69, and $87.95. These levels can be used to identify potential entry and exit points, as well as to set stop-loss orders to manage risk.
Why is XAGUSD moving today?
XAGUSD is moving today due to a combination of factors, including a strengthening Dollar Index (DXY) driven by geopolitical tensions and weaker-than-expected PMI data. These factors have created significant downward pressure on silver prices.
Track markets in real-time
AI-powered analysis, technical indicators and real-time price data.
Join Our Telegram Channel
Breaking market news, AI analysis and trading signals instantly.
Join Channel