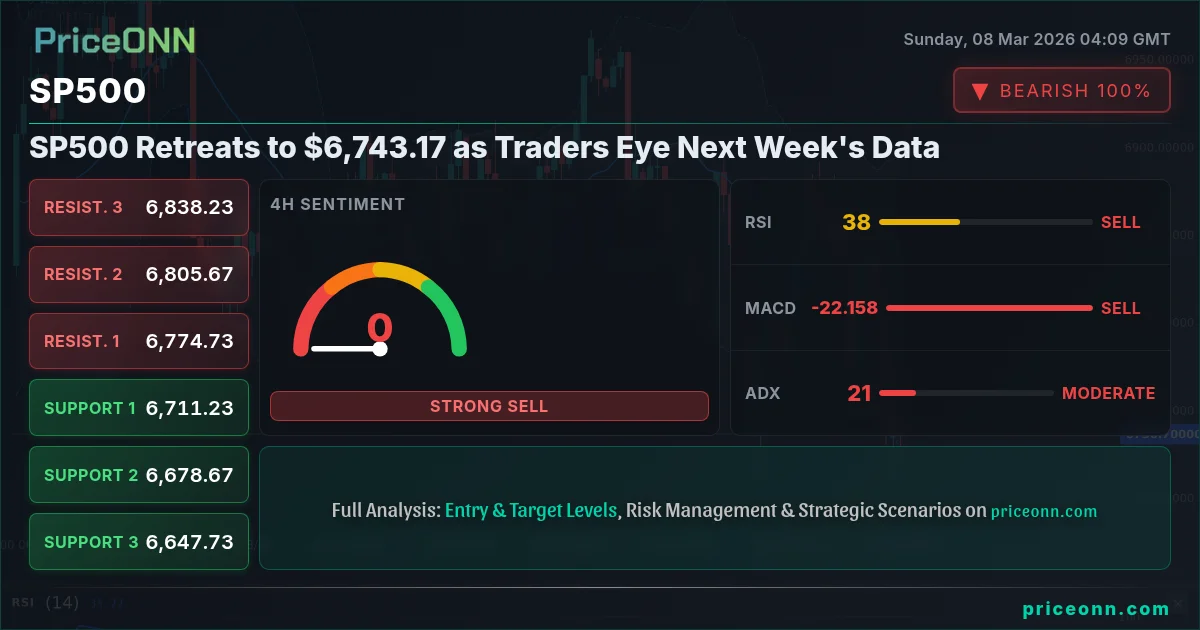
The SP500 is at a critical juncture, trading near $6,743.17. Bulls and bears are locked in a tug-of-war, leaving investors uncertain about the index's next move. The question is: will the bulls regain control, or will the bears push the SP500 lower?
- RSI at 39.59 signals further downside potential, but nearing oversold conditions.
- Critical support lies at $6,739.5, a break below could trigger a steeper selloff.
- MACD histogram shows negative momentum: bearish sentiment is gaining traction.
- Fed rate expectations driving SP500 correlation with DXY.
The Bull Case for SP500: A Temporary Dip?
The bullish argument rests on the idea that the recent pullback is a healthy correction within a larger uptrend. Key support levels are holding, and underlying economic fundamentals, while mixed, are not dire enough to justify a major market downturn. The SP500's current level of $6,743.17 might present a buying opportunity for those who believe in the long-term growth story. The market is simply taking a breather after a strong run, and dip buyers will soon emerge to push prices higher.
One key factor supporting the bull case is the relatively strong performance of the labor market. Although the U.S. Weekly Economic & Financial Commentary on March 7th suggested a negative jobs report, with nonfarm payrolls slipping by 92K, the overall picture remains resilient. This could provide a cushion for consumer spending and corporate earnings, ultimately supporting the SP500. The 1H timeframe shows a Stochastic reading of K=34.44 and D=27.04, suggesting a potential bullish reversal in the short term.
Furthermore, the bullish narrative points to the possibility of a dovish shift in Fed policy impact on SP500. While the central bank has maintained a hawkish stance, the market is anticipating a potential easing of monetary policy later in the year. This expectation is fueled by concerns about slowing economic growth and the potential for financial instability. The anticipation of lower interest rates could provide a boost to equity valuations, pushing the SP500 higher.
Technically, the bulls are hoping to see the SP500 hold above the 6,739.5 level, which represents the first hourly support. A successful defense of this level could signal a resumption of the uptrend and pave the way for a retest of the recent highs near 6,845.6. A daily close above $6,770.4 would open the door for a move towards the R2 resistance at $6,787.5, reinforcing the bullish scenario.
The Bear Case for SP500: A Deeper Correction Looms?
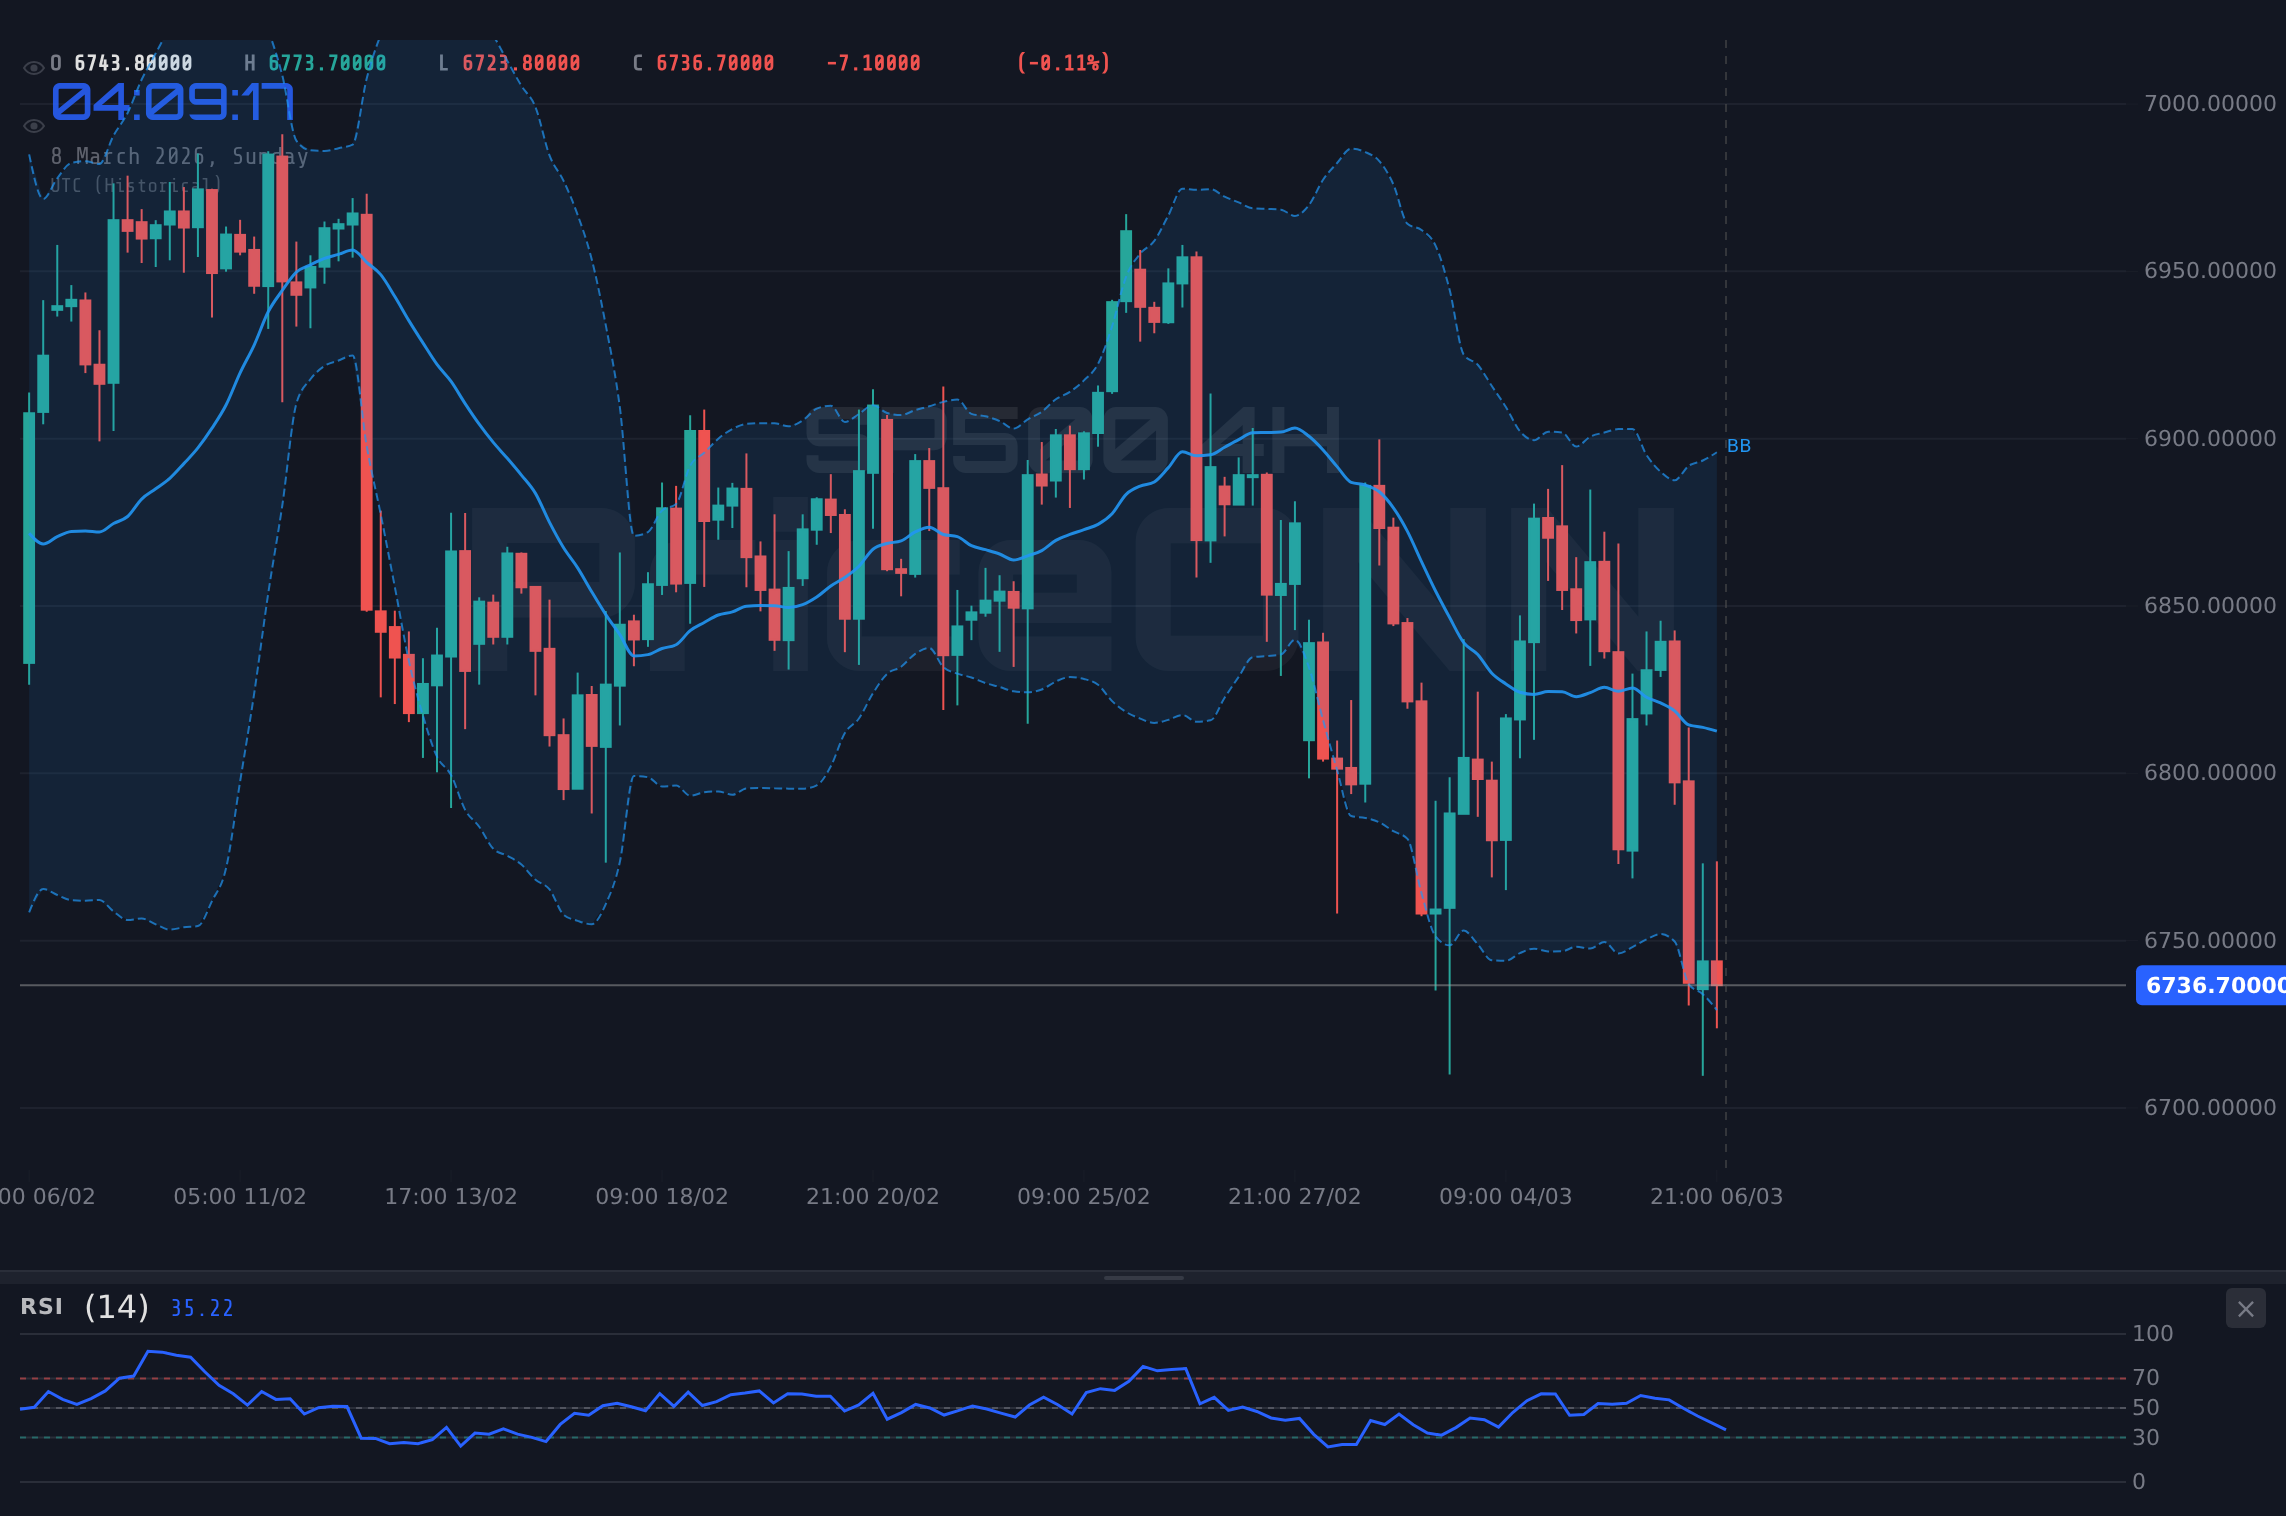
The bearish argument paints a more ominous picture, suggesting that the recent pullback is not merely a temporary dip but the beginning of a more significant correction. The bears point to several factors that could trigger a deeper selloff, including slowing economic growth, rising inflation, and geopolitical risks. The current market environment is fragile, and a negative catalyst could easily send the SP500 tumbling. The index is overvalued, and a correction is overdue. The SP500's daily chart shows a RSI reading of 39.59 and MACD with negative momentum, indicating a bearish trend.
A major concern for the bears is the potential impact of rising oil prices. The escalating oil crisis, triggered by Middle East tensions, is sending shockwaves through forex markets, as reported by PriceONN news. Brent crude oil prices are nearing $90 a barrel due to escalating tensions in the Middle East, specifically disruptions to supply chains. This could fuel inflation and put pressure on corporate earnings, ultimately weighing on the SP500. Given the strong inverse correlation of the DXY (Dollar Index) with SP500, the Dollar Index's position at 98.57 is providing more downward pressure. A strong dollar often negatively impacts the SP500 as it makes exports more expensive and can signal tighter financial conditions.
Furthermore, the bearish narrative highlights the risk of a policy mistake by the Federal Reserve. The central bank is caught between a rock and a hard place, trying to combat inflation without triggering a recession. If the Fed tightens monetary policy too aggressively, it could choke off economic growth and send the SP500 into a tailspin. The market is underestimating the Fed's resolve to fight inflation, and a hawkish surprise could trigger a sharp correction.
Technically, the bears are targeting a break below the 6,739.5 support level, which could trigger a cascade of selling pressure. A decisive move below this level would open the door for a test of the next support level at 6,725.7. A daily close below $6,707.43 would confirm the bearish trend and pave the way for a move towards the S3 support at $6,624.33.
Technicals as Tiebreaker: Which Way Will SP500 Break?
The technical indicators offer a mixed picture, providing ammunition for both the bulls and the bears. On the one hand, the RSI at 39.59 suggests that the SP500 is approaching oversold territory, which could signal a potential bounce. On the other hand, the MACD histogram shows negative momentum, indicating that bearish sentiment is gaining traction. The ADX, however, is at 19.71, indicating a weak trend. This suggests that the market is choppy and ranging, making it difficult to predict the next move with certainty.
A multi-timeframe analysis reveals further complexities. On the 1H chart, the Stochastic oscillator shows a potential bullish crossover, suggesting a short-term bounce. However, on the 4H chart, the Stochastic is oversold, indicating that the SP500 could be due for a deeper correction. This divergence in signals highlights the uncertainty in the market and the need for caution.
The Bollinger Bands also offer conflicting signals. The SP500 is currently trading near the lower band, which could suggest that it is oversold and due for a bounce. However, the bands are widening, indicating that volatility is increasing, which could lead to further downside. The key takeaway is that the technical indicators are not providing a clear signal, and traders should be prepared for a volatile trading environment.
For scalpers, the hourly chart might offer some short-term trading opportunities, but the overall trend remains unclear. Swing traders should wait for a clearer signal before taking a position, focusing on key support and resistance levels. Long-term investors should remain cautious and consider hedging their portfolios against further downside.
Trade Recommendation: WATCH_ZONE
Given the conflicting signals and the choppy market conditions, the current recommendation is to remain in a WATCH_ZONE. The ADX at 19.71 suggests that the market is ranging, making trade plans risky. While the RSI and MACD histogram are aligned, providing a clear directional signal, the overall uncertainty warrants caution. The Stochastic is in a tradeable zone, but not at extreme levels, further reinforcing the need to wait for a clearer setup.
A daily close above the $6,770.4 resistance level would open the door for a more bullish outlook, potentially targeting the 6,787.5 level. This would require strong confirmation from other technical indicators and a positive shift in market sentiment. Until then, patience is key. Manage your risk, wait for your setup - the market always gives a second chance.
Frequently Asked Questions: SP500 Analysis
Is SP500 a good buy right now?
At $6,743.17, whether SP500 is a good buy depends on your risk tolerance and investment horizon. A break below the 6,739.5 support could signal further downside, so cautious investors might wait for confirmation of a bounce before entering a long position.
What is the SP500 price forecast for this week?
The SP500 price forecast for this week is highly uncertain, with potential for both upside and downside. A break above the 6,770.4 resistance could lead to a test of 6,787.5, while a break below 6,739.5 could trigger a move towards 6,725.7.
What are the key support and resistance levels for SP500?
Key support levels for SP500 are 6,739.5, 6,725.7 and 6,707.43. Key resistance levels are 6,770.4, 6,787.5, and 6,845.6. These levels should be closely monitored for potential trading opportunities.
Why is SP500 moving today?
SP500 is moving today due to a combination of factors, including rising oil prices driven by Middle East tensions and uncertainty surrounding Fed policy. These factors are creating volatility and contributing to the choppy market conditions.
Technical Outlook Summary
| Indicator | Value | Signal |
|---|---|---|
| RSI (14) | 39.59 | Neutral |
| MACD Histogram | Negative | Bearish |
| Stochastic | 38.91/51.94 | Bearish |
| ADX | 19.71 | Weak Trend |
| Bollinger | Lower Band | Watch |
Key Levels
Support Levels
Resistance Levels
Track markets in real-time
AI-powered analysis, technical indicators and real-time price data.
Join Our Telegram Channel
Breaking market news, AI analysis and trading signals instantly.
Join Channel