ドル円、地政学リスクで158.50ドルへの抵抗を注視
ドル円は158.50ドルの抵抗水準付近で推移。地政学的な緊張とFRBの政策期待が複雑な取引環境を生み出している。テクニカル分析は慎重な見通しを示唆。
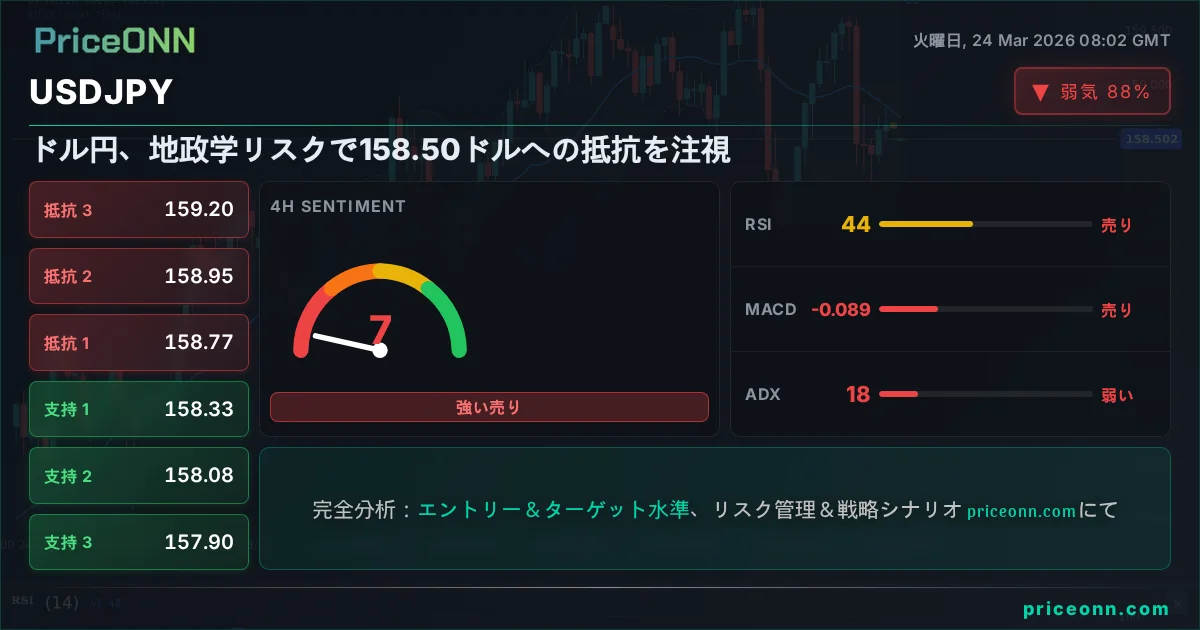
ドル円(USD/JPY)は現在、重要な節目を通過しており、158.50ドルという節目となる抵抗水準のすぐ下で推移しています。この戦略的な位置は単なるテクニカルな観測ではなく、世界金融市場を形成している金融政策への期待と地政学的な緊張の高まりとの複雑な相互作用を反映しています。トレーダーやアナリストが全ての値動きを精査する中、この通貨ペアがこの主要な心理的障壁を突破するのか、それとも後退するのか、そしてその決定をどのような触媒が推進するのかが、誰もが抱える疑問となっています。ドル円分析今日、この水準は特に注目されています。
- ドル円は158.50ドルの重要な抵抗水準付近で取引されており、現在の価格は158.504ドルです。
- 中東情勢を中心とした地政学的なイベントとその原油価格および安全資産需要への影響は、大きなボラティリティを生み出し、ドル円のような通貨ペアに影響を与えています。
- テクニカル指標はまちまちな状況を示しています。1時間足と4時間足チャートでは弱気のモメンタムが見られますが、日足チャートは基盤となる強さを示唆しており、さらなる触媒なしでは明確な方向性への動きは不確実です。
- 米ドルインデックス(DXY)は強さの兆候を示しており、現在98.95で取引されています。これは通常ドル円に下落圧力を及ぼしますが、円固有の弱体化要因によって相殺されています。
- 強気の継続には158.50ドルを上回る持続的なブレークが必要であり、主要サポートである158.331ドルを下回る終値は、より深い調整を示唆する可能性があります。
抵抗帯の航海:テクニカルな綱渡り
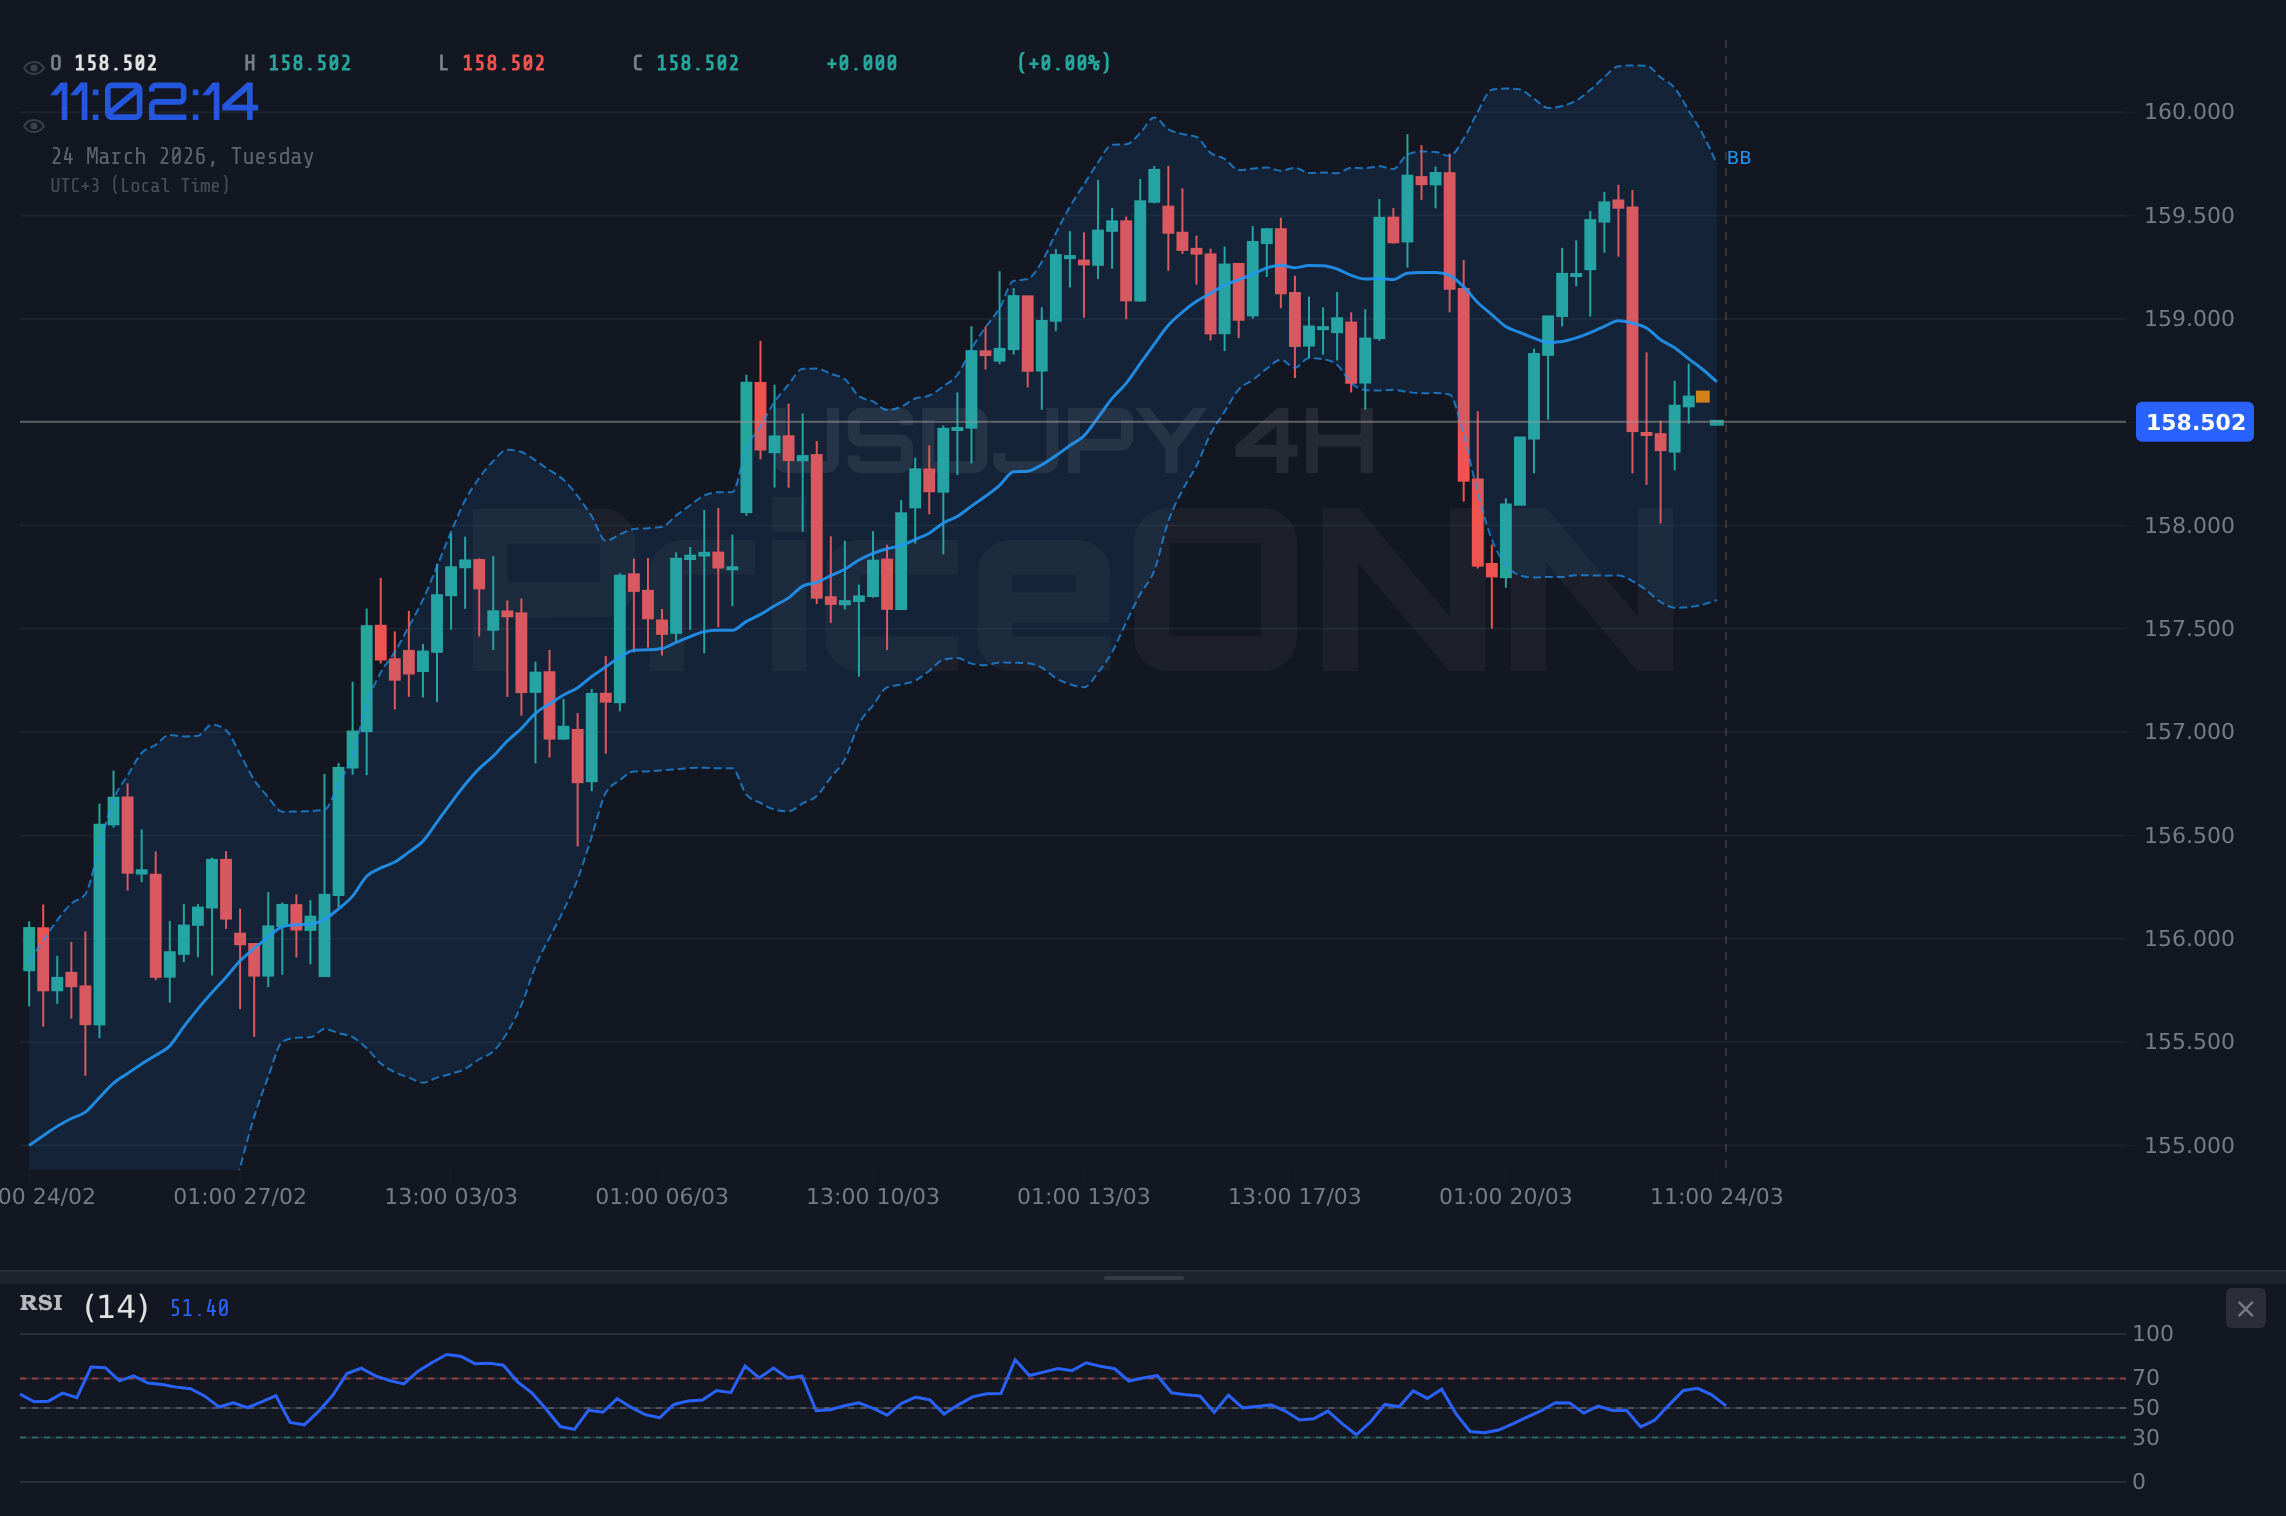
1時間足チャート:モメンタムの攻防
The 1-hour timeframe for USD/JPY paints a picture of indecision, a market caught between conflicting signals. With the price currently at $158.504, it's testing resistance levels that have previously capped upward movement. The ADX at 30.44 indicates a strong trend, but the RSI(14) at 43.71 suggests a bearish eğilim, signaling that momentum might be waning in the short term. The MACD histogram, while positive, is positioned below the signal line, a nuance that often precedes a bearish crossover. Stochastic shows %K at 60.66 and %D at 82.04, indicating a bearish signal as %K falls below %D, reinforcing the idea that the immediate upward push might be losing steam. This mixed technical landscape on the hourly chart suggests that scalpers and day traders might be cautious, waiting for a clearer directional cue before committing significant capital. The proximity to the $158.50 mark is crucial; a failure to break decisively above this level could lead to a pullback towards the immediate support at $158.533, or even deeper if selling pressure intensifies.4時間足チャート:根強い弱気の見通し
Shifting to the 4-hour timeframe, the picture for USD/JPY becomes more defined, leaning towards a bearish outlook. The trend is noted as neutral with a power of 50%, but the indicators within this timeframe paint a different story. The RSI(14) stands at 44.51, continuing the bearish eğilim seen on the hourly chart. The MACD is firmly in negative momentum, with the MACD line below its signal line, a classic bearish signal. Bollinger Bands show the price below the middle band, indicating downward pressure, and the ADX at 18.23, while suggesting a weaker trend, still points to a potential continuation of the existing downtrend rather than a strong reversal. The Stochastic oscillator, with K at 28.85 and D at 47.76, strongly confirms the bearish sentiment, as %K is well below %D and in oversold territory. Support levels at $158.331 and $158.082 become key focus areas if the bearish momentum gains traction. This timeframe suggests that any immediate upside might be limited, and the market is more susceptible to downside pressure if key resistance holds.日足チャート:相反する視点
On the daily chart, USD/JPY presents a more nuanced, almost conflicting, technical profile. The overall trend is classified as neutral, with equal strength (50%) for both bulls and bears. However, the indicators here offer a different narrative than the shorter timeframes. The RSI(14) is at 55.03, sitting in neutral territory but showing a slight upward eğilim, which could imply some underlying buying interest. The MACD is negative, with the MACD line below its signal line, but the histogram shows positive momentum, creating a divergence that warrants attention. Bollinger Bands place the price above the middle band, suggesting a potential for upward movement. Stochastic, with K at 50.62 and D at 64, offers a bearish signal as %K is below %D, but it's hovering around the midpoint, indicating a lack of extreme overbought or oversold conditions. The ADX at 21.48 suggests a moderately strong trend, but its direction is classified as upward. This daily view suggests that while shorter-term bearish signals exist, the longer-term picture is less clear, with potential for a reversal or a continuation of a broader, less defined trend. The significant resistance at $159.339 and support at $157.7 remain the key anchors for this timeframe.地政学的な潮流:円のボラティリティを煽る要因
The recent geopolitical developments have injected a significant layer of uncertainty into currency markets, and USD/JPY is no exception. Reports indicate that geopolitical tensions in the Middle East have escalated, with specific mention of Tehran strikes impacting AUD/JPY. While not directly USD/JPY, this heightened risk sentiment often leads to a broader flight to safety, which can benefit the Japanese Yen as a traditional safe-haven asset. News from March 24th highlights that 'The Japanese Yen weakened against the US Dollar, trading near 158.55, following a cooler-than-expected inflation report.' This suggests that domestic factors, such as inflation data and potential shifts in Bank of Japan (BoJ) policy, are also playing a crucial role. A cooler inflation report could, in theory, reduce the immediate pressure on the BoJ to tighten policy, thereby weakening the Yen. However, this is counterbalanced by the fact that interest rate differentials remain wide, with the Fed likely to maintain a hawkish stance longer than the BoJ. The interplay between these global risk-off flows and domestic monetary policy expectations creates a volatile environment for USD/JPY, making the $158.50 resistance level even more significant as a potential pivot point.ドルの踏ん張り:DXYの影響とFRBの政策期待
The US Dollar Index (DXY), a key barometer of the dollar's strength against a basket of major currencies, is currently trading at 98.95, showing a slight upward bias. Historically, a strengthening DXY tends to put downward pressure on USD/JPY, as a stronger dollar makes it more expensive for holders of other currencies to buy dollar-denominated assets, including Japanese Yen. However, the current correlation can be complex. The daily chart for DXY indicates an uptrend with 91% strength, but the 1-hour and 4-hour charts show a bearish eğilim, with RSI readings below 50 and Stochastic signaling a potential downturn. This suggests that while the dollar might have underlying strength, its immediate upward momentum could be capped. The Federal Reserve's monetary policy remains a critical driver. Recent comments from San Francisco Fed President Mary Daly, as reported, indicated uncertainty about the next monetary policy move, citing geopolitical factors and inflation. This ambiguity means that market participants are keenly awaiting further signals, with Fed funds futures pricing in probabilities for rate cuts. If the Fed signals a more prolonged period of higher rates due to sticky inflation or geopolitical pressures, it could strengthen the dollar and support USD/JPY, even if it breaches the $158.50 resistance. Conversely, any hint of a dovish pivot could see the dollar weaken, pushing USD/JPY lower.相関分析:株式、原油、そして円
The correlation between USD/JPY and broader market sentiment is a crucial element for traders to monitor. The S&P 500 is trading at 6590.7, showing a slight daily gain, but its 4-hour and daily charts indicate a bearish trend. A risk-off environment, often signaled by falling equity markets, typically boosts demand for safe-haven assets like the Japanese Yen. This could create a counter-pressure on USD/JPY, even if the dollar itself is strong. Simultaneously, oil prices, particularly WTI at $90.09, have seen a significant surge, which is often interpreted as a sign of rising inflation expectations and geopolitical risk. While higher oil prices can sometimes boost commodity-linked currencies, for USD/JPY, the impact is more indirect. A sustained spike in oil prices could complicate the Fed's inflation fight, potentially leading to higher-for-longer interest rates, which would support the dollar. However, if the oil surge is driven purely by supply disruptions and geopolitical fears, it could also trigger a broader risk-off sentiment, benefiting the Yen. This complex web of correlations means that USD/JPY's movement is not solely dictated by interest rate differentials but also by a confluence of global risk appetite, inflation concerns, and geopolitical stability.重要な水準:なぜ158.50ドルが重要なのか
The $158.50 price point for USD/JPY is more than just a number; it represents a significant psychological and technical barrier. On the 1-hour chart, it acts as a resistance where selling pressure has historically emerged. A failure to decisively break and hold above this level could trigger a cascade of selling, pushing the pair back towards the support at $158.331. The ADX on the 1-hour chart, though suggesting a trend, is not overwhelmingly strong, implying that a breakout might not have immediate follow-through without additional catalysts. However, if the bulls manage to push USD/JPY decisively above $158.50, and importantly, above the 4-hour resistance of $158.765, it could signal the start of a new upward leg. This would likely require confirmation from a strengthening DXY or a shift in Fed expectations towards a more hawkish stance. The daily chart's neutral trend adds to the significance of this level; a clear break above $158.50 could shift the daily bias towards bullish, while a rejection could reinforce the prevailing caution. The market's reaction around this price point in the coming hours and days will be a key determinant of its short-to-medium term direction.強気のロードマップ:天井を破る
For USD/JPY to embark on a sustained bullish run, several conditions must be met, starting with a decisive breach of the $158.50 resistance. The immediate trigger for this scenario would be a strong close above $158.50 on the 1-hour chart, followed by a sustained push above the 4-hour resistance at $158.765. Confirmation would ideally come from a strengthening DXY or a shift in Fed expectations towards a more hawkish stance. In this bullish scenario, the first target would be the psychological level of $159.00, followed by the 4-hour resistance at $159.199. A more ambitious target, assuming strong momentum and favorable macro conditions, could be the daily resistance at $159.339. However, this path is fraught with challenges, given the current mixed signals on shorter timeframes and the looming geopolitical uncertainties that could quickly shift sentiment towards risk aversion, benefiting the Yen.弱気のシナリオ:下限を試す
The bearish scenario for USD/JPY hinges on the failure to break the $158.50 resistance and a subsequent move lower. The primary trigger for this outlook would be a decisive close below the 1-hour support at $158.331. This would be further confirmed by a bearish crossover on the 1-hour MACD and the RSI falling below 40. If this level breaks, the next key support to watch would be on the 4-hour chart at $158.082. A break below this level could accelerate the decline, targeting the 4-hour support at $157.897. On the daily chart, a bearish confirmation would involve the RSI dropping below 50 and the MACD histogram turning significantly negative. Geopolitical de-escalation or a surprisingly dovish signal from the Fed could also trigger this move by reducing safe-haven demand for the Yen and strengthening the dollar, but in a scenario where risk sentiment dominates, the Yen could strengthen irrespective of dollar moves. The ultimate downside target in a strong bearish move could be the daily support at $157.70, and potentially lower if broader market panic sets in.待機ゲーム:中間の膠着
A neutral or range-bound scenario for USD/JPY would likely play out if neither the bulls nor the bears can decisively break through key levels, and market sentiment remains mixed. This could occur if geopolitical news provides temporary relief without a clear resolution, or if economic data releases from both the US and Japan are largely in line with expectations, failing to shift monetary policy outlooks significantly. In this scenario, USD/JPY might consolidate between the current resistance around $158.50 and the immediate support at $158.331, or even within a slightly wider range defined by the 4-hour support at $158.082 and resistance at $158.765. The ADX readings across multiple timeframes, particularly the weaker trend signals on the 4-hour and daily charts (18.23 and 21.48 respectively), support the possibility of a period of consolidation. During such a phase, traders might look for shorter-term opportunities within the range, but a significant directional move would likely be postponed until a clearer catalyst emerges, such as a major economic announcement or a significant geopolitical development.確率評価:弱気寄りだが、注視が必要
Considering the technical indicators across different timeframes and the prevailing market conditions, the most probable scenario in the short to medium term appears to be a cautious bearish outlook, though with a significant degree of uncertainty. The 4-hour chart, with its strong bearish signals (RSI below 45, MACD bearish, ADX at 54.55), carries considerable weight, suggesting that upside momentum may be limited. The daily chart’s conflict, however, prevents a strong conviction. The immediate resistance at $158.50 is a formidable psychological barrier. Therefore, I assign a **60% probability to the bearish scenario**, where failure to break $158.50 leads to a test of lower support levels, potentially down to $158.082 in the near term. The **neutral scenario holds a 30% probability**, as consolidation between $158.331 and $158.765 is plausible if geopolitical news remains ambiguous and Fed expectations stabilize. The **bullish scenario, with a 10% probability**, requires a decisive breakout above $158.50, confirmed by daily technicals and potentially a shift in Fed policy expectations or a major de-escalation of geopolitical tensions.今週注目すべき点:ドル円の主要なトリガー
For USD/JPY traders, the coming week will be defined by a few critical triggers. Firstly, the price action around the $158.50 resistance level is paramount. A clear rejection here would strengthen the bearish case, while a sustained break above it, ideally confirmed by daily technicals, would shift the focus higher. Secondly, market participants will be closely watching any further commentary from Federal Reserve officials regarding monetary policy. Any hints about the timing of rate cuts or the persistence of inflation will significantly impact the dollar's strength and, consequently, USD/JPY. Finally, geopolitical developments, particularly any escalation or de-escalation in the Middle East, will continue to influence safe-haven flows. A significant geopolitical event that boosts risk aversion could strengthen the Yen, pushing USD/JPY lower regardless of dollar strength. Conversely, a period of calm could allow interest rate differentials to reassert their dominance, potentially supporting the pair if the Fed remains hawkish.弱気シナリオ:円の強さが戻る
60%の確率中立シナリオ:保合局面
30%の確率強気シナリオ:抵抗を粉砕
10%の確率| インジケーター | 値 | シグナル | 解釈 |
|---|---|---|---|
| RSI (14) | 43.71 | 弱気 | 下落傾向、さらなる弱体の可能性。 |
| MACD | -0.277 | 弱気 | マイナスモメンタム、シグナルラインを下回る。 |
| Stochastic | K=60.66, D=82.04 | 弱気 | %Kが%Dを下回る、弱気シグナル。 |
| ADX | 30.44 | 強いトレンド | 強いトレンドが進行中であることを示す。 |
| Bollinger Bands | ミドルバンド | 弱気 | 価格がミドルバンドを下回っており、下落圧力を示唆。 |
よくある質問:ドル円分析
ドル円が158.331ドルのサポートを下回った場合、どうなりますか?
1時間足で158.331ドルのサポートを下回るブレークは、短期的な強気の可能性を無効にし、さらなる売り圧力を引き起こす可能性が高いです。次の重要なターゲットは4時間足サポートの158.082ドルとなり、弱気のモメンタムが激化すれば157.700ドルへの動きもあり得ます。
トレーダーは、まちまちなシグナルを考慮して、現在の158.50ドル付近のレベルでドル円を買うべきでしょうか?
158.50ドルのレジスタンスと時間軸をまたぐ相反するシグナルを考慮すると、慎重さが推奨されます。強気の参入は、日足テクニカルが強気に転じることを伴う、158.50ドルを明確にブレークした後に、より賢明でしょう。現在、レジスタンスへの近さと弱気の反転の可能性から、ロングポジションのリスク・リワードは不利です。
1時間足チャートでRSIが43.71であることは、ドル円にとって強い売りシグナルですか?
1時間足チャートでのRSI 43.71は弱気の傾向を示しており、売りモメンタムが存在することを示唆しています。まだ売られすぎの領域ではありませんが、この時間軸で見られる弱気のセンチメントを強化し、特に重要なレジスタンスを試しているペアにとって、全体的な慎重な見通しに寄与しています。
今週、地政学的な緊張は158.50ドルのレジスタンス付近でのドル円の動きにどのように影響しますか?
地政学的な緊張の高まりは、通常、日本円のような安全資産への需要を高めます。これは、ドルが強い場合でもドル円を下押しする可能性があります。このリスクオフセンチメントは弱気シナリオを強化し、158.50ドルを上抜けることをより困難にし、下値サポートを試す展開につながる可能性があります。