The dollar yen analysis today reveals a market caught between conflicting forces. Escalating tensions in the Middle East are driving investors towards safe-haven assets, providing a bid to the US dollar. However, this is occurring amidst a backdrop of upcoming PMI data releases that could significantly impact the pair's direction. The key question is whether risk aversion will continue to dominate, or if economic data will take center stage.
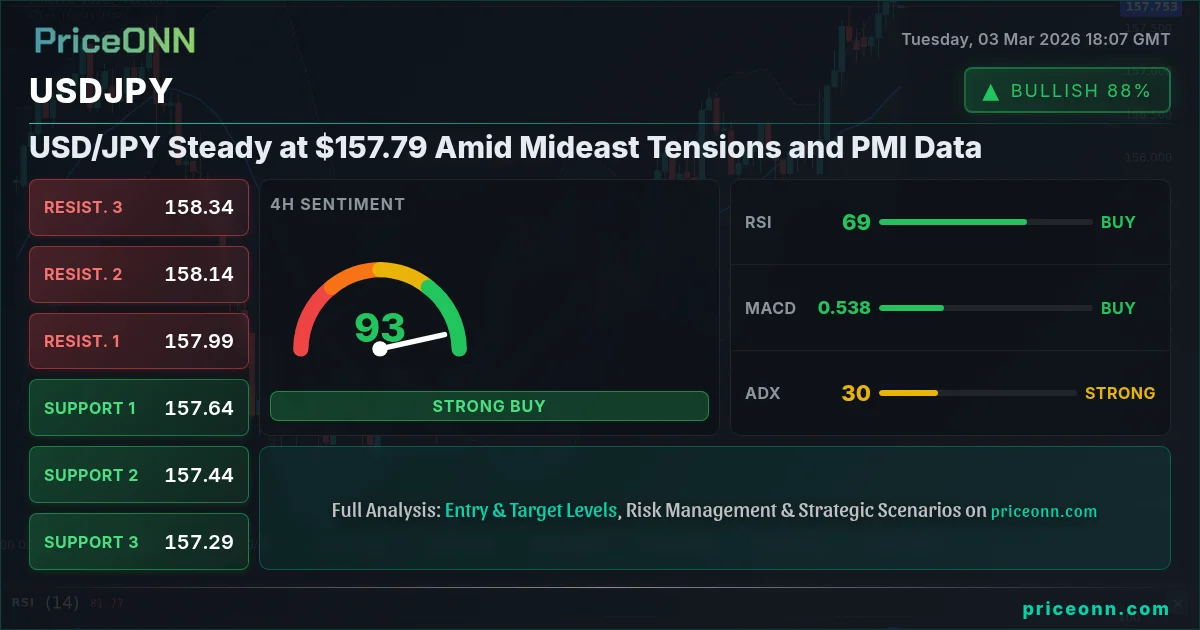
- USDJPY currently trades at $157.79, reflecting a balance between risk-off sentiment and economic data anticipation.
- Immediate resistance lies at 157.871, a break above which could trigger further gains.
- Key support sits at 157.559, tested multiple times in the last few hours.
- DXY's strength at 98.87 is putting downward pressure on other currencies, including the Yen.
The current market environment is characterized by a tug-of-war between geopolitical risks and economic fundamentals. According to Reuters, the surge in USD and Gold is a direct reaction to the escalating tensions in the Middle East, highlighting the dollar's safe-haven appeal. Concurrently, investors are keenly awaiting the release of U.S. Services Purchasing Managers Index (PMI) data on Wednesday, with a forecast of 52.3. This data point will provide crucial insights into the health of the U.S. economy and could significantly influence the Federal Reserve's monetary policy decisions. It is important to note that the overall signal for USDJPY is currently bullish, although there are some indications of a potential reversal with the Stochastic K currently at 69.49 and D at 71.8.
From a technical perspective, the 1-hour chart indicates a strong uptrend, with the ADX at 30.36 confirming the strength of the bullish momentum. However, the RSI at 60.37 suggests that the pair is approaching overbought territory, potentially signaling a period of consolidation or a minor pullback. Key levels to watch include the immediate resistance at 157.871, a break above which could open the door for a test of the 158.008 level, as per the 4-hour chart. On the downside, immediate support lies at 157.559, followed by 157.426. A break below these levels could trigger a deeper correction towards the 157.247 level. It is crucial to remember that the overall trend on the daily timeframe is neutral, suggesting that the current bullish momentum may be short-lived.
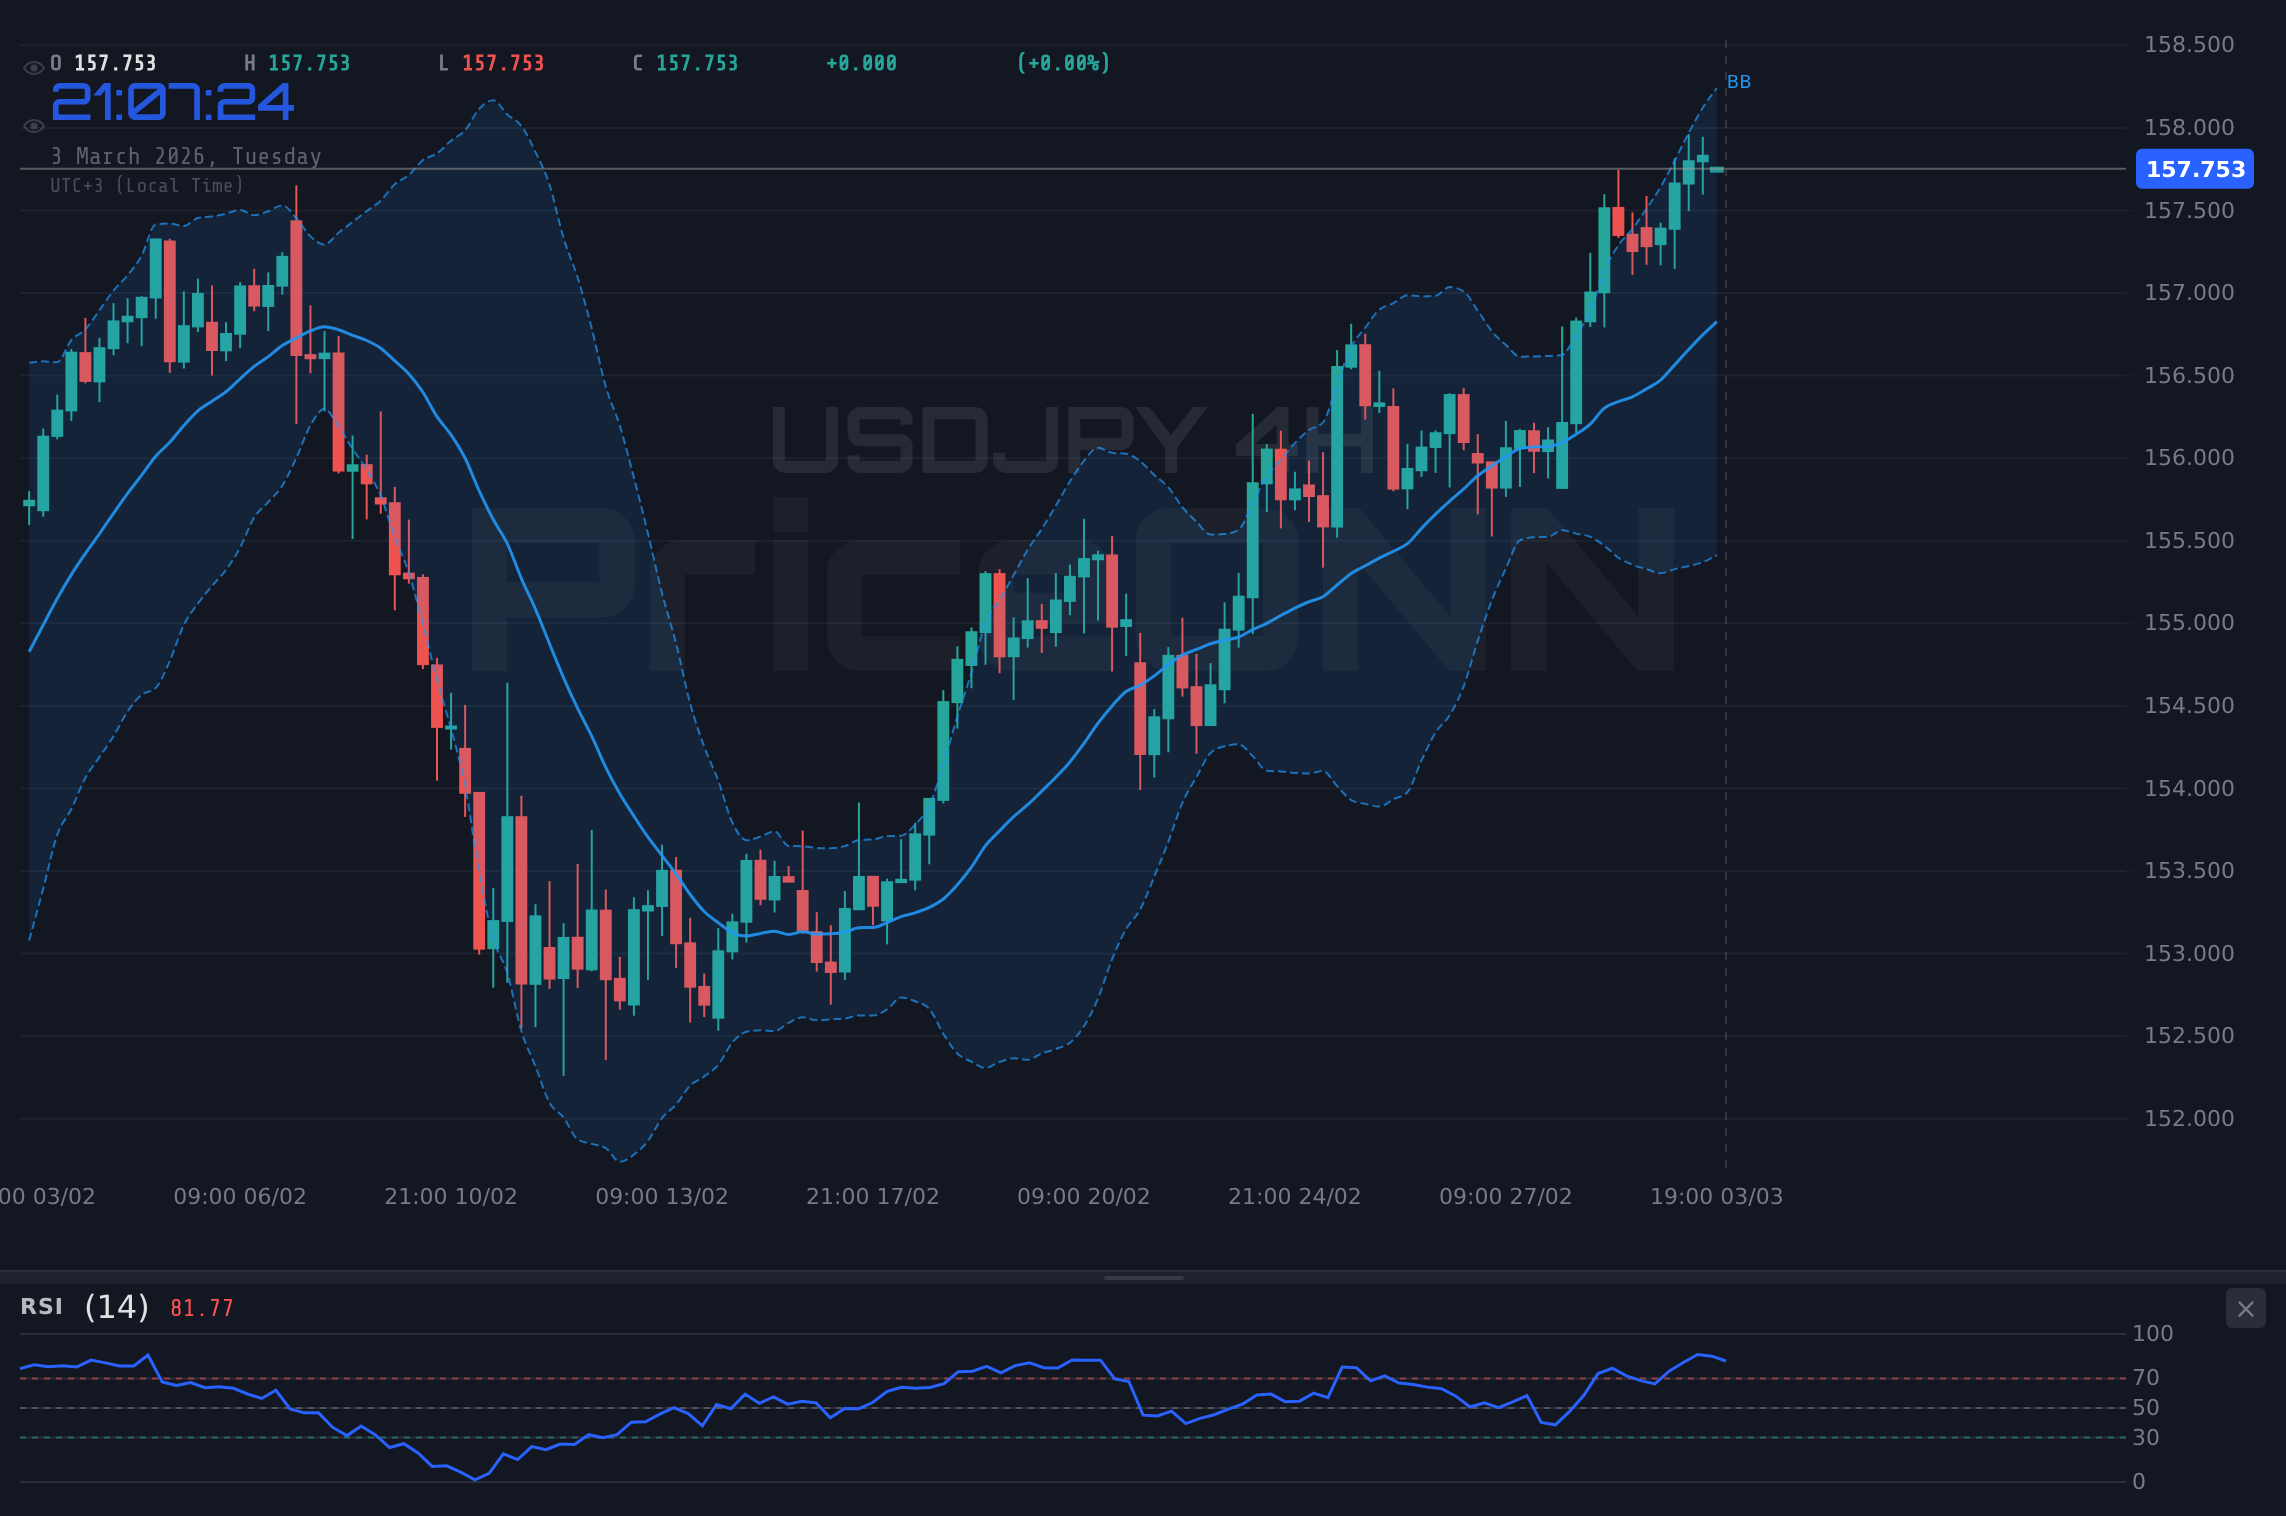
Zooming out to the 4-hour timeframe, the technical picture remains largely bullish. The ADX at 29.26 confirms the strength of the uptrend, while the MACD histogram indicates positive momentum. However, the RSI at 72.22 is approaching overbought territory, suggesting that the pair may be due for a correction. Key levels to watch include the immediate resistance at 158.008, a break above which could pave the way for a test of the 158.218 level. On the downside, immediate support lies at 157.542, followed by 157.286. A break below these levels could trigger a deeper pullback towards the 157.076 level. The 4-hour Stochastic K is at 89.39, and the Stochastic D is at 83.13, indicating an overbought condition, which means that the bulls may lose steam soon.
The daily chart provides a broader perspective on the USD/JPY's trajectory. The overall trend is neutral, with the ADX at a weak 17.67, suggesting a lack of strong directional momentum. The RSI at 63.14 is in neutral territory, indicating a balance between buying and selling pressure. However, the MACD histogram remains positive, suggesting that the underlying bullish momentum is still intact. Key levels to watch include the immediate resistance at 158.061, a break above which could lead to a test of the 158.869 level. On the downside, immediate support lies at 156.131, followed by 155.009. A break below these levels could trigger a more significant correction towards the 154.201 level.
For scalpers, the focus should be on the 1-hour chart, capitalizing on short-term momentum swings. Look for potential entry points near the support levels at 157.559 and 157.426, targeting quick profits near the resistance level at 157.871. However, be mindful of the overbought RSI and the potential for a sudden pullback. Swing traders should pay closer attention to the 4-hour chart, seeking to capture larger trend movements. A break above 158.008 could provide a solid entry point for a long position, targeting the 158.218 and 158.474 levels. However, a break below 157.542 could signal a potential trend reversal, presenting an opportunity for a short position. Long-term investors should focus on the daily chart, assessing the overall macroeconomic outlook and the potential for further dollar strength. Keep an eye on the key support and resistance levels at 156.131 and 158.061, respectively, for potential entry points.
The correlation analysis reveals the impact of the DXY and other indices on the USDJPY. With DXY currently at 98.87, the Yen is under pressure. A stronger dollar, driven by safe-haven demand, tends to weaken other currencies, including the Yen. The SP500 is currently down by 1.11% and the Nasdaq100 is down by 1.27%, confirming risk-off sentiment. This risk aversion further strengthens the dollar, adding downward pressure on the USDJPY. Crude Oil is currently up at 6.24% at $75.36, which usually indicates rising inflation expectations, but the safe haven demand is superseding these concerns at the moment.
Looking ahead, the economic calendar is packed with key data releases that could significantly impact the USD/JPY. Wednesday will see the release of the U.S. ADP Nonfarm Employment Change, Services Purchasing Managers Index (PMI), ISM Non-Manufacturing Prices, ISM Non-Manufacturing Purchasing Managers Index (PMI), and Crude Oil Inventories. Thursday will bring the U.S. Initial Jobless Claims data, followed by U.S. Retail Sales MoM and Core Retail Sales MoM on Friday. These data points will provide crucial insights into the health of the U.S. economy and could influence the Federal Reserve's monetary policy decisions. Strong economic data could further strengthen the dollar, putting additional downward pressure on the USD/JPY. Conversely, weak economic data could trigger a dollar pullback, providing a boost to the Yen.
According to Bloomberg, European Central Bank officials are weighing the potential economic fallout from the Middle East conflict, adding to the uncertainty surrounding the EUR/USD pair. This uncertainty could indirectly impact the USD/JPY, as traders may seek refuge in the dollar amid heightened global risks. It is essential to monitor these developments closely, as they could significantly influence the pair's trajectory. The escalating tensions in the Middle East, coupled with the upcoming economic data releases, create a complex and dynamic trading environment for the USD/JPY.
The dollar yen analysis today indicates that the pair is at a critical juncture, caught between conflicting forces. Escalating geopolitical risks are driving safe-haven demand for the dollar, while upcoming economic data releases could significantly impact the pair's direction. Traders should closely monitor the key support and resistance levels, as well as the economic calendar, to make informed trading decisions. The technical indicators provide valuable insights into the pair's momentum and potential for a reversal. Patience looks like it will be rewarded here. Manage your risk, wait for your setup-the market always gives a second chance.
Frequently Asked Questions: USDJPY Analysis
Is USDJPY a good buy right now?
Given the current market conditions, USDJPY is not a straightforward buy. The pair is trading at $157.79, and while the 1H trend is up, caution is advised due to the RSI approaching overbought conditions. A daily close above 158.061 would signal a more confident buy.
What is the USDJPY price forecast for this week?
The USDJPY price forecast for this week is mixed. In the bullish scenario, a break above 158.061 could lead to a test of 158.869. In the bearish scenario, a break below 156.131 could trigger a deeper correction towards 154.201. Probability assessment is 55% bullish, 45% bearish.
What are the key support and resistance levels for USDJPY?
Key support levels for USDJPY are 157.559 (1H), 157.542 (4H), and 156.131 (1D). Key resistance levels are 157.871 (1H), 158.008 (4H), and 158.061 (1D). These levels should be closely watched for potential breakouts or reversals.
Why is USDJPY moving today?
USDJPY is moving today due to a combination of factors. Escalating tensions in the Middle East are driving safe-haven demand for the dollar, while traders are also anticipating upcoming U.S. economic data releases, particularly PMI, which could influence the Fed's monetary policy decisions.
A daily close above 158.061 would open the door for a test of higher resistance levels. However, failure to breach this level could signal a potential trend reversal, leading to a deeper correction towards the support levels. Volatility creates opportunity-those prepared will be rewarded.
Technical Outlook Summary
| Indicator | Value | Signal |
|---|---|---|
| RSI (14) | 56.03 | Neutral |
| MACD Histogram | Positive | Bullish |
| Stochastic | 72.34/43.91 | Bullish |
| ADX | 17.84 | Weak |
| Bollinger | Middle Band | Watch |
Key Levels
Support Levels
Resistance Levels
Track markets in real-time
AI-powered analysis, technical indicators and real-time price data.
Join Our Telegram Channel
Breaking market news, AI analysis and trading signals instantly.
Join Channel