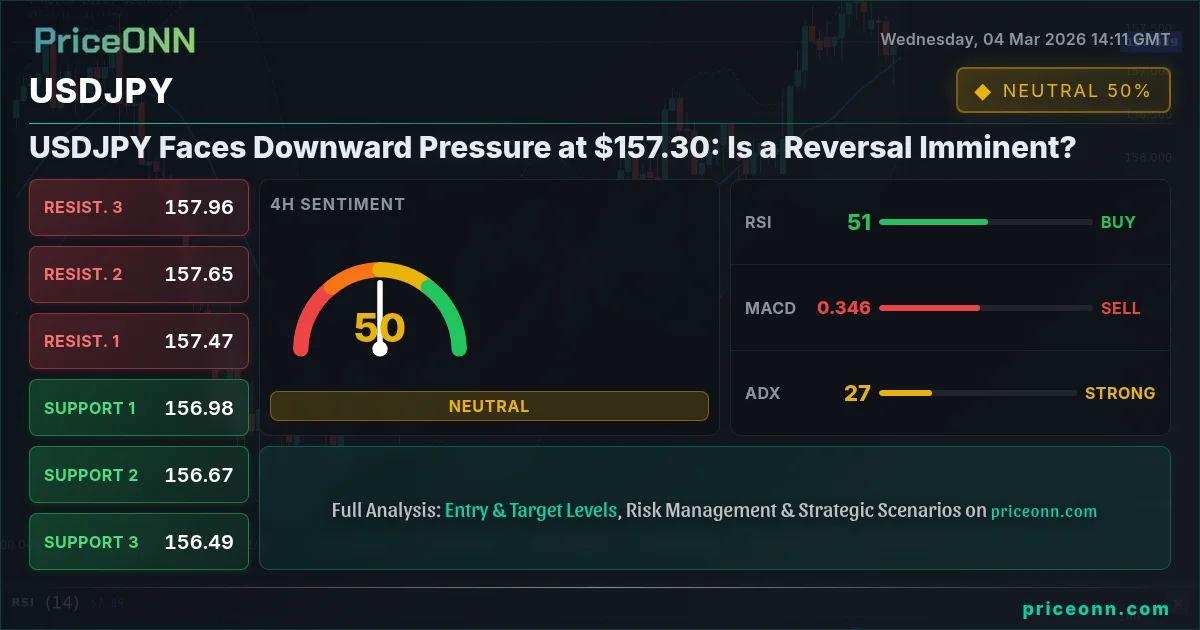
USDJPY today analysis reveals a market at a critical juncture, trading at $157.30. Bulls and bears are locked in a tense battle, influenced by recent PMI data and escalating geopolitical jitters. The direction USDJPY takes from here will likely dictate the short-term trading landscape.
- RSI at 45.25 on the 1H chart signals potential for further downside.
- Key support level at 157.115 could be tested if bearish pressure continues.
- Stochastic on the 1H chart shows a potential buy signal with K=53.34 and D=41.04, but overall trend remains neutral.
- DXY at 98.56 is exhibiting weakness, potentially supporting USDJPY in the short term.
The Bull Case for USDJPY
Despite the recent downward pressure, there's a compelling bull case for USDJPY. The pair is currently trading at $157.30, and while the daily change is negative at -0.25%, several factors suggest potential for a rebound. The SP500 is showing a positive daily change of 0.54%, indicating a risk-on sentiment that could support USDJPY. Furthermore, the 4H chart shows an RSI of 58.27, suggesting that the pair is not yet oversold and has room to move higher. The first resistance level to watch is 157.415 on the 1H chart.
One of the strongest arguments for the bullish scenario is the overall trend on the 1D timeframe. While the trend is currently neutral, the RSI is at 59.88, and the MACD shows positive momentum, signaling potential for a trend reversal. Moreover, the Stochastic indicator on the 1D chart is in the overbought region with K=88.73 and D=86.13, indicating that the pair may be due for a correction, which could present a buying opportunity. The key will be monitoring the DXY; a continued decline could provide the necessary tailwind for USDJPY to push higher.
The Bear Case for USDJPY
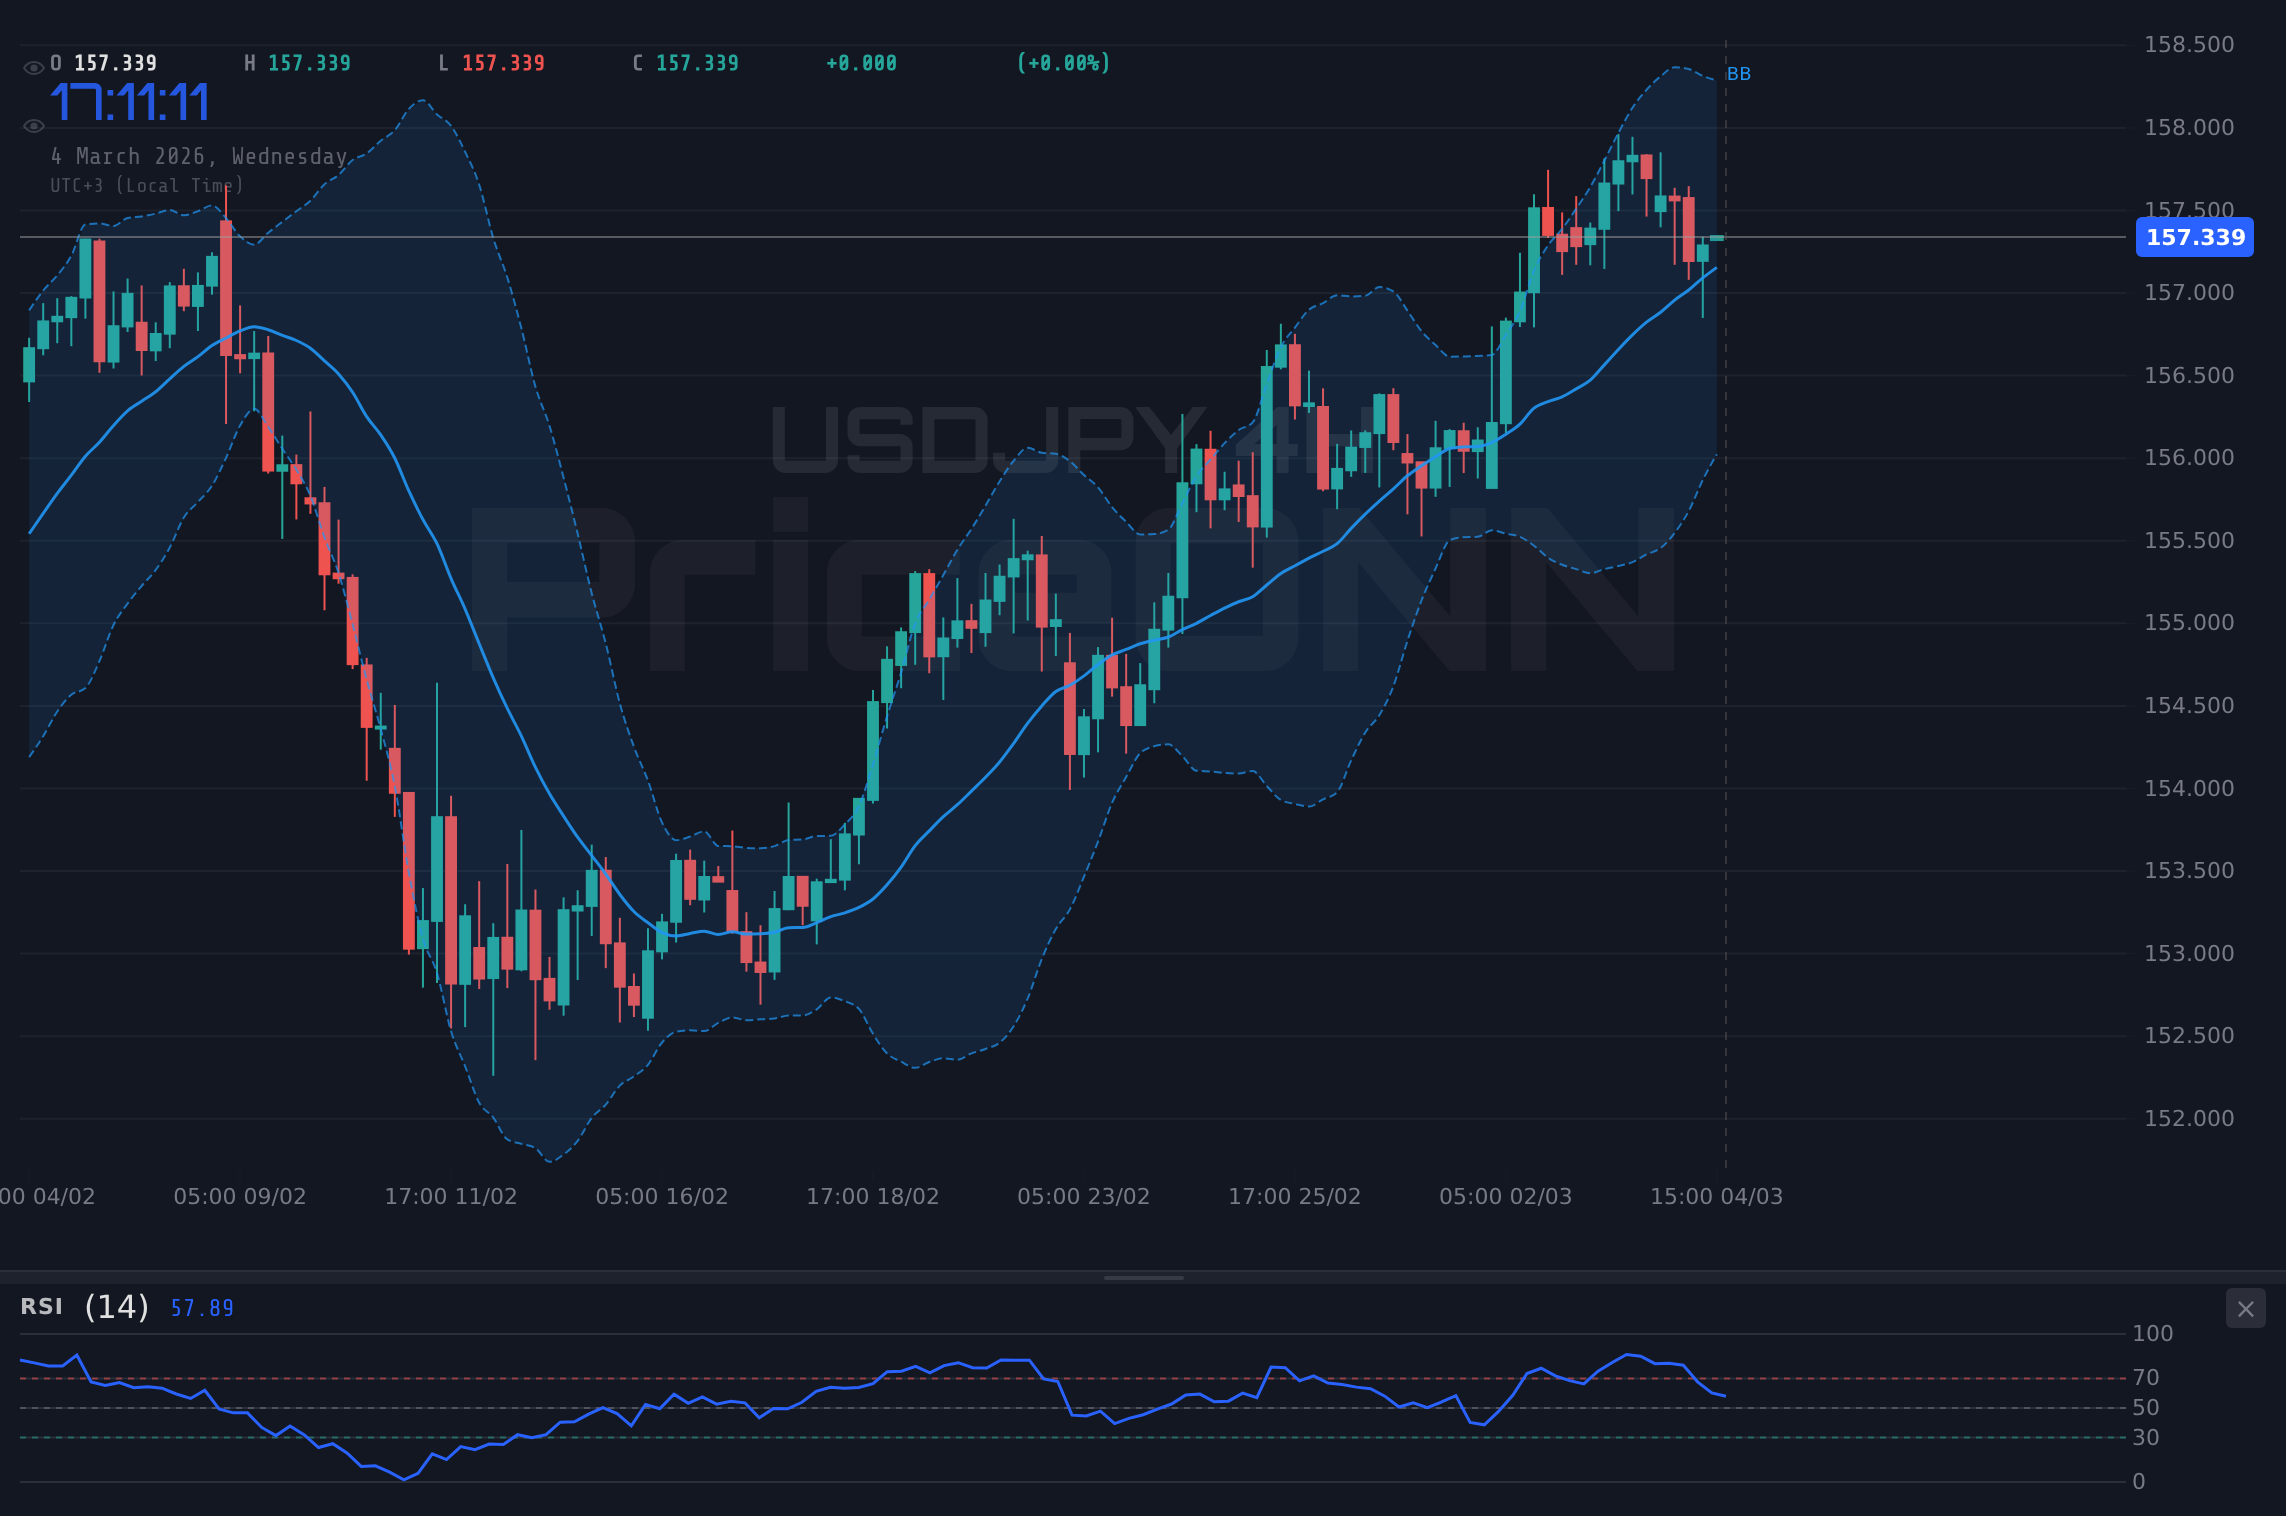
Conversely, the bear case for USDJPY is equally compelling. Escalating geopolitical tensions in the Middle East, as reported by Reuters, are fueling risk-off sentiment, driving investors toward safe-haven currencies like the US dollar. This is reflected in the DXY, which, despite a slight daily decline, remains elevated. The 1H chart for USDJPY paints a bearish picture, with the RSI at 45.25 and the MACD showing negative momentum. The pair is also trading below the middle band of the Bollinger Bands, further reinforcing the bearish outlook.
Adding to the bearish argument is the strong bearish trend observed on the 4H chart for the DXY. With an ADX of 42.71, the dollar index exhibits a robust uptrend, which typically puts pressure on USDJPY. The key support level to watch is 157.115 on the 1H chart. A break below this level could trigger further downside, with the next support level at 156.924. The economic calendar also presents potential headwinds, with upcoming USD data releases that could strengthen the dollar if they come in above expectations.
Technicals as Tiebreaker: Multi-Timeframe Analysis
To break the tie between the bull and bear cases, let's delve deeper into a multi-timeframe technical analysis. On the 1H chart, the ADX is at 20.36, indicating a moderate downtrend. However, the Stochastic indicator is signaling a potential bullish reversal with K=53.34 and D=41.04. This suggests that the bearish momentum may be waning, and a short-term bounce is possible. The key level to watch is the resistance at 157.415. A break above this level could confirm the bullish reversal.
Moving to the 4H chart, the ADX is at 28.03, indicating a strengthening uptrend. However, the Stochastic indicator is signaling a potential bearish reversal with K=35.52 and D=64.73. This suggests that the bullish momentum may be overextended, and a pullback is likely. The key support level to watch is 156.967. A break below this level could trigger further downside. The daily chart offers a more balanced perspective. While the ADX is relatively weak at 17.86, the RSI is at 59.88, and the MACD shows positive momentum. This suggests that the overall trend is still bullish, but the pair may be due for a period of consolidation.
The recent USD data released on March 2nd, showing a Previous of 52.4, also plays a role. The market will be closely watching the USD data releases scheduled for today, March 4th, to gauge the strength of the US economy. Any positive surprises could bolster the dollar and weigh on USDJPY.
Trade Recommendation: FULL_TRADE_PLAN
Considering the conflicting signals and the current market dynamics, a cautious approach is warranted. However, the potential for a bullish reversal on the 1H chart, coupled with the overall bullish trend on the daily chart, presents a compelling trading opportunity. The ADX of 28.03 on the 4H suggests a strong trend.
If USDJPY breaks above 157.415, it could target 157.524 and potentially 157.715. This scenario is supported by the Stochastic indicator on the 1H chart, which is signaling a potential bullish reversal.
If USDJPY breaks below 157.115, it could target 156.924 and potentially 156.815. This scenario is supported by the bearish trend on the 1H chart and escalating geopolitical tensions.
USDJPY Trade Plan
Time Horizon: This analysis is for swing trading.
Upcoming USD data releases on March 4th could significantly impact USDJPY. Exercise caution and manage your risk accordingly.
Frequently Asked Questions: USDJPY Analysis
Is USDJPY a good buy right now?
USDJPY is at $157.30. A buy is potentially favorable if it breaks above 157.415, targeting higher resistance levels. However, caution is advised due to geopolitical tensions and economic data releases.
What is the USDJPY price forecast for this week?
The USDJPY price forecast for this week is mixed. A bullish scenario targets 157.524 and 157.715 with 60% probability, contingent on breaking above 157.415. A bearish scenario targets 156.924 and 156.815 with 40% probability, if it closes below 157.115.
What are the key support and resistance levels for USDJPY?
Key support levels for USDJPY are 157.115, 156.924, and 156.815. Key resistance levels are 157.415, 157.524, and 157.715, as indicated by the 1H timeframe analysis.
Why is USDJPY moving today?
USDJPY is moving today due to a combination of factors, including geopolitical tensions in the Middle East, fluctuating risk sentiment, and anticipation of upcoming USD economic data releases.
Track markets in real-time
AI-powered analysis, technical indicators and real-time price data.
Join Our Telegram Channel
Breaking market news, AI analysis and trading signals instantly.
Join Channel