Why is dollar yen moving today? The USDJPY pair is currently trading near $157.16, exhibiting a neutral trend as markets await key economic data releases. With the Dollar Index (DXY) showing signs of strength and risk appetite fluctuating, the USDJPY's next move hinges on upcoming PMI data. This analysis delves into the technical indicators, key price levels, and potential trading scenarios for the pair.
- USDJPY currently trades near $157.16, directionless as traders await PMI data
- Key support lies at 157.173, a break below which could trigger further downside
- Stochastic oscillator signals overbought conditions on the 1H chart, suggesting a potential pullback
- DXY strength and fluctuating risk appetite influence USDJPY correlation dynamics
Technical Overview: A Multi-Timeframe Analysis
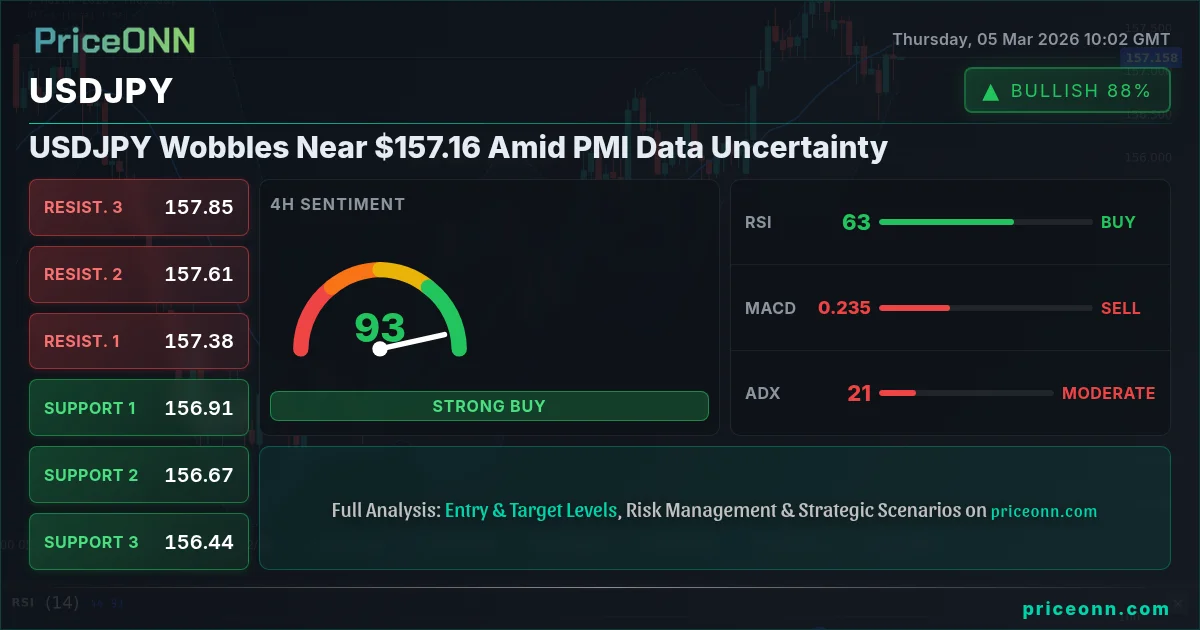
A multi-timeframe analysis reveals a mixed picture for USDJPY. On the 1-hour chart, the trend is neutral, with the RSI at 50.28. The MACD indicates positive momentum, but the Stochastic oscillator signals overbought conditions with K=87.48 and D=86.95. The ADX, at 20.8, suggests a weak trend, indicating potential for sideways movement. This indicator dashboard paints a picture of short-term indecision. The key question is: will the market consolidate, or are we setting up for a volatility expansion?
Zooming out to the 4-hour timeframe, the trend remains neutral. The RSI is at 54.04, and the MACD shows negative momentum. Here, the Stochastic oscillator presents a buy signal, with K=41.06 above D=27.46. ADX reads 21.74, implying a moderate uptrend. This is where the multi-timeframe narrative starts to get interesting. The 1H chart is potentially overbought, while the 4H chart is signaling a buy. This contradiction needs to be resolved. The 4H timeframe is critical for swing traders, offering a broader perspective that smooths out short-term noise.
Looking at the daily chart, the trend is also neutral. The RSI is at 58.67, and the MACD shows positive momentum. Like the 1H chart, the Stochastic oscillator is in overbought territory, with K=83.16 and D=85.86. The ADX is at 17.59, pointing to a weak trend. The daily chart presents a long-term perspective, highlighting the pair's overall lack of clear direction. As a portfolio manager, I look for trends that are confirmed across multiple timeframes. Here, that’s not the case. The daily chart is showing positive momentum and a neutral trend, but the Stochastic oscillator is flashing a sell signal. This means that traders should maintain a neutral position until the market provides clearer direction.
Key Levels and Price Action: Spotting the Breakout Zone
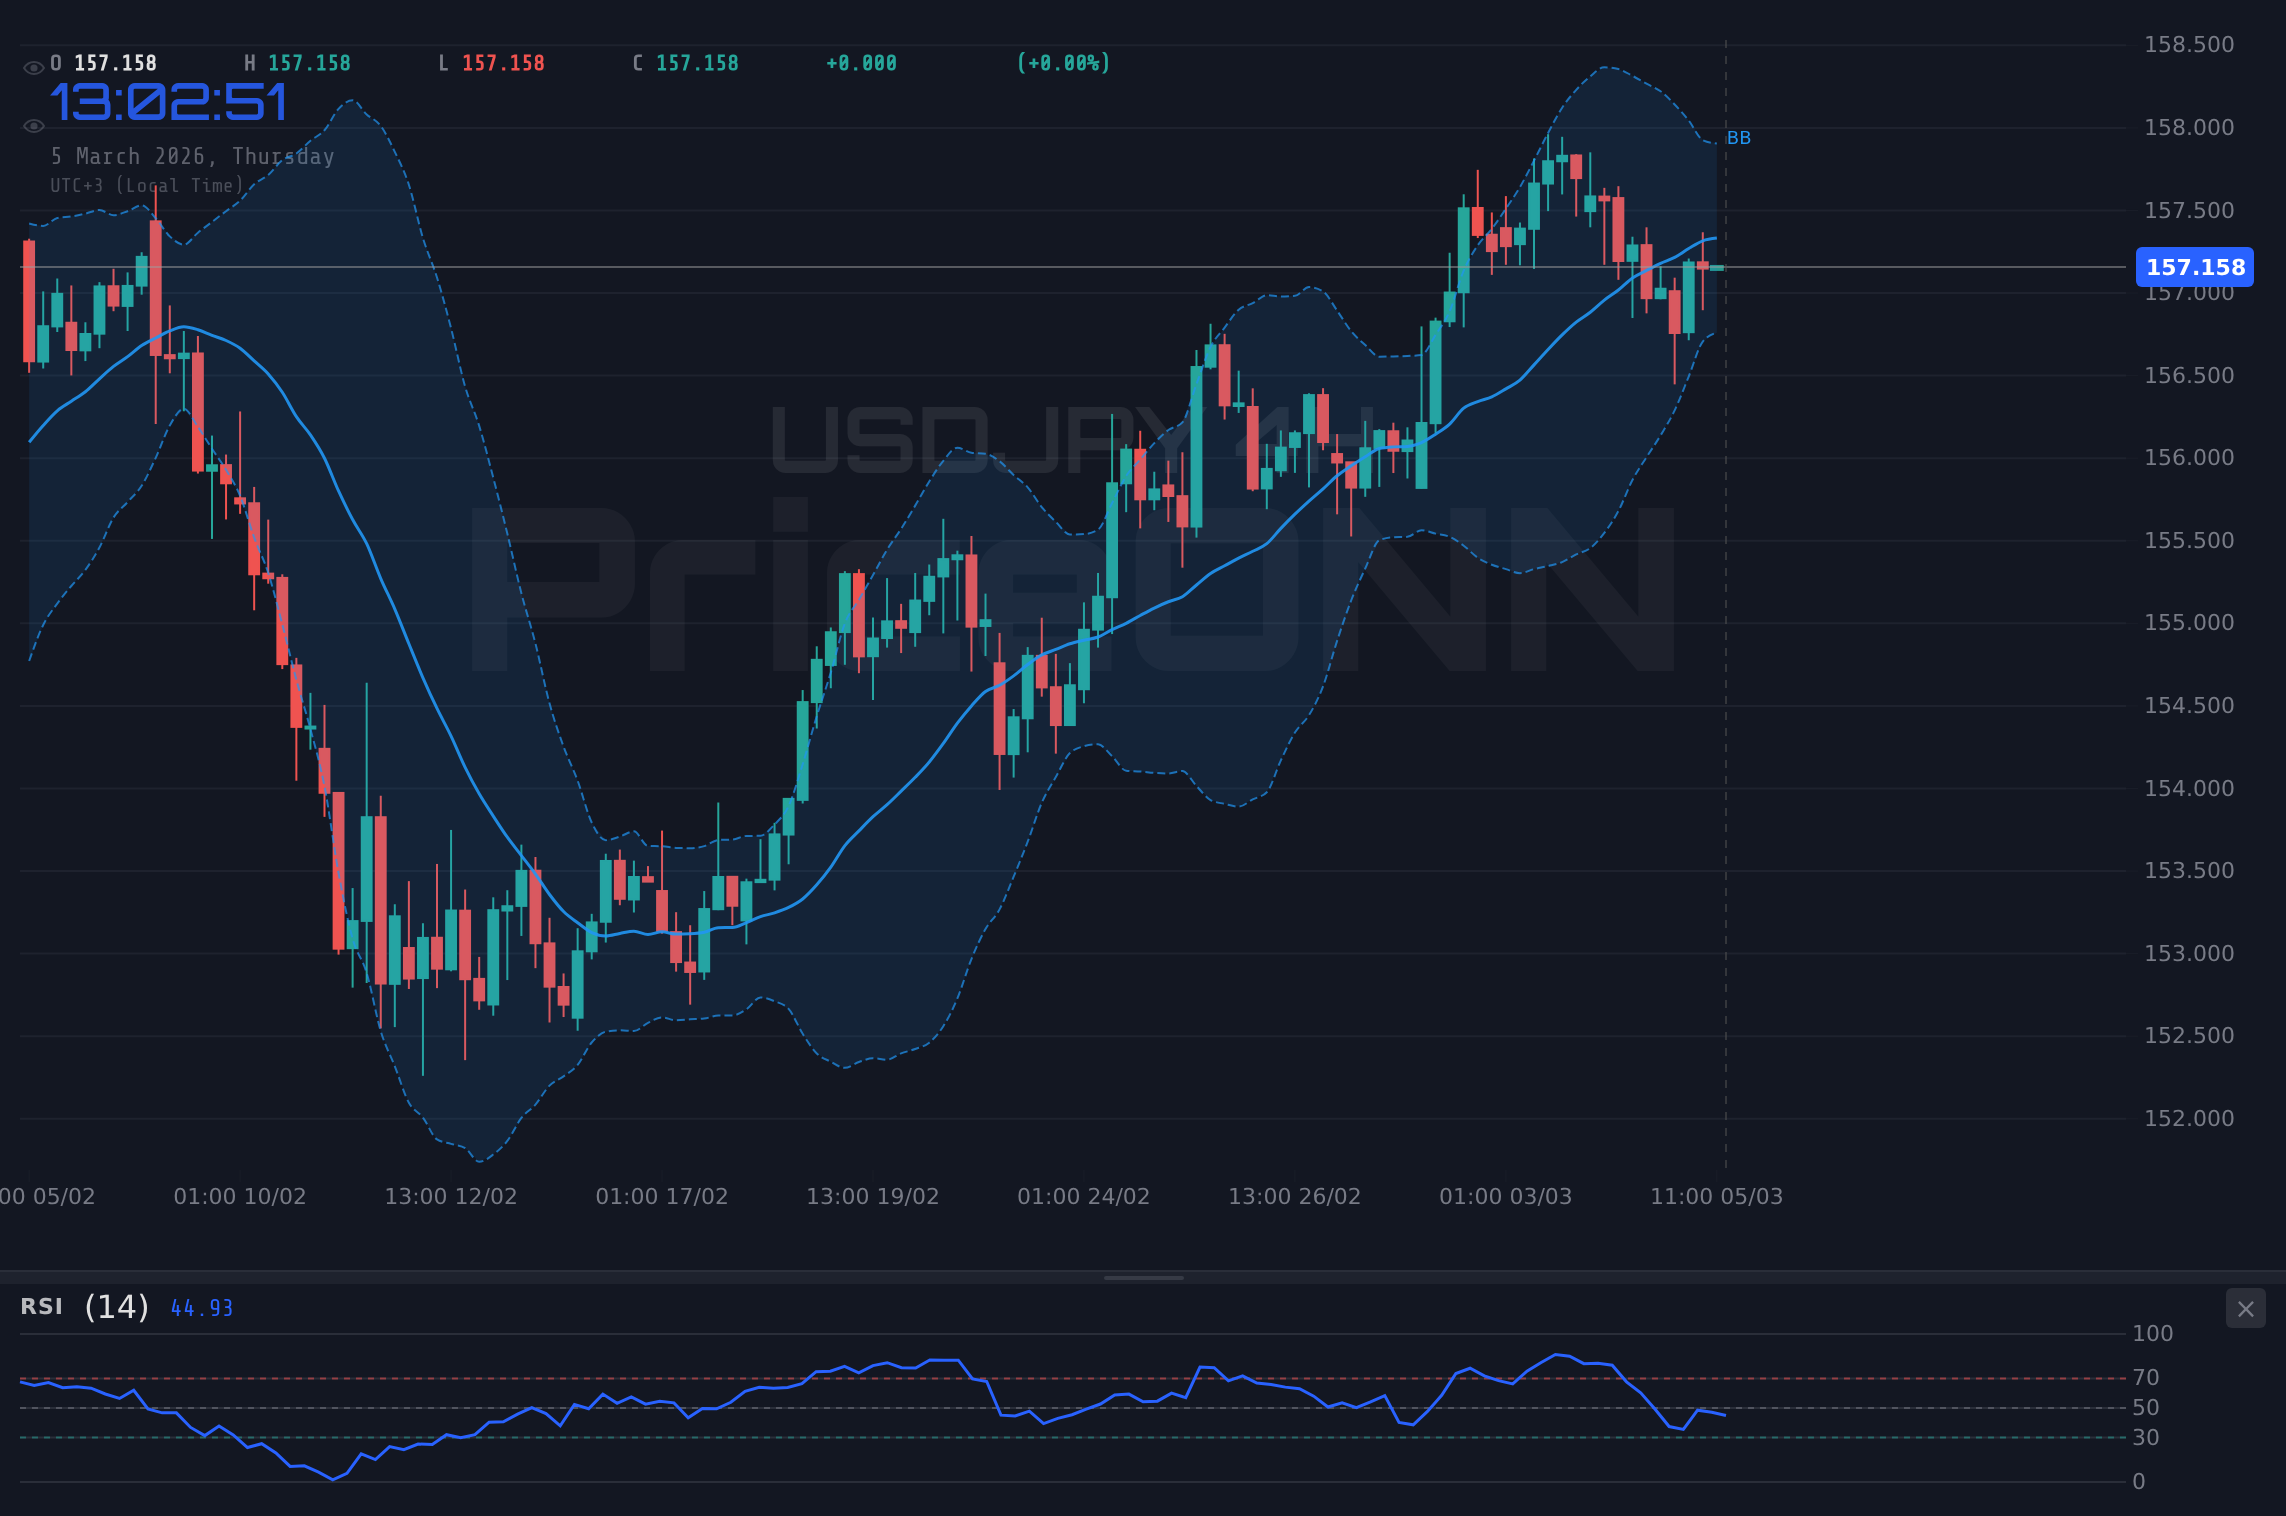
Key levels for USDJPY are crucial for identifying potential breakout zones. Immediate resistance lies at 157.372, followed by 157.469 and 157.571. On the downside, support is found at 157.173, 157.071, and 156.974. These levels are critical for both day traders and swing traders. A break above 157.372 could signal a bullish move, while a break below 157.173 could trigger a bearish decline. These are the lines in the sand for today. As a trader, this is exactly where you need to pay attention. I like to set alerts just above and below these key levels to stay informed of potential breakouts.
Price action around these levels will be telling. A sustained break above resistance, accompanied by increasing volume, would confirm bullish momentum. Conversely, a failure to hold support, with increasing selling pressure, would confirm bearish intent. Watch the order book around these levels for clues about institutional positioning. Are buyers stepping in to defend support, or are sellers overwhelming the bids? The answers to these questions will provide valuable insights into the pair's next move.
Having tracked USDJPY through multiple cycles, I’ve seen how these levels can act as magnets for price. Traders often place orders around these levels, creating a self-fulfilling prophecy. That’s why understanding the psychology behind these levels is crucial for successful trading. The market often tests these levels multiple times before committing to a direction. Patience looks like it will be rewarded here. Manage your risk, wait for your setup - the market always gives a second chance.
Fundamental Factors: Economic Data and Geopolitical Risks
The USDJPY pair is influenced by a combination of economic data and geopolitical risks. On the economic front, traders are keenly awaiting upcoming PMI data releases. These data points provide insights into the health of the manufacturing and services sectors, which can significantly impact currency valuations. According to Reuters, a strong PMI reading could boost the dollar, while a weak reading could weigh on it. This is exactly why dollar yen moving today is so closely tied to these data releases.
Geopolitical risks also play a role. Renewed trade tensions between the US and Japan, as highlighted by recent news of US-Japan nuclear deal talks emerging amid trade war fears, could create uncertainty and impact the pair. Additionally, developments in the Middle East, as iron ore prices and China's growth target influence the Australian Dollar, can affect risk sentiment and safe-haven flows, influencing the yen. These factors are continuously monitored by traders and investors to gauge potential market movements. According to Bloomberg, safe-haven assets like the yen tend to strengthen during periods of heightened geopolitical uncertainty.
The strength of the DXY is also a key factor. With DXY at 98.62, USDJPY is under pressure. A stronger dollar generally puts downward pressure on the pair, while a weaker dollar tends to support it. The correlation between the DXY and USDJPY is not always perfect, but it provides a valuable indication of potential direction. The Federal Reserve’s monetary policy also plays a crucial role. Any hints about future interest rate hikes or pauses can significantly impact the dollar's value and, consequently, the USDJPY pair. Until the NFP data resolves this, caution is warranted.
Trading Stance: Watch Zone - Patience is Key
Given the mixed technical signals and the upcoming PMI data releases, the recommended trading stance for USDJPY is to remain in a watch zone. I would wait for a clear breakout above resistance at 157.372 or a breakdown below support at 157.173 before entering a trade. A daily close above 157.372 would open the door for a bullish move towards 157.469 and potentially higher. Conversely, a daily close below 157.173 could pave the way for a bearish decline towards 157.071 and lower. Until then, patience is key.
For scalpers, the immediate levels to watch are the intraday support and resistance levels. A break above 157.372, coupled with increasing volume, could present a short-term buying opportunity. Similarly, a break below 157.173 could offer a short-term selling opportunity. However, scalpers should be mindful of the overall neutral trend and manage their risk accordingly. Swing traders should focus on the 4-hour chart and wait for a clear signal before entering a trade. A sustained break above resistance or below support on the 4-hour chart would provide a higher-probability setup. Long-term investors should monitor the daily chart and consider accumulating USDJPY on pullbacks, provided the overall fundamental outlook remains supportive.
The ADX at 17.59 on the daily chart is the real story here. A weak-trend reading like this means the breakout hasn't committed yet - it could go either way. The bulls need to show more conviction. Having tracked USDJPY through the 2024 rate cycle, I’ve learned that patience is often rewarded. Waiting for the market to confirm its direction is crucial before committing capital. That’s why I recommend remaining in the watch zone until a clearer signal emerges.
USDJPY Price Forecast and Outlook: What Happens Next?
Looking ahead, the short-term price forecast for USDJPY hinges on the upcoming PMI data releases. A strong PMI reading could push the pair towards resistance at 157.372 and potentially higher, while a weak reading could lead to a decline towards support at 157.173 and lower. The medium-term outlook depends on the overall trend and the strength of the dollar. If the dollar continues to strengthen, USDJPY could face downward pressure. However, if risk appetite improves, the pair could find support. A high-probability setup (65-70%) occurs when the market provides confirmation.
A bullish scenario would involve a break above resistance at 157.372, followed by a sustained move towards 157.469 and potentially 157.571. This scenario would be supported by strong PMI data and a positive risk environment. A bearish scenario would involve a break below support at 157.173, followed by a decline towards 157.071 and potentially 156.974. This scenario would be driven by weak PMI data and a risk-off environment. As a portfolio manager, I always consider both bullish and bearish scenarios before making a trading decision.
The correlation between USDJPY and the DXY will continue to be a key factor. A stronger dollar, driven by expectations of further interest rate hikes, could weigh on the pair. Conversely, a weaker dollar, driven by concerns about economic growth, could provide support. Traders should monitor the DXY closely to gauge the potential direction of USDJPY. I recommend remaining flexible and adjusting your trading strategy based on market conditions. Volatility creates opportunity - those prepared will be rewarded.
Frequently Asked Questions: USDJPY Analysis
Is USDJPY a good buy right now?
Currently trading around $157.16, USDJPY's neutral trend and mixed signals suggest caution. Waiting for a break above 157.372 or below 157.173 is advisable before considering a buy, as the market needs to confirm its direction.
What is the USDJPY price forecast for this week?
The short-term forecast depends on upcoming PMI data; strong data could push USDJPY towards 157.469, while weak data could lead to 157.071. Monitor DXY for directional clues.
What are the key support and resistance levels for USDJPY?
Key support is at 157.173, and key resistance is at 157.372. A break of either level could trigger a directional move. Further supports are at 157.071 and resistances are at 157.469.
Why is USDJPY moving today?
USDJPY's movement today is primarily influenced by anticipation of PMI data releases, DXY fluctuations, and shifts in risk sentiment. Renewed trade tensions are also a factor.
Technical Outlook Summary
| Indicator | Value | Signal |
|---|---|---|
| RSI (14) | 50.28 | Neutral |
| MACD Histogram | Positive | Bullish |
| Stochastic | 87.48/86.95 | Overbought |
| ADX | 20.8 | Weak Trend |
| Bollinger | Upper Band | Watch |
Key Levels
Support Levels
Resistance Levels
Track markets in real-time
AI-powered analysis, technical indicators and real-time price data.
Join Our Telegram Channel
Breaking market news, AI analysis and trading signals instantly.
Join Channel