Weekly Market Outlook - Week 13 (March 23, 2026 – March 27, 2026): Dollar Strength, Energy Rally, Risk-Off Sentiment
Week 13 (March 23, 2026 – March 27, 2026): This week's market outlook highlights anticipated US Dollar strength, a persistent energy rally, and prevailing risk-off sentiment across equities and cryptocurrencies.
Weekly Market Outlook: March 23, 2026 – March 27, 2026 (Week 13)
This week, market participants will be closely monitoring a confluence of economic data releases and ongoing geopolitical developments that could shape directional moves across major asset classes. The US Dollar is poised to remain a focal point, with key employment and inflation figures on the horizon. Energy markets, particularly crude oil, are displaying robust upward momentum, while risk assets such as equities and cryptocurrencies are exhibiting signs of strain. Traders will be navigating these diverging trends, seeking clarity from upcoming macroeconomic indicators.
Executive Summary
- US Dollar Strength Anticipated: With a generally positive technical setup across multiple timeframes and upcoming data that could support further hawkish sentiment from the Federal Reserve, the DXY may continue its upward trajectory, potentially testing higher resistance levels.
- Energy Rally to Persist: Brent and WTI crude oil futures show strong bullish signals, with RSI readings well into overbought territory on daily and weekly charts. Geopolitical tensions and supply-side narratives are likely to support this trend, barring significant shifts in global demand outlooks.
- Risk Assets Under Pressure: Major stock indices (S&P 500, Nasdaq, Dow Jones) and cryptocurrencies (BTC, ETH) are displaying predominantly bearish technical indicators, including oversold RSI and negative MACD momentum on shorter timeframes. A cautious risk appetite is expected to prevail unless key support levels hold firm.
- Key Economic Data to Watch: The week is headlined by US inflation data (CPI) and employment figures (Non-Farm Payrolls), which will be critical in shaping expectations for Fed policy and influencing currency valuations.
US Dollar & DXY Outlook
The US Dollar Index (DXY) enters the week with a predominantly positive technical posture. On the daily chart, the RSI stands at 57.2, indicating a bullish momentum that is not yet overextended. The MACD histogram is printing positive at +0.05, suggesting upward momentum is present. Shorter timeframes also show mixed but leaning positive signals, with the 1-hour RSI at 51.0 and the 4-hour RSI at 48.3. Key resistance is seen at the Pivot of 99.180, with further levels at R1 99.720 and R2 100.54. Support is located at S1 98.360.
| Resistance | Price |
|---|---|
| R3 | 101.08 |
| R2 | 100.54 |
| R1 | 99.720 |
| Pivot | 99.180 |
| Support | Price |
|---|---|
| S1 | 98.360 |
| S2 | 97.820 |
| S3 | 97.000 |
| Fib 61.8% | 97.090 |
If upcoming economic data, particularly inflation and employment figures, suggest a continued need for a restrictive monetary policy from the Federal Reserve, the DXY could find further strength. A break above the R1 level of 99.720 would likely pave the way for a test of the 100.54 resistance.
Forex Majors Outlook
EUR/USD
EUR/USD presents a mixed technical picture. The daily RSI is at 44.3, indicating a slight bearish bias but not deep oversold conditions. The MACD histogram is flat at 0.00. However, the 1-hour RSI is at 53.7 and the 4-hour RSI is at 56.4, suggesting some short-term buying interest. The weekly sentiment is 'SELL'. Key resistance will be at the Pivot of 1.15462, with R1 at 1.16499. Support lies at S1 1.14768 and S2 1.13731.
| Resistance | Price |
|---|---|
| R3 | 1.18230 |
| R2 | 1.17193 |
| R1 | 1.16499 |
| Pivot | 1.15462 |
| Support | Price |
|---|---|
| S1 | 1.14768 |
| S2 | 1.13731 |
| S3 | 1.13037 |
| Fib 38.2% | 1.17000 |
Should US data surprise to the upside, reinforcing dollar strength, EUR/USD could face downward pressure. A break below S1 1.14768 would open the door for further declines towards S2 1.13731.
GBP/USD
GBP/USD exhibits a consistently bearish technical sentiment across all analyzed timeframes. The daily RSI is at 45.3, and the MACD histogram is flat. The 1-hour RSI is 42.6, and the 4-hour RSI is 48.4, both below the 50 level, reinforcing the bearish outlook. The key levels to watch are resistance at R1 1.35105 and the Pivot at 1.33777. Support is found at S1 1.32893 and S2 1.31565.
| Resistance | Price |
|---|---|
| R3 | 1.37317 |
| R2 | 1.35989 |
| R1 | 1.35105 |
| Pivot | 1.33777 |
| Support | Price |
|---|---|
| S1 | 1.32893 |
| S2 | 1.31565 |
| S3 | 1.30681 |
| Fib 38.2% | 1.35000 |
Given the prevailing bearish signals and potential for a stronger USD, GBP/USD is likely to remain under pressure. A sustained move below the Pivot point could lead to a retest of the S1 support level.
USD/JPY
USD/JPY displays a strong bullish technical bias across all timeframes. The daily RSI is at 59.5, and the MACD histogram is positive at +0.07. The 1-hour RSI is 63.4, and the 4-hour RSI is 55.0, both indicating bullish momentum. The pair is trading above its short-term SMAs. Key resistance levels are at R1 159.23 and the Pivot at 158.37. Support is found at S1 156.89.
| Resistance | Price |
|---|---|
| R3 | 161.57 |
| R2 | 160.71 |
| R1 | 159.23 |
| Pivot | 158.37 |
| Support | Price |
|---|---|
| S1 | 156.89 |
| S2 | 156.03 |
| S3 | 154.55 |
| Fib 50.0% | 155.99 |
With the Bank of Japan potentially maintaining its accommodative stance while other central banks tighten, USD/JPY could continue to appreciate. A break above R1 159.23 would signal further upside potential towards R2 160.71.
AUD/USD
AUD/USD shows a predominantly bearish technical outlook. The daily RSI is at 48.0, suggesting neutrality with a slight lean towards bearishness, and the MACD histogram is flat. Shorter timeframes are more bearish, with the 1-hour RSI at 34.3 and the 4-hour RSI at 42.8. The weekly sentiment is 'SELL'. Key resistance is at R1 0.71284 and the Pivot at 0.70636. Support levels are S1 0.70193 and S2 0.69545.
| Resistance | Price |
|---|---|
| R3 | 0.72375 |
| R2 | 0.71727 |
| R1 | 0.71284 |
| Pivot | 0.70636 |
| Support | Price |
|---|---|
| S1 | 0.70193 |
| S2 | 0.69545 |
| S3 | 0.69102 |
| Fib 38.2% | 0.70000 |
Given the broad-based dollar strength and risk-off sentiment, AUD/USD is likely to face headwinds. A confirmed break below the S1 support at 0.70193 could trigger a decline towards the 0.69545 level.
NZD/USD
NZD/USD mirrors the bearish sentiment seen in AUD/USD. The daily RSI is at 42.9, with a flat MACD histogram. The 1-hour RSI is 37.6 and the 4-hour RSI is 46.4, both indicating weak momentum. The weekly sentiment is 'SELL'. Key resistance resides at R1 0.59128 and the Pivot at 0.58484. Support is situated at S1 0.58055 and S2 0.57411.
| Resistance | Price |
|---|---|
| R3 | 0.60201 |
| R2 | 0.59557 |
| R1 | 0.59128 |
| Pivot | 0.58484 |
| Support | Price |
|---|---|
| S1 | 0.58055 |
| S2 | 0.57411 |
| S3 | 0.56982 |
| Fib 50.0% | 0.59000 |
With the prevailing risk-off mood and a potentially strong USD, NZD/USD could experience further downside. A decisive breach of the 0.58055 support level would target the 0.57411 mark.
Precious Metals Outlook
Gold (XAU/USD)
Gold is exhibiting strong bearish signals across multiple timeframes. The daily RSI is at 29.7, deep in oversold territory, and the MACD histogram is significantly negative at -78.44. The 1-hour RSI is 29.5, and the 4-hour RSI is 19.3, both indicating extreme oversold conditions. The weekly sentiment is 'NEUTRAL', a divergence from the shorter-term sell signals. Key support is at S1 4,479.29 and the 61.8% Fibonacci retracement at 5,140.73. Resistance is seen at the Pivot of 4,673.13, with R1 at 4,844.03.
| Resistance | Price |
|---|---|
| R3 | 5,208.77 |
| R2 | 5,037.87 |
| R1 | 4,844.03 |
| Pivot | 4,673.13 |
| Support | Price |
|---|---|
| S1 | 4,479.29 |
| S2 | 4,308.39 |
| S3 | 4,114.55 |
| Fib 61.8% | 5,140.73 |
Despite the deeply oversold conditions, the prevailing risk-off sentiment and potential for a stronger USD could continue to weigh on gold prices. Traders will be watching closely to see if the oversold readings lead to a short-covering rally, potentially testing the Pivot at 4,673.13.
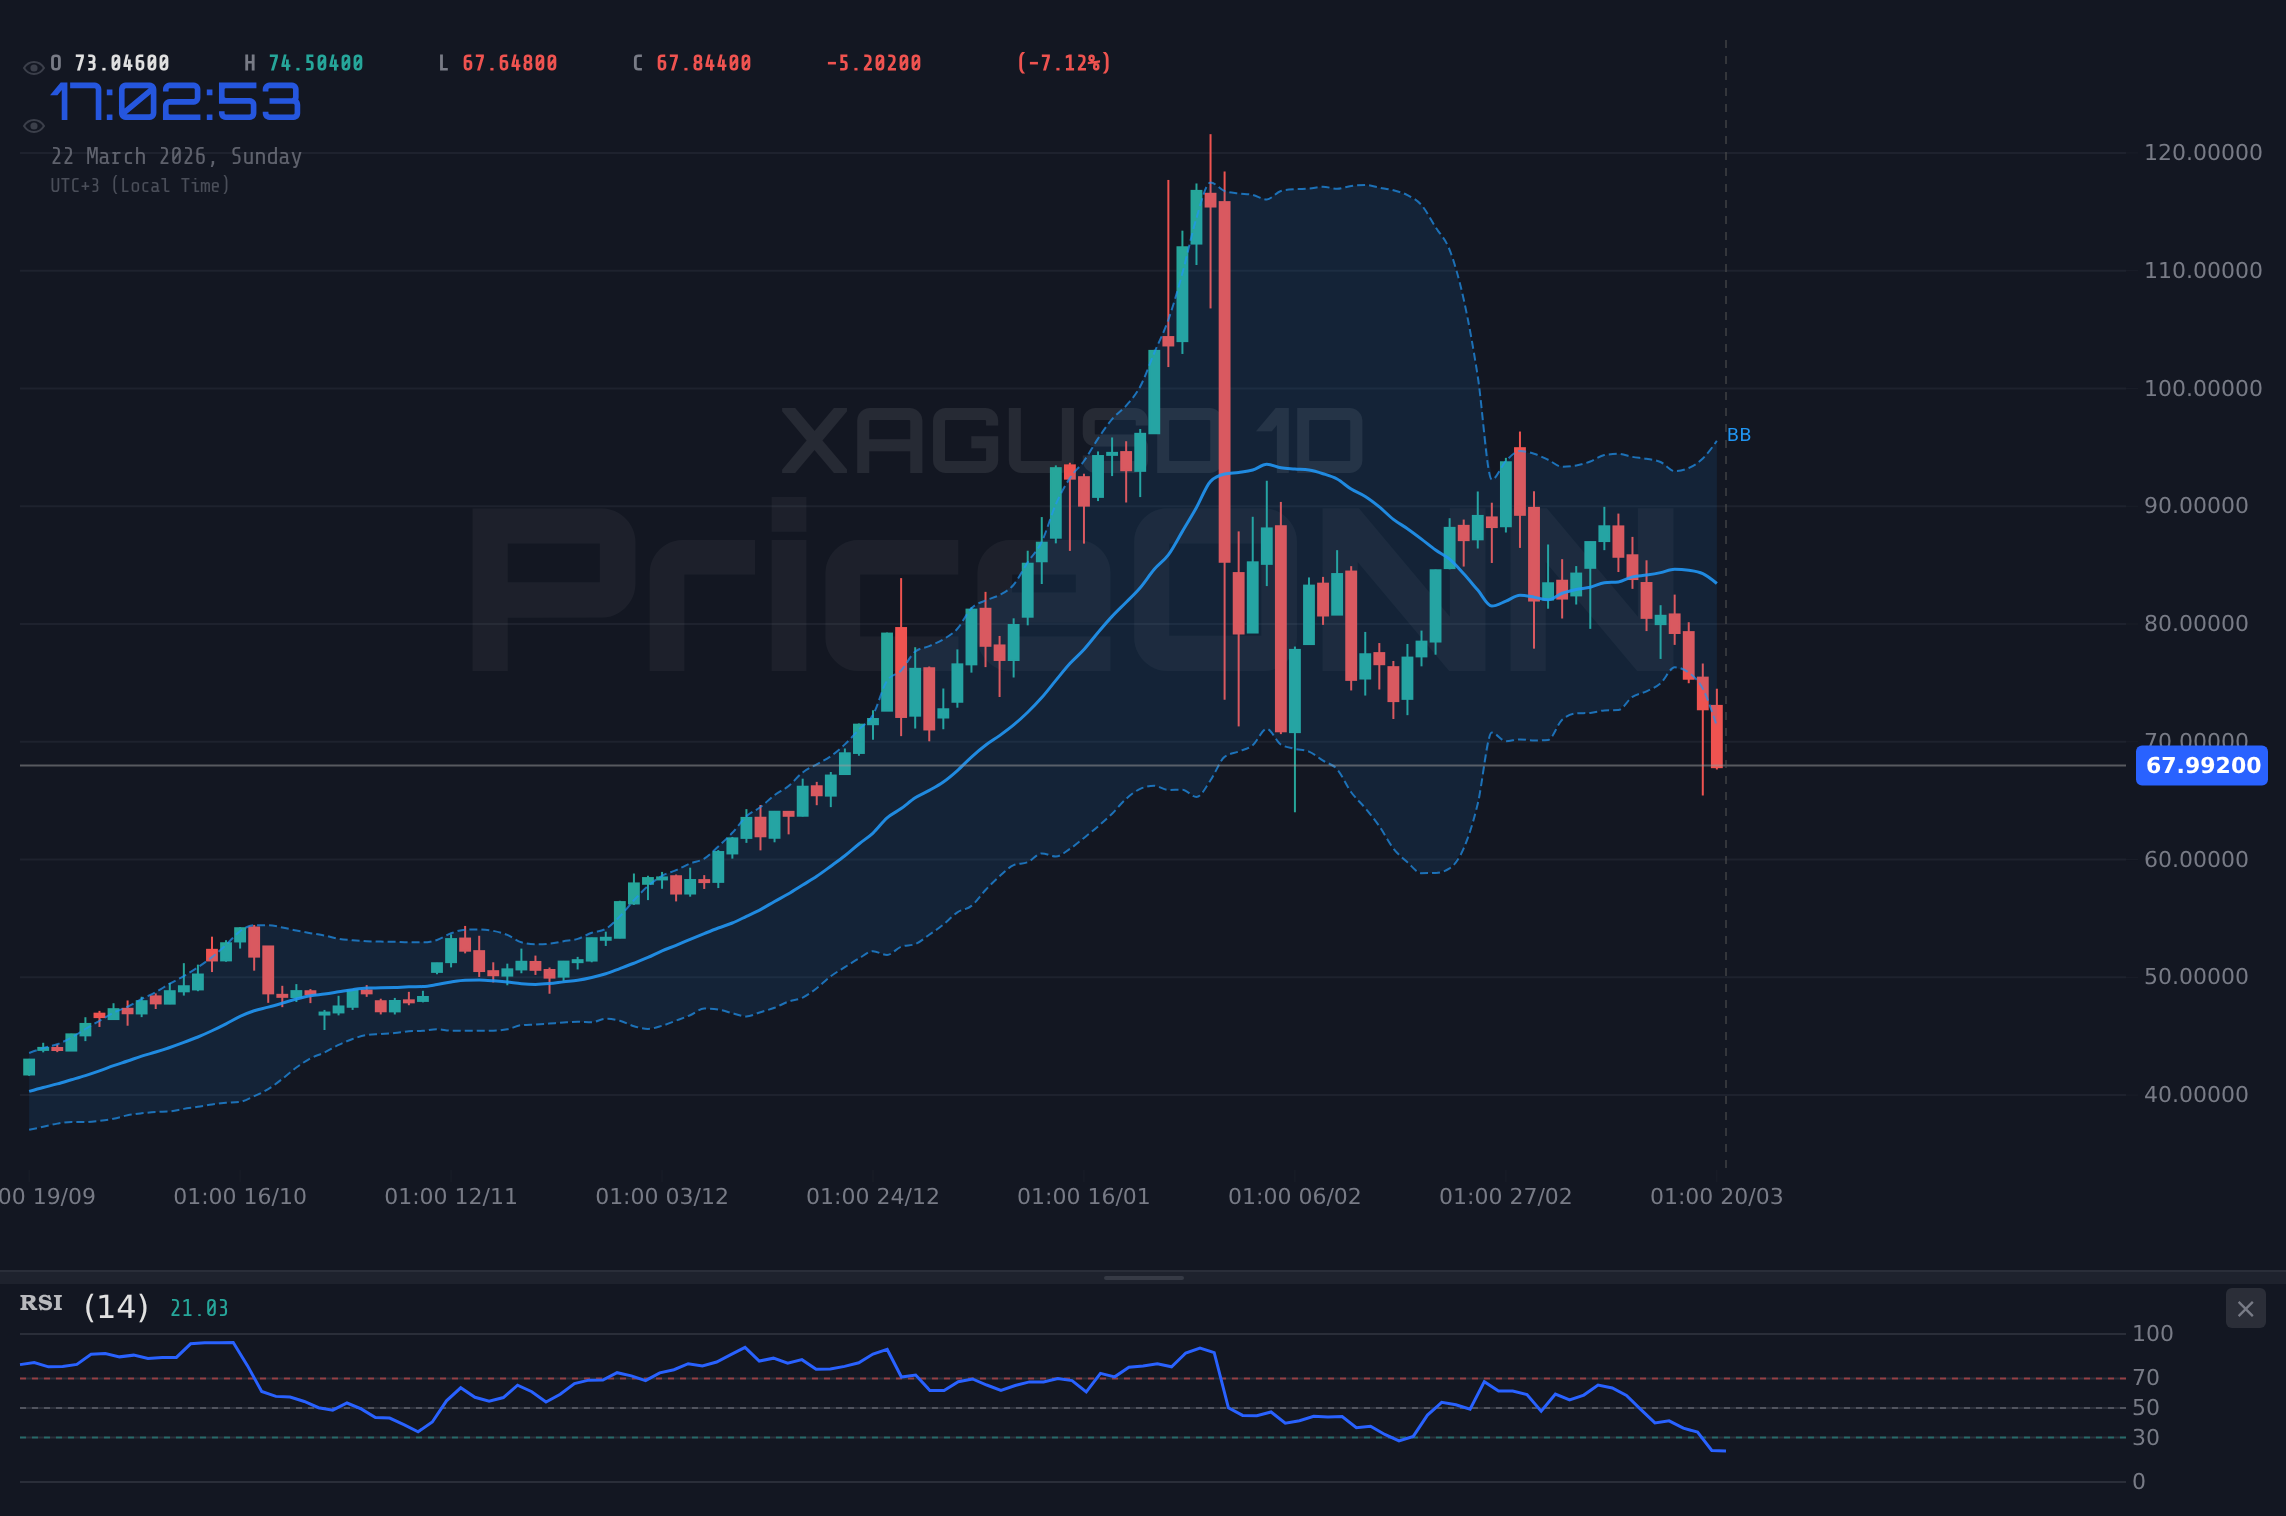
Silver (XAG/USD)
Silver also presents a bearish technical picture, mirroring gold's trend. The daily RSI is 33.6, in oversold territory, with a negative MACD histogram of -1.75. The 1-hour RSI is 30.8, and the 4-hour RSI is 27.4, both indicating weakness. The weekly sentiment is 'SELL'. Significant support lies at S1 66.580 and the 38.2% Fibonacci level at 86.010. Resistance is noted at the Pivot of 71.610, with R1 at 77.790.
| Resistance | Price |
|---|---|
| R3 | 89.000 |
| R2 | 82.820 |
| R1 | 77.790 |
| Pivot | 71.610 |
| Support | Price |
|---|---|
| S1 | 66.580 |
| S2 | 60.410 |
| S3 | 55.380 |
| Fib 38.2% | 86.010 |
The bearish technicals and potential for a stronger dollar suggest further downside for silver. A break below S1 66.580 could lead to a test of the 60.410 support level.
Energy Markets Outlook
Brent Crude Oil
Brent crude oil is demonstrating strong bullish momentum. The daily RSI is at 82.4, indicating extreme overbought conditions, and the MACD histogram is positive at +1.98. The 1-hour RSI is 61.1 and the 4-hour RSI is 60.3, showing continued buying interest. The weekly sentiment is 'BUY'. Key resistance is at R1 116.63 and R2 125.65. Support is found at the Pivot of 110.26 and S1 101.24.
| Resistance | Price |
|---|---|
| R3 | 132.02 |
| R2 | 125.65 |
| R1 | 116.63 |
| Pivot | 110.26 |
| Support | Price |
|---|---|
| S1 | 101.24 |
| S2 | 94.87 |
| S3 | 85.85 |
| Fib 38.2% | 98.16 |
Geopolitical tensions and supply-side concerns, as highlighted by recent news regarding Qatar's energy hub, are likely to underpin oil prices. Despite overbought conditions, the trend may persist. Traders will monitor any signs of a potential reversal or consolidation near resistance levels.
WTI Crude Oil
WTI crude oil mirrors the bullish strength seen in Brent. The daily RSI is at 70.6, in overbought territory, with a positive MACD histogram of +1.09. The 1-hour RSI is 61.5 and the 4-hour RSI is 57.1, indicating sustained buying pressure. The weekly sentiment is 'BUY'. Resistance levels are R1 99.60 and R2 104.37. Support is located at the Pivot of 96.03 and S1 91.26.
| Resistance | Price |
|---|---|
| R3 | 107.94 |
| R2 | 104.37 |
| R1 | 99.60 |
| Pivot | 96.03 |
| Support | Price |
|---|---|
| S1 | 91.26 |
| S2 | 87.69 |
| S3 | 82.92 |
| Fib 38.2% | 96.15 |
Similar to Brent, WTI is likely to benefit from ongoing supply concerns and geopolitical factors. While overbought conditions warrant caution, the upward trend may continue. Monitoring the 99.60 resistance level will be crucial.
Cryptocurrency Outlook
Bitcoin (BTC/USD)
Bitcoin is showing significant bearish pressure on shorter timeframes. The daily RSI is at 45.0, approaching the neutral zone, but the MACD histogram is negative at -31.73. The 1-hour RSI is 36.4 and the 4-hour RSI is 31.3, both indicating oversold conditions and potential for a bounce. The weekly sentiment is 'SELL'. Key support is at S1 70,007 and the 50% Fibonacci retracement at 69,716. Resistance is at the Pivot of 70,555 and R1 70,898.
| Resistance | Price |
|---|---|
| R3 | 71,789 |
| R2 | 71,446 |
| R1 | 70,898 |
| Pivot | 70,555 |
| Support | Price |
|---|---|
| S1 | 70,007 |
| S2 | 69,664 |
| S3 | 69,116 |
| Fib 50.0% | 69,716 |
The prevailing risk-off sentiment may continue to pressure Bitcoin. A failure to hold the 70,007 support could lead to a sharper decline towards 69,664. Conversely, a bounce from oversold levels could test the Pivot at 70,555.
Ethereum (ETH/USD)
Ethereum presents a mixed technical outlook, with bearish short-term signals but a daily RSI at 47.5, suggesting potential for stabilization. The MACD histogram is positive at +7.02 on the daily chart, a divergence from shorter-term sell signals. The 1-hour RSI is 35.3 and the 4-hour RSI is 33.0, both indicating oversold conditions. The weekly sentiment is 'SELL'. Key support is at S1 2,139.04 and the 50% Fibonacci level at 2,108.02. Resistance is at the Pivot of 2,152.57 and R1 2,164.66.
| Resistance | Price |
|---|---|
| R3 | 2,190.28 |
| R2 | 2,178.19 |
| R1 | 2,164.66 |
| Pivot | 2,152.57 |
| Support | Price |
|---|---|
| S1 | 2,139.04 |
| S2 | 2,126.95 |
| S3 | 2,113.42 |
| Fib 50.0% | 2,108.02 |
Ethereum's price action will likely be influenced by broader cryptocurrency market sentiment and potential short-covering rallies from oversold levels. A decisive break below S1 2,139.04 could signal further weakness towards 2,126.95.
Stock Indices Outlook
S&P 500
The S&P 500 is exhibiting strong bearish technical signals. The daily RSI is at 32.5, deep in oversold territory, and the MACD histogram is negative at -21.89. Shorter timeframes are also bearish, with the 1-hour RSI at 37.7 and the 4-hour RSI at 32.4. The weekly sentiment is 'SELL'. Key support is at S1 6,570 and S2 6,523. Resistance is at the Pivot of 6,606 and R1 6,652.
| Resistance | Price |
|---|---|
| R3 | 6,735 |
| R2 | 6,688 |
| R1 | 6,652 |
| Pivot | 6,606 |
| Support | Price |
|---|---|
| S1 | 6,570 |
| S2 | 6,523 |
| S3 | 6,487 |
| Fib 23.6% | 6,600 |
The risk-off sentiment and bearish technicals suggest continued pressure on the S&P 500. A break below the 6,570 support level could lead to a test of the 6,523 level. Upside may be limited unless key economic data prompts a shift in risk appetite.
Nasdaq 100
The Nasdaq 100 shows similar bearish characteristics to the S&P 500. The daily RSI is at 37.2, indicating oversold conditions, and the MACD histogram is negative at -58.98. The 1-hour RSI is 35.1 and the 4-hour RSI is 31.3, both reinforcing the bearish outlook. The weekly sentiment is 'SELL'. Key support is at S1 24,166 and S2 23,938. Resistance is at the Pivot of 24,334 and R1 24,562.
| Resistance | Price |
|---|---|
| R3 | 24,957 |
| R2 | 24,730 |
| R1 | 24,562 |
| Pivot | 24,334 |
| Support | Price |
|---|---|
| S1 | 24,166 |
| S2 | 23,938 |
| S3 | 23,770 |
| Fib 23.6% | 24,338 |
Bearish momentum is likely to persist for the Nasdaq 100. A fall below the 24,166 support level could expose the 23,938 area. Any rallies may face resistance near the Pivot at 24,334.
Dow Jones 30
The Dow Jones 30 also displays a bearish technical setup. The daily RSI is at 27.1, deeply oversold, with a sharply negative MACD histogram at -196.93. Shorter timeframes echo this sentiment, with the 1-hour RSI at 44.7 and the 4-hour RSI at 35.5. The weekly sentiment is 'SELL'. Support is located at S1 45,772 and S2 45,458. Resistance is found at the Pivot of 46,038 and R1 46,352.
| Resistance | Price |
|---|---|
| R3 | 46,932 |
| R2 | 46,618 |
| R1 | 46,352 |
| Pivot | 46,038 |
| Support | Price |
|---|---|
| S1 | 45,772 |
| S2 | 45,458 |
| S3 | 45,192 |
| Fib 23.6% | 46,581 |
The Dow Jones is expected to remain under pressure, with a potential for further declines if the 45,772 support fails. A move towards the 45,458 level is possible if risk sentiment deteriorates further.
Economic Calendar Preview
US Consumer Price Index (CPI) - Tuesday, March 24, 12:30 UTC
Forecast: 0.4% | Previous: 0.3%
| Scenario | Condition | Expected Impact |
|---|---|---|
| Better than expected | Actual > 0.4% | USD strengthens - Higher inflation could reinforce expectations for a hawkish Federal Reserve stance, potentially leading to higher interest rates for longer. |
| In line with forecast | Actual ≈ 0.4% | Neutral reaction |
| Worse than expected | Actual < 0.4% | USD weakens - Lower-than-expected inflation might reduce pressure on the Fed to hike rates, or even open the door for potential rate cuts sooner, weakening the dollar. |
US Non-Farm Payrolls - Friday, March 27, 12:30 UTC
Forecast: 190K | Previous: 220K
| Scenario | Condition | Expected Impact |
|---|---|---|
| Better than expected | Actual > 190K | USD strengthens - A robust jobs report would signal a healthy labor market, supporting the Federal Reserve's case for maintaining a restrictive monetary policy. |
| In line with forecast | Actual ≈ 190K | Neutral reaction |
| Worse than expected | Actual < 190K | USD weakens - A weaker-than-expected jobs number could raise concerns about economic growth and reduce expectations for Fed tightening, potentially pressuring the dollar. |
Weekly Trading Bias
The upcoming week appears to favor a risk-off environment, underpinned by a potentially strengthening US Dollar and robust energy prices. Equity indices and cryptocurrencies are showing significant bearish technical signals, suggesting they may be vulnerable to further declines.
- Currencies: Bias towards USD strength, with potential weakness in EUR, GBP, AUD, and NZD. USD/JPY expected to remain strong.
- Precious Metals: Gold and Silver are technically oversold but could face further pressure from dollar strength and risk aversion. A short-covering rally is possible but faces headwinds.
- Energy: Brent and WTI crude oil exhibit strong bullish momentum, likely to be supported by supply concerns. Overbought conditions warrant caution for extended rallies.
- Equities: Bearish bias across major indices, with potential for further downside testing key support levels.
- Cryptocurrencies: Similar to equities, a bearish bias prevails, with oversold conditions suggesting potential for short-term bounces but a continuation of the downtrend is more probable if risk-off sentiment persists.
Traders should closely monitor the upcoming economic data releases, particularly US inflation and employment figures, as these will be critical in determining the market's risk appetite and the trajectory of major asset classes.
Track markets in real-time
AI-powered analysis, technical indicators and real-time price data.
Join Our Telegram Channel
Breaking market news, AI analysis and trading signals instantly.
Join Channel