Weekly Market Review: Middle East Crisis Fuels Oil Surge, Dollar Strength, and Gold Rally
A comprehensive weekly market review covering forex, commodities, crypto, and indices. Analysis of geopolitical events, economic data, and technical indicators.
Weekly Market Review: March 2, 2026 – March 8, 2026 (Week 10)
Welcome to this week's market review. Geopolitical tensions, particularly escalating conflict in the Middle East, have dominated market sentiment. This has led to a surge in oil prices, a rally in gold as a safe-haven asset, and a strengthening US dollar. Economic data releases have also played a role, with surprises in US inflation and consumer confidence impacting currency valuations.
Executive Summary
Oil Prices Surge:WTIcrude oil jumped to $70.56, a +4.74% daily increase, driven by escalating Middle East tensions.
Gold Rallies: XAUUSD advanced, buoyed by safe-haven demand, with prices nearing $5,300. The daily RSI is at 62.5, indicating strong momentum.
Dollar Strength: The Dollar Index (DXY) climbed to 98.202, a +0.9% daily increase, fueled by safe-haven flows.
Equity Markets Mixed: The S&P 500 closed at 6,886 (+0.17%), while the Nasdaq 100 reached 25,019 (+0.29%), reflecting a cautious approach amid global uncertainty.
US Dollar & DXY Analysis
The US Dollar Index (DXY) has exhibited notable strength, closing at 98.202, a +0.9% daily gain. This surge reflects its safe-haven appeal amidst escalating geopolitical risks. On the daily timeframe, the RSI(14) stands at 61.3, indicating increasing bullish momentum, although not yet in overbought territory. The MACD histogram shows a positive value of +0.14, supporting the upward trend. The ADX, while at a nominal value of 1.0, suggests that the trend strength is still developing. Looking at shorter timeframes, the 1H and 4H charts also show bullish signals with RSI values of 64.4 and 68.7 respectively, and positive MACD histograms. The weekly chart also shows a buy signal.
EUR/USD declined to 1.16994, a -0.95% daily drop, reflecting the dollar's strength. The daily RSI sits at 47.7, indicating bearish momentum. The MACD histogram is at 0.00, showing a lack of clear direction, while the ADX is also at 1.0, suggesting a weak trend. The price is currently below the 20-day SMA of 1.18211. The 1H and 4H timeframes confirm the bearish sentiment, with RSI values of 38.9 and 33.4 respectively. The weekly chart, however, shows a buy signal.
GBP/USD fell to 1.34057, a -0.53% daily decline. The daily RSI is at 41.6, suggesting bearish momentum. The MACD histogram is at 0.00, indicating a lack of trend strength. The price is below its 20-day SMA of 1.35622. Short-term indicators also point to weakness. The weekly signal is SELL.
USD/JPY rose to 157.40, a +0.83% daily increase, driven by dollar strength and risk-on sentiment. The daily RSI is at 61.4, indicating bullish momentum. The MACD histogram is positive at +0.37, supporting the uptrend. The price is above its 20-day SMA of 155.18. All timeframes show a BUY signal.
AUD/USD declined to 0.70798, a -0.33% daily decrease. The daily RSI is at 63.0, indicating bullish momentum, but showing signs of weakening. The MACD histogram is at 0.00, suggesting a lack of clear direction. The price is slightly above its 20-day SMA of 0.70565. The weekly signal is BUY.
NZD/USD fell to 0.59374, a -0.95% daily decrease. The daily RSI is at 52.7. The MACD histogram is at 0.00, indicating a lack of trend strength. The price is below its 20-day SMA of 0.60034. Short-term indicators are bearish, while the weekly shows a BUY signal.
Resistance
Price
R3
0.60470
R2
0.60253
R1
0.60099
Pivot
0.59882
Support
Price
S1
0.59728
S2
0.59511
S3
0.59357
Fib 61.8%
0.59000
Precious Metals
Gold (XAU/USD)
Gold prices have rallied towards $5,300, driven by safe-haven demand amid escalating geopolitical tensions and rising oil prices. The daily RSI is at 62.5, suggesting increasing bullish momentum. The MACD histogram is positive at +12.68, supporting the upward trend. The price is trading above its 20-day SMA of 5,051.81. The weekly RSI of 80.9 indicates overbought conditions, suggesting potential for a pullback. A review of our daily bulletin suggests similar conclusions.
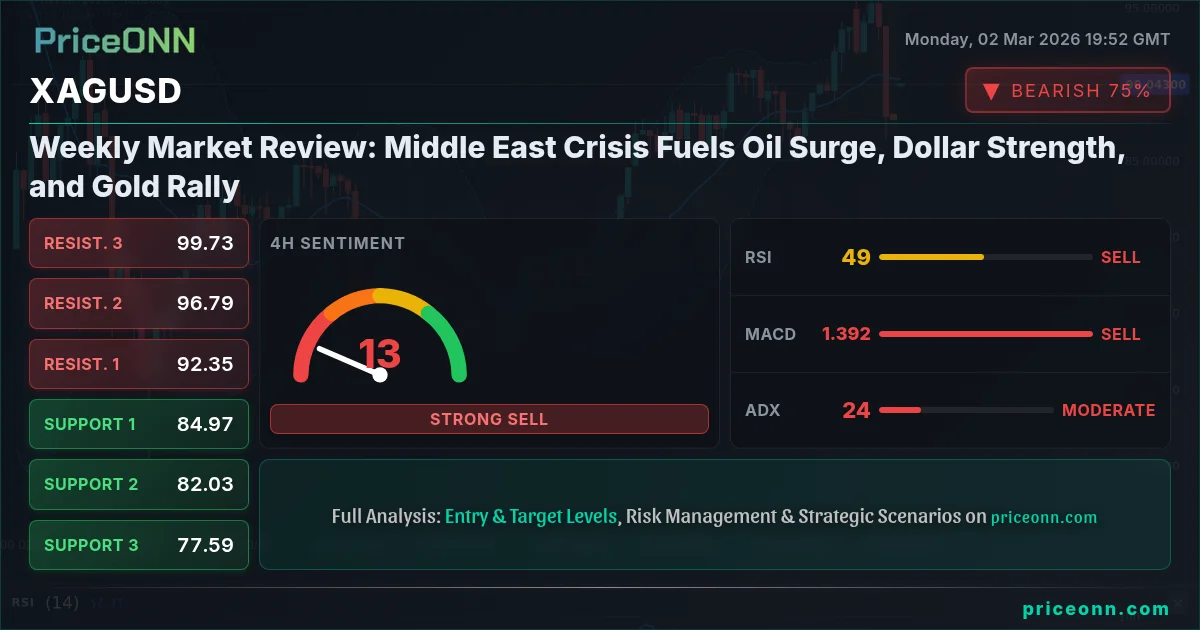
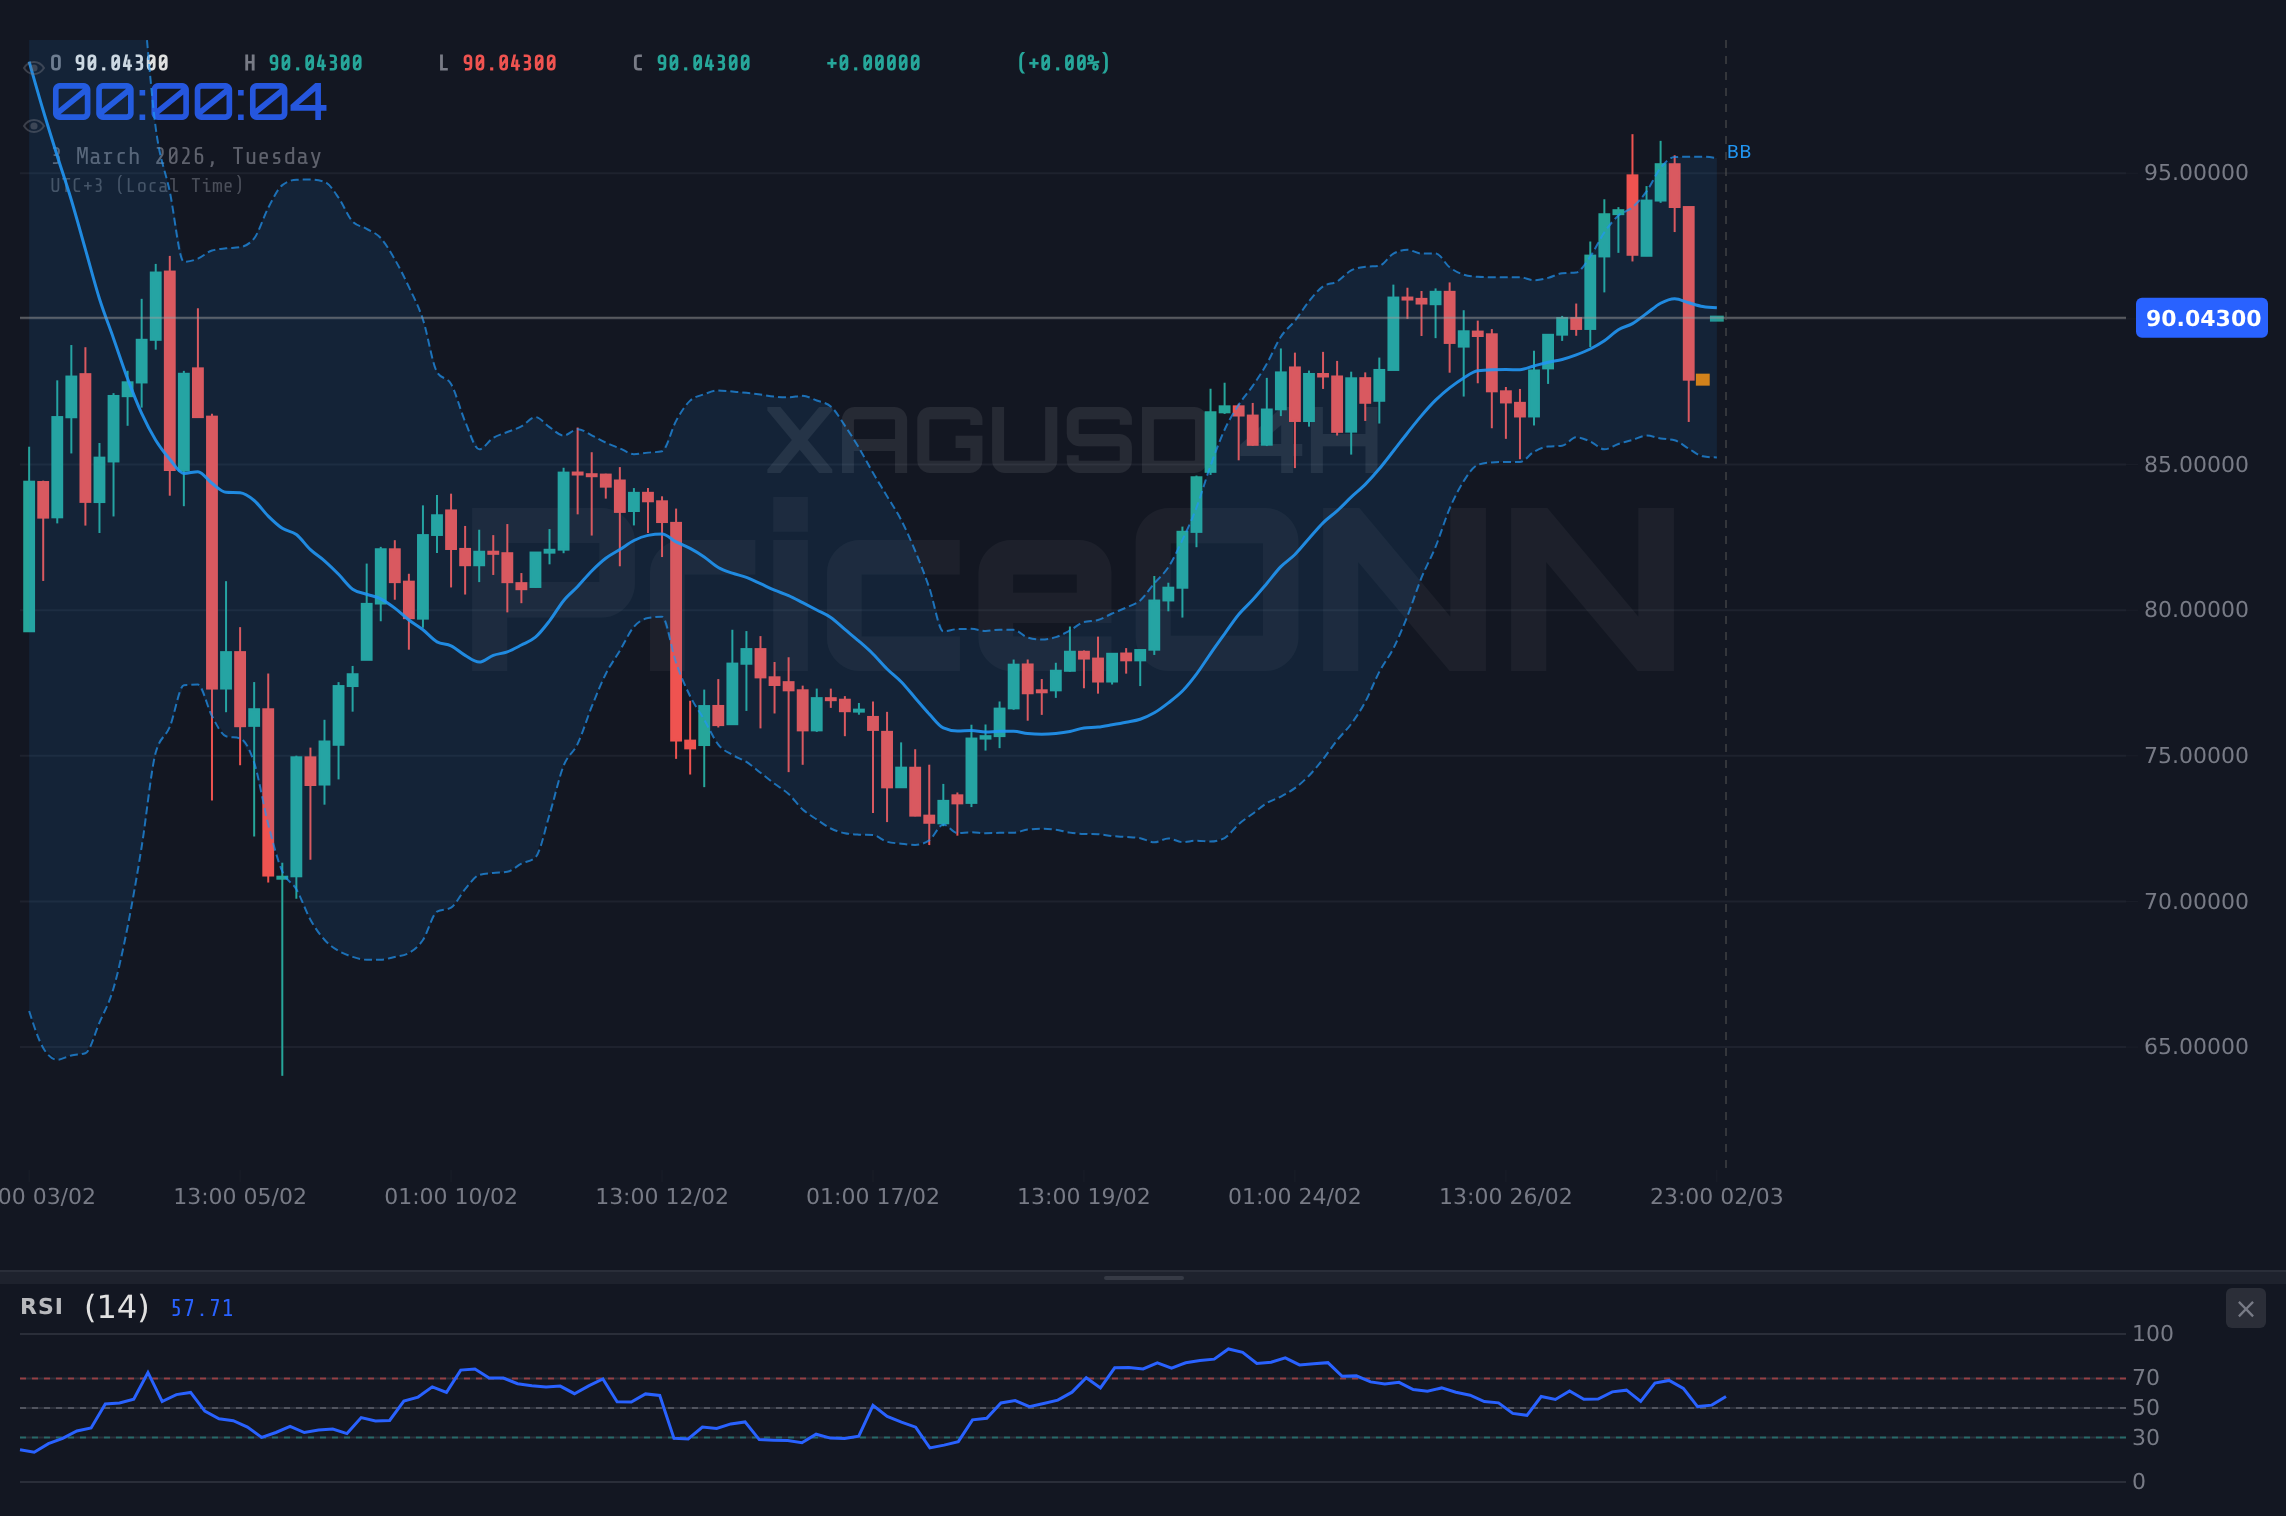
Silver experienced a significant daily decline of -6.23%, closing at 87.889. The daily RSI is at 52.6. The MACD histogram is positive at +1.08, but showing signs of weakness. The price is well above its 200-day SMA of 52.929. The sentiment is SELL.
Resistance
Price
R3
102.310
R2
98.210
R1
95.970
Pivot
91.870
Support
Price
S1
89.630
S2
85.530
S3
83.290
Fib 61.8%
86.010
Energy Markets
Brent Crude Oil
Brent crude oil closed at $65.73, a +1.96% daily increase. The daily RSI is at 60.0, indicating bullish momentum. The MACD histogram is positive at +0.24, supporting the uptrend. The price is trading above its 20-day SMA of 63.29 and approaching the upper Bollinger Band at 66.76, suggesting potential for overbought conditions. The ADX is at 1.0, a very weak trend signal.
WTI Crude Oil
WTI crude oil surged to $70.56, a +4.74% daily increase, driven by escalating geopolitical tensions. The daily RSI is at 70.8, indicating overbought conditions. The MACD histogram is positive at +0.31, supporting the uptrend. The price is trading above its 20-day SMA of 65.03 and approaching the upper Bollinger Band at 68.82, suggesting potential for a pullback. The weekly RSI is at 65.4. The ADX is at 1.0.
Bitcoin closed at $68,876, a +4.88% daily increase. The daily RSI is at 47.7. The MACD histogram is positive at +767.45, supporting the uptrend. The price is trading above its 20-day SMA of 67,341. The weekly RSI is at 31.6, indicating it is not yet overbought. The chart analysis indicates a neutral signal.
Ethereum closed at $2,029.64, a +5.34% daily increase. The daily RSI is at 46.6. The MACD histogram is positive at +37.02, supporting the uptrend. The price is trading above its 20-day SMA of 1,971.60. The weekly RSI is at 34.3.
The S&P 500 closed at 6,886, a +0.17% daily increase. The daily RSI is at 49.5. The MACD histogram is positive at +1.25. The price is trading around its 20-day SMA of 6,885. The weekly signal is BUY.
The Nasdaq 100 closed at 25,019, a +0.29% daily increase. The daily RSI is at 48.8. The MACD histogram is positive at +33.65. The price is trading around its 20-day SMA of 24,940. The weekly signal is SELL.
The Dow Jones 30 closed at 48,965, a +0.03% daily increase. The daily RSI is at 45.7. The MACD histogram is negative at -97.28. The price is trading below its 20-day SMA of 49,461. The weekly signal is BUY.
Resistance
Price
R3
50,010
R2
49,678
R1
49,314
Pivot
48,982
Support
Price
S1
48,618
S2
48,286
S3
47,922
Fib 61.8%
48,820
Economic Calendar Impact
Several key economic events impacted the markets this past week:
U.S. Chicago Purchasing Managers Index (PMI): The actual reading of 57.7 significantly exceeded the forecast of 52, indicating stronger-than-expected economic activity in the Chicago region. This positive surprise likely contributed to dollar strength as it suggests a robust economic environment.
U.S. Producer Price Index (PPI) MoM: The actual PPI of 0.5% was above the forecast of 0.3%, indicating higher inflationary pressures. This likely supported dollar strength as it could prompt the Federal Reserve to maintain a hawkish stance on monetary policy.
Germany Consumer Price Index (CPI) MoM: The actual CPI of 0.2% was below the forecast of 0.5%, suggesting weaker inflationary pressures in Germany. This likely weighed on the Euro.
U.S. Initial Jobless Claims: The actual number of 212K was below the forecast of 217K, indicating a strong labor market. This likely contributed to dollar strength.
U.S. Crude Oil Inventories: The actual increase of 15.989 million barrels was significantly higher than the forecast of 1.8 million barrels, suggesting weaker demand. However, geopolitical tensions overshadowed this, keeping oil prices elevated.
U.S. CB Consumer Confidence: The actual reading of 91.2 was above the forecast of 87.4, signaling stronger consumer confidence. This likely boosted the dollar.
This Week Outlook (March 2, 2026 – March 8, 2026)
This week, several high-impact economic events are scheduled that could influence market movements:
Time (UTC)
Event
Currency
Importance
Forecast
Previous
Tue 03 10:00
Eurozone Consumer Price Index (CPI) YoY
EUR
HIGH
-
1.7
Tue 03 10:00
United Kingdom Spring Forecast Statement
GBP
HIGH
-
-
Wed 04 13:15
U.S. ADP Nonfarm Employment Change
USD
HIGH
-
22
Wed 04 14:45
U.S. Services Purchasing Managers Index (PMI)
USD
HIGH
52.3
52.7
Wed 04 15:00
U.S. ISM Non-Manufacturing Prices
USD
HIGH
-
66.6
Wed 04 15:00
U.S. ISM Non-Manufacturing Purchasing Manager
USD
HIGH
-
53.8
Wed 04 15:30
U.S. Crude Oil Inventories
USD
HIGH
-
15.989
Eurozone Consumer Price Index (CPI) YoY
Scenario
Condition
Expected Market Impact
Better than expected
Actual > [forecast]
EUR strengthens – EUR/USD rises – Higher inflation could prompt the ECB to consider tightening monetary policy sooner than anticipated.
In line with forecast
Actual ≈ [forecast]
Neutral/muted reaction, existing trend continues
Worse than expected
Actual < [forecast]
EUR weakens – EUR/USD falls – Lower inflation could pressure the ECB to maintain its dovish stance.
U.S. ADP Nonfarm Employment Change
Scenario
Condition
Expected Market Impact
Better than expected
Actual > [forecast]
USD strengthens – USD/JPY rises – A strong jobs report could signal a robust economy, increasing the likelihood of further Fed rate hikes.
In line with forecast
Actual ≈ [forecast]
Neutral/muted reaction, existing trend continues
Worse than expected
Actual < [forecast]
USD weakens – USD/JPY falls – A weak jobs report could signal a slowing economy, decreasing the likelihood of further Fed rate hikes.
U.S. ISM Non-Manufacturing Purchasing Manager
Scenario
Condition
Expected Market Impact
Better than expected
Actual > [forecast]
USD strengthens – AUD/USD falls – A strong ISM reading points to economic strength, favoring a stronger dollar.
In line with forecast
Actual ≈ [forecast]
Neutral/muted reaction, existing trend continues
Worse than expected
Actual < [forecast]
USD weakens – AUD/USD rises – A weak ISM reading suggests economic weakness, favoring a weaker dollar.
The United Kingdom Spring Forecast Statement will also be closely watched for insights into the UK's economic outlook.
Risk Assessment
Based on the sentiment analysis across various assets, the overall market sentiment is mixed:
Geopolitical risks remain elevated, potentially triggering further safe-haven flows into the US dollar and gold. Economic data releases will be crucial in shaping monetary policy expectations and influencing currency valuations. Traders should closely monitor these developments and adjust their positions accordingly.
Disclaimer: This content is for informational and educational purposes only and does not constitute investment advice, financial recommendation, or an offer to buy or sell any financial instrument. Past performance does not guarantee future results. Always do your own research and consult a licensed financial advisor before making investment decisions.
Track markets in real-time
AI-powered analysis, technical indicators and real-time price data.
We are looking for writers who produce market analysis, macro commentary, and data-driven content. Reach readers in 10 languages through our multilingual publishing platform.